
Overview
- The 20 February 2026 SCOTUS ruling striking down the use of IEEPA for tariffs has triggered a rapid reconfiguration of US trade policy. While the initial ruling temporarily lowered effective US tariffs, the White House has turned to Section 122 tariffs to introduce a new 10 per cent import surcharge, reversing much of the previous decline.
- That trade policy remix has created a new pattern of winners and losers, with those countries previously subject to high IEEPA ‘top-up’ tariffs doing better. Australia has seen a slight relative deterioration under the new 10 per cent global tariff and would go further backwards under the threatened 15 per cent rate, although this should be offset via the indirect impact of changes for key trading partners.
- Overall, recent trade policy developments reinforce our view that US trade policy under the Trump administration is best treated as a persistent uncertainty shock.
In this edition we look at implications for international trade following the recent US Supreme Courtruling on IEEPA and the White House’s rapid reaction and then review Australia’s January inflation reading.
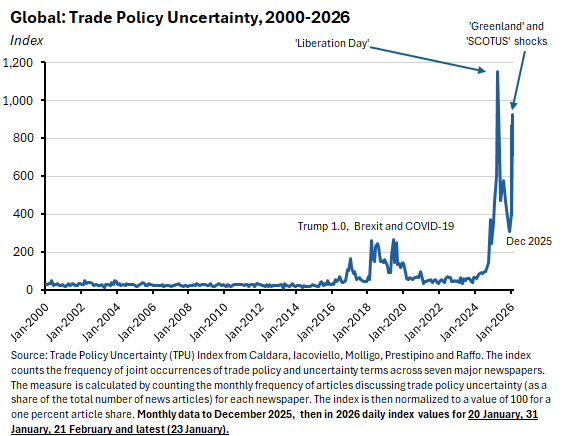
It has been… weeks…since we last discussed tariffs and trade policy. But on 20 February the Supreme Court of the United States (SCOTUS) struck down President Trump’s use of the International Emergency Economic Powers Act (IEEPA) in a six–three vote. Given that IEEPA has been one of the President’s favourite policy tools, the ruling was big news. As was President Trump’s response, which involved an immediate pledge to introduce a new 10 per cent global tariff, followed the next day by a threat to raise this to 15 per cent. The new levy has now taken effect with a 10 per cent rate, although the White House has said the administration remains committed to a 15 per cent tariff in the future. We dig into the details below and consider some of the implications.
Readers will also be well aware that along with trade policy uncertainty, the global economy is currently navigating a complex mix of geopolitical, technological and financial market uncertainty. The United States has poured military hardware into the Middle East and the risk of a US-Iran conflict remains elevated (we looked at the links between Iran and the oil market in a January piece). Meanwhile, markets are still scrambling to understand implications of the AI revolution for equity valuations, the viability of business models, and the economic outlook more generally. The way a speculative Substack post on AI managed to send markets tumbling is testimony to the fragile state of sentiment that has resulted.
Or put slightly differently: that global economic resilience we analysed a few weeks agoremains subject to a rolling sequence of stress tests.
Turning to the home front, here in Australia the ABS provided us with another inflation update this week. The January 2026 numbers came in a little hotter than markets had expected, maintaining pressure for further policy tightening. Expectations of higher interest rates also helped push up the Australian dollar. We review the latest Consumer Price Index (CPI) numbers below, along with the regular roundup of other data plus some suggestions for further reading and listening.
SCOTUS, IEEPA and a quick primer on US trade policy instruments
Before diving into the implications of that 20 February ruling by SCOTUS and the White House response, it is useful to understand a bit about the tools of US trade policy and the relationship between Congressional and Presidential authority to impose tariffs.
This Congressional Research Service Report from April 2025 is a helpful place to start. It explains that the US Constitution grants Congress the power to regulate foreign commerce, impose tariffs and collect revenue. At the same time, Congress has passed laws that authorise the President to adjust tariff rates on goods in certain circumstances. In the past, US courts have generally upheld these laws against constitutional challenges, holding that they do not impermissibly delegate Congress's legislative power over tariffs to the executive branch.
The CRS report highlights six statutory provisions that can in theory authorise the President to impose tariffs under various circumstances. Three of them (Section 232, Section 201, and Section 301) require a specific federal agency to conduct a formal investigation and to then make certain findings before tariffs can be imposed. The other three (Section 122, Section 338, and IEEPA) do not have this requirement.
- The International Emergency Economic Powers Act of 1977 (IEEPA) covers Emergency powers and is the obvious place to begin, since IEEPA is the instrument at the heart of the recent SCOTUS ruling and until then was a go-to trade policy tool for the Trump administration. IEEPA gives the US President broad authority to regulate a variety of economic transactions following the declaration of a national emergency. It empowers the President to exercise an array of economic powers ‘to deal with any unusual and extraordinary threat, which has its source in whole or substantial part outside the United States, to the national security, foreign policy, or economy of the United States, if the President declares a national emergency with respect to such threat.’ Historically, IEEPA has served as an integral part of the US international sanctions regime and most of the actions taken pursuant to IEEPA have involved blocking financial transactions and freezing assets.
Prior to 2025, no President had used IEEPA to impose tariffs but beginning in February last year, President Trump cited IEEPA to impose tariffs on a variety of trading partners to deal with what he described as national emergencies. These emergency measures included tariffs on Canada, Mexico, and China to deal with fentanyl trafficking and border issues, the threat of tariffs on countries importing Venezuelan oil, and proposed tariffs on Brazil to deal with ‘violations of the free expression rights of United States persons.’ Critically, IEEPA was also invoked in April 2025’s ‘Liberation Day’ introduction of so-called ‘reciprocal’ tariffs that imposed a baseline global tariff of ten per cent on imports from most US trading partners as well as in higher, country-specific tariffs (‘top-up’ tariffs) that were applied to imports from more than 50 countries.
- Section 232 of the Trade Expansion Act of 1962 covers National Security. It gives the President authority to impose duties and regulate foreign commerce in a particular good or set of goods. Implementation first requires the US Secretary of Commerce to carry out an investigation and to determine that the imports in question ‘threaten to impair’ US national security. The focus of Section 232 is usually on the sectoral (industry) level.
During the first Trump Administration, the Commerce Department completed seven Section 232 investigations into aluminium, steel, cars and car parts, uranium, titanium sponge, transformers and transformer components and vanadium. All completed investigations, except for vanadium, found a threat to U.S. national security. To date, Trump 2.0 has introduced a series of Section 232 investigations including copper; timber, lumber and derivative products; semiconductors and related manufacturing equipment; and pharmaceuticals and pharmaceutical ingredients.
- Section 301 of the Trade Act of 1974 provides Relief from unfair trade practices. It grants the Office of the United States Trade Representative (USTR) a range of responsibilities and authorities to investigate and act (including by imposing a tariff) to enforce US rights under trade agreements and to respond to certain foreign trade practices. An investigation under Section 301 can occur if the rights of the United States under any trade agreement are being denied, or an act, policy, or practice of a foreign government is judged to be burdening or restricting US commerce. Section 301 does not set a maximum tariff rate, although any measures terminate automatically after four years, unless the USTR decides to extend them. It was originally used to target Japanese competition and was first deployed against Tokyo during the Reagan administration.
The first Trump Administration investigated foreign trade practices under Section 301 six times. Two investigations into China and the EU resulted in the imposition of tariffs. Under Trump 2.0, USTR has initiated investigations into Brazil's practices related to digital trade and electronic payment services, ethanol market access, and other issues in July 2025, and into China's implementation of its commitments under the U.S.-China ‘Phase One’ deal in October 2025.
- Section 122 of the Trade Act of 1974 is targeted at International payments problems. It directs the President to take measures that may include a temporary import tariff when necessary to address ‘large and serious United States balance-of-payments deficits’ or certain other situations that present ‘fundamental international payments problems.’ It allows the President to introduce temporary tariffs of up to 15 per cent for up to 150 days. The measure does not require any previous investigation but once the 150 days expire, Congressional approval is required for any renewal. Until this month, Section 122 had never been used (although the Nixon administration planned to do so in the 1970s) and while the White House has already deployed it in response to the SCOTUS ruling, the applicability of the legislation to current circumstances has been questioned.
- Section 201 of the Trade Act of 1974 applies to Safeguarding domestic industries. It allows the President to provide temporary relief (generally up to 240 days) to US industry from foreign competition. Its use requires an investigation by the US International Trade Commission (ITC) to determine either injury or the threat of injury.
- Section 338 of the Tariff Act of 1930 is intended to Address discrimination against the United States. It directs the President to impose tariffs on articles produced by, or imported on the vessels of, foreign countries that discriminate against US commerce. Section 338 has never been implemented but in theory allows for tariffs of up to 50 per cent on countries’ imports if they are engaging in trade practices that the President finds discriminate against the United States.
In the current context, the key instruments are IEEPA and Section 122. IEEPA underpinned much of the Trump administration’s current tariff regime, including the ‘Liberation Day’ baseline and supplementary tariffs. And it was these tariffs that SCOTUS ruled unconstitutional.
The White House then invoked Section 122 to impose a flat surcharge of 10 per cent on most US imports with effect from 24 February 2026 for 150 days (exceptions include imports already subject to Section 232 tariffs, parts and components for civil aircraft, and products entering duty-free under the USMCA).
On 22 February, President Trump said he would increase the surcharge from 10 per cent to 15 per cent, although this second increase has yet to take effect, in part because it conflicts with commitments made in trade agreements now in place with key partners (see the country analysis below).
How have US tariff settings changed?
According to estimates from the Yale Budget Lab, the initial impact of SCOTUS striking down all IEEPA related tariffs was to take the average effective US tariff down by about seven percentage points, from 16 per cent to 9.1 per cent.
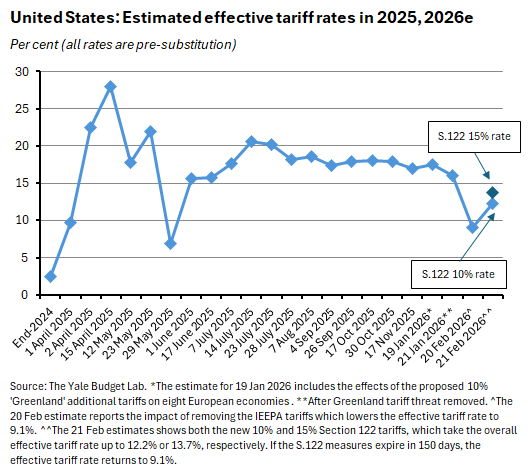
The Budget Lab also estimates that the subsequent introduction under Section 122 of a new 10 per cent tariff rate (now in force) would increase the effective US tariff rate to 12.2 per cent, assuming the measure is extended beyond 150 days. If the President were to proceed with his threatened 15 per cent rate, this would then increase further, to 13.7 per cent. On the other hand, if the Section 122 tariffs were allowed to elapse after 150 days, then the effective tariff rate would return to 9.1 per cent.
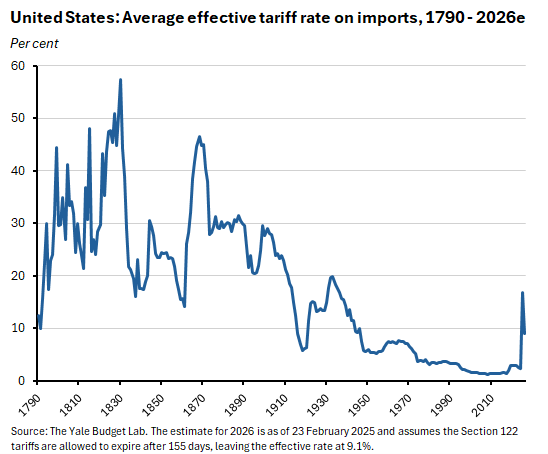
Even then, the new 9.1 per cent tariff rate would still represent the highest effective US tariff rate since 1947.
Note these estimates are all for pre-substitution tariff rates. That is, they do not try to estimate any potential shifts in spending patterns arising in response to relative tariff changes. Allow for those changes and the Budget Lab estimates that the post-SCOTUS, pre-Section 122 tariff rate would fall to around eight per cent, down from a 13.7 per cent rate. The corresponding post-substitution rates for the ten per cent and 15 per cent Section 122 tariffs (again assuming these were to be extended beyond the 150-day period) would be 10.9 per cent and 12.2 per cent, respectively.
Which countries are winners and losers from the change?
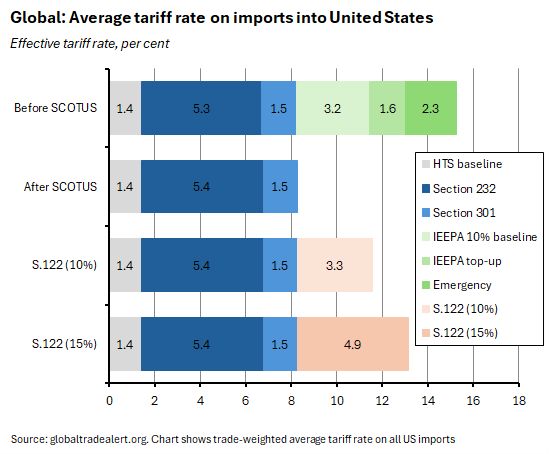
To answer this question, we shift to some alternative estimates constructed by Global Trade Alert. Note that the baseline numbers here are a bit different although they do tell the same story. For example, according to Global Trade Alert, the immediate impact of the SCOTUS ruling was again to take the trade-weighted average tariff on US imports down by about seven percentage points, in this case from 15.3 per cent to 8.3 per cent.
Remember, the SCOTUS ruling invalidated all trade policy measures imposed under IEEPA. That means it took out the IEEPA baseline tariff of ten per cent, all the IEEPA country-specific top-ups announced on Liberation Day, all emergency executive orders under IEEPA (such as the Canada/Mexico border emergency tariffs), and any IEEPA tariff floors that prevented other tariff instruments reduced the effective tariff rate below the IEEPA minimum.
That still left in place the Section 232 tariffs on steel, aluminium, copper, lumber, and automobiles, the Section 301 tariffs on Chinese goods that had originally been imposed in 2018 and 2019 during the first Trump administration, and the baseline rates that apply under the US Harmonized Tariff Schedule (HTS). That last one includes Normal Trade Relations (NTR) or Most Favoured Nation (MFN) rates, Special rates (preferential rates such as those that apply under the United States-Mexico-Canada Agreement (USMCA) and other Free Trade Agreements), and the higher rates that apply to non-NTR countries.
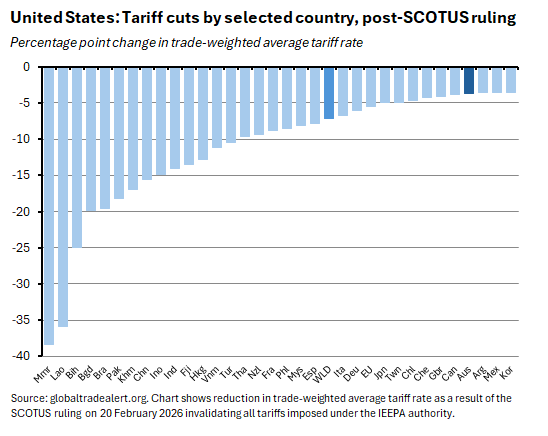
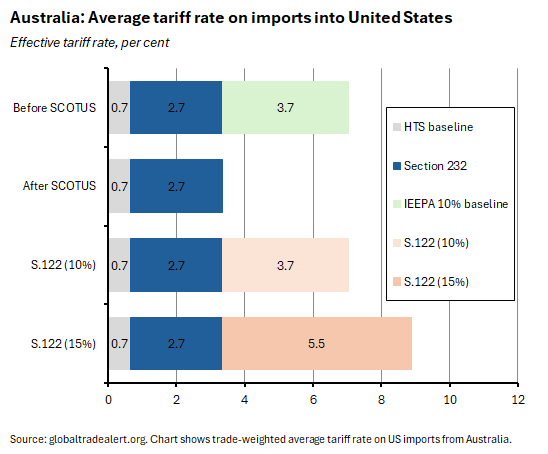
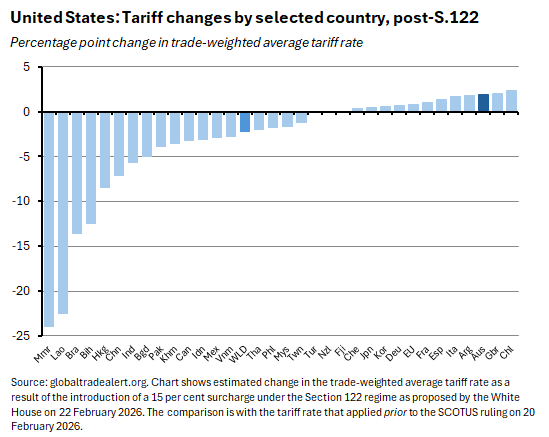
On Global Trade Alert’s numbers, some of the biggest winners from the original SCOTUS ruling are those economies that previously faced the highest IEEPA ‘top-up’ rates. Hence Myanmar (down 38.4 percentage points), Laos (down 36 percentage points) and Bosnia (down 25 percentage points) enjoyed the largest absolute declines in effective average tariffs rates. However, these economies only account for relatively small shares of existing US imports. Big winners that are also big US trading partners include Brazil (down 19.6 percentage points), China (down 15.6 percentage points), Indonesia (down 14.9 percentage points), India (down 14.1 percentage points), and Vietnam (down 11.2 percentage points). In contrast, for Australia the SCOTUS-gain was a relatively modest one, with our estimated trade-weighted average tariff rate falling from seven per cent to 3.4 per cent, an improvement of around less than four percentage points.
The rapid introduction of Section 122 tariffs quickly changed this picture, with the ultimate outcome dependent on whether the recently introduced 10 per cent rate is the new normal or if a 15 per cent rate ultimately becomes the new baseline. According to revised estimates from Global Trade Alert, the new measures increase the trade-weighted average tariff from 8.3 per cent to either 11.6 per cent (assuming a ten per cent surcharge) or 13.2 per cent (in the case of a 15 per cent rate).
Note that for Australia, under a 10 per cent Section 122 surcharge our absolute position is little changed relative to the status quo pre-SCOTUS, with exporters facing an average import tariff of around seven per cent in both cases. In effect, we have swapped out one ten per cent headline tariff rate for another one. That said, Australia’s relative position deteriorates somewhat.
Under the threatened 15 per cent surcharge, Australia’s average import tariff would rise to an estimated 8.9 per cent. That would leave Australian exporters facing an average import tariff around 1.8 percentage points higher relative to the position prior to the SCOTUS ruling.
The key point here, then, is that the new configuration of tariffs creates a new set of winners and losers. Countries like Brazil, China and India that were previously subject to large IEEPA top-up and emergency tariffs continue to gain from the SCOTUS ruling even after the Section 122 tariffs are in place, albeit to a lesser extent than before.
On the other hand, countries like Australia, Chile and the United Kingdom that had been relatively advantaged under the arrangements that applied prior to the SCOTUS ruling have now suffered a relative deterioration in their position. This would become even worse if the United States were to implement a 15 per cent global tariff. At which point this set of countries, including Australia, would see their tariff burden increase relative to the pre-SCOTUS position.
What does all this mean?
Stepping back from all the detail, what does this mean in terms of the big picture? Going all the way back to our initial assessment of the April 2025 ‘Liberation Day’ tariff shock, we have argued that the best way to think about US trade policy under the Trump administration was as a giant uncertainty shock.
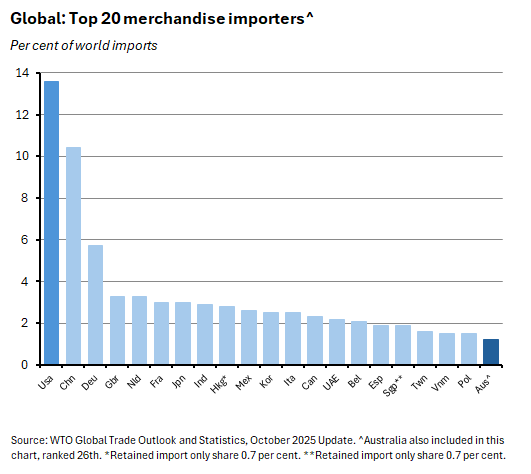
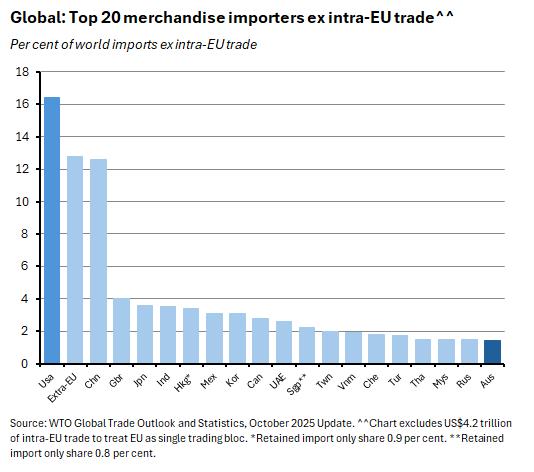
An uncertainty shock is usually assumed to have a negative impact on consumption and investment decisions, and therefore on economic activity more generally. That is because when uncertainty is high, it can make sense for economic actors to wait, postponing decisions to spend or to invest. The scale of that uncertainty shock is related to the size of the United States as a key global market for goods imports. Depending on the measure chosen, the United States accounted for between 13.6 per cent and 16.4 per cent of world merchandise imports in 2024.
Back in that 2025 assessment, we argued that the rise in policy uncertainty reflected a range of factors including the contradictory nature of the administration’s declared aims, the at times chaotic implementation of (some) US trade policies, and the credibility gap this had all created around US trade policy commitments. Recent developments have served to re-emphasise all these points.
That said, there are a couple of qualifications we should now add to that April 2025 analysis. First, back then we also flagged uncertainty around retaliation risk. To date, the actual amount of retaliation by other countries to US tariffs has mostly proved to be negligible. Only Beijing has felt able to deliver a forceful response, with its successful weaponisation of its dominance of critical minerals forcing a Washington retreat. Hence this source of uncertainty has proved relatively small. Second, in practice, global economic activity proved to be more resilient to high trade policy uncertainty (and higher US tariffs) than initially expected, as we discussed here.
Meanwhile, trade policy uncertainty looks set to remain elevated for at least five reasons.
First, the new Section 122 tariff comes with a built-in 150-day window. That gives importers a tricky choice: assume that tariffs will jump back to their pre-SCOTUS levels in 150 days, in which case it would make sense to front-load trade now (as happened in the gap between the April 2025 tariff announcements and their implementation). Or gamble that in 150 days times tariffs will return to lower levels.
Second, there is uncertainty as to whether the new Section 122 tariff will stay at ten per cent or increase to 15 per cent. Which means that the pattern of relative competitiveness across countries remains subject to change in the near term.
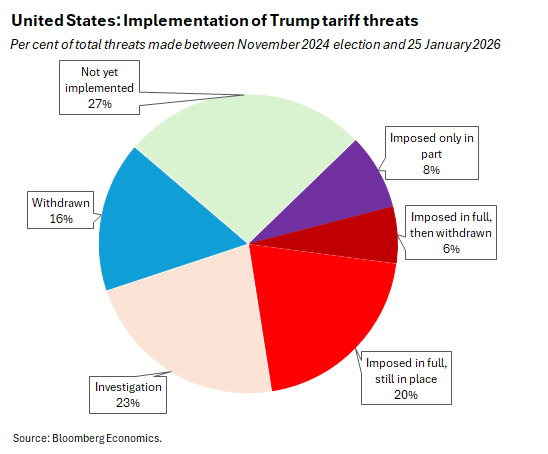
Third, the past and variable record of the administration when it comes to turning tariff threats into tariff actions (see the chart below) also adds to the difficulty in judging what comes next. Not everything Trump threatens to do gets implemented.
Fourth, if the Trump administration does seek another trade policy alternative after the 150 days (and it does seem plausible that ‘Tariff Man is gonna tariff’), there will be uncertainty over what form it might take and whether it too will be subject to legal challenge. The current bet is that the White House will turn to Section 301 which is not constrained by a tariff ceiling and which would allow the White House to leave tariffs in place for at least four years.
Finally, there is a new source of uncertainty related to the fate of the revenues generated by the IEEPA tariff regime, and the implications for the US fiscal position. There is an ongoing debate as to who ultimately paid the tariffs. But current evidence suggests the vast burden of the tariffs has fallen on US households and firms, making tariffs akin to a sales tax that applies only to imports. That sales tax has already raised substantial revenue for a US government that has repeatedly struggled to maintain fiscal discipline.
Now that revenue source has been threatened. For example, the Yale Budget Lab estimates that prior to the SCOTUS ruling, US tariffs could have brought in between US$2.3 trillion and US$2.6 trillion of revenues between 2026 and 2035. The removal of the IEEPA tariffs knocks those estimates down to a range of US$1.1 trillion to US$1.3 trillion. Add the Section 122 ten per cent tariff and assume it remains in place beyond the 150-day limit, and that figure gets adjusted up to between US$1.7 trillion and US$1.9 trillion. Better – but still a notable shortfall relative to the previous position.
Then there are the refunds to consider. According to the Wall Street Journal, for the ten months that they were in effect the IEEPA tariffs netted Washington at least US$130 billion. To date, perhaps 1,800 companies have filed lawsuits seeking refunds (most of those filed before the SCOTUS ruling). More are now likely to follow, with at least 301,000 importers (including individuals) estimated to have been subject to tariffs that have now been struck down.
And a quick reminder that, as we noted up front, there are currently other significant sources of uncertainty beyond trade policy in play.
Implications for Australian exports and exporters
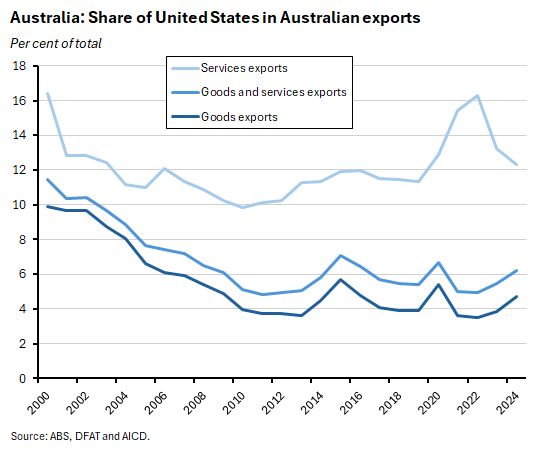
The direct implications of all this for Australian exports are limited by the size of our export trade with the United States.
As of 2024, Australia’s goods exports to the United States (which unlike services are potentially subject to tariff effects) accounted for less than five per cent of total exports, making the United States our fifth most important export market. Not insignificant, but not in the same league as China (almost 35 per cent) or Japan (14 per cent).
Moreover, when the Productivity Commission (PC) modelled the implications of the April 2025 tariffs on Australia (see Chapter One and Appendix A in the linked document for details), it found that many of the proposed US trade policy measures would likely have a small positive impact on Australian production in the long run. That was because the tariffs then levelled on Australia were lower relative to those imposed on other countries, suggesting a future reallocation in US demand in Australia’s favour. In addition, the PC modelling assumed that the tariffs would lead to an outflow of capital from the United States and high-tariffed countries to the rest of the world, including to Australia.
In this context, the slight relative shift in Australia’s tariff position due to recent changes is likely at worst to be a very modest headwind for our overall export performance.
Indeed, more important is Australia’s indirect exposure via the implications of US trade with key Australian export markets like China or Japan. For Budget 2025-26 (see Box 2.1), Treasury estimated that the indirect effect of US tariffs on Australia via their impact on China would be nearly four times as large as their direct effect on Australia, given the relative size of trade flows. And since China is a relative winner under the new tariff arrangements, at least for now, this could more than offset any direct losses.
Finally, it is worth noting that any trade impact on Australian exporters is likely to be larger than the impact on Australian exports, given the number of businesses involved. While we don’t have current data on this, according to the latest (2022) edition of the Characteristics of Australian exporters, there were some 12,463 Australian exporters to the United States in 2019-20, comprising about 22 per cent of all exporters. That compares to 8,374 exporters (a bit less than 15 per cent of the total) who sold to China in the same year.
Australian inflation surprises to the upside in January 2026
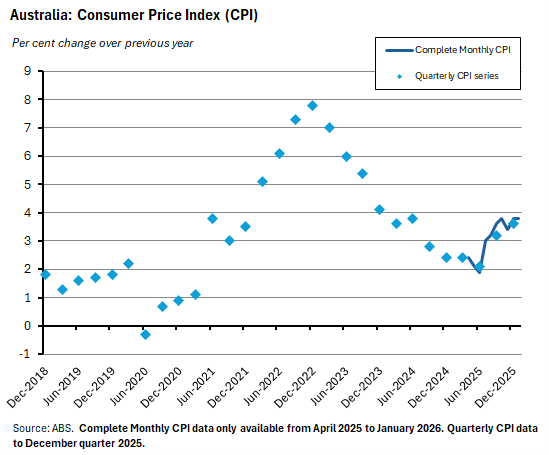
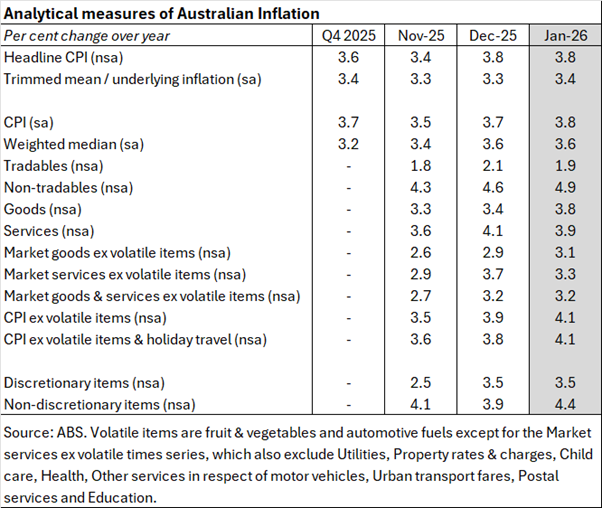
Turning back to the domestic economy, the ABS said this week that Australia’s Consumer Price Index (CPI) rose 0.4 per cent over the month (original terms) or by 0.5 per cent on a seasonally adjusted basis in January 2026. The annual rate of headline inflation was 3.8 per cent, unchanged from the previous month’s result but slightly stronger than the consensus forecast, which had anticipated a 3.7 per cent print.
The Bureau said the largest contributors to annual inflation last month by Group were Housing (up 6.8 per cent over the year and contributing 1.4 percentage points to that 3.8 per cent annual increase), Food and non-alcoholic beverages (up 3.1 per cent and making a more than a half percentage point contribution) and Recreation and culture (up 3.7 per cent and almost another half percentage point contribution). Within the Housing group, the main drivers were Electricity (where costs rose 18.5 per cent over the month to deliver a 32.2 per cent annual jump as Commonwealth and State Government electricity rebates were exhausted by households) along with New dwellings (up 3.5 per cent) and Rents (up 3.9 per cent). That increase in electricity costs also drove the pickup in goods inflation noted below.
Underlying inflation, as measured by the trimmed mean, rose 0.3 per cent over the month to be up 3.4 per cent over the year. That was slightly stronger than December 2025’s 3.3 per cent reading. It also exceeded the consensus forecast, which had expected underlying inflation to be unchanged at 3.3 per cent.
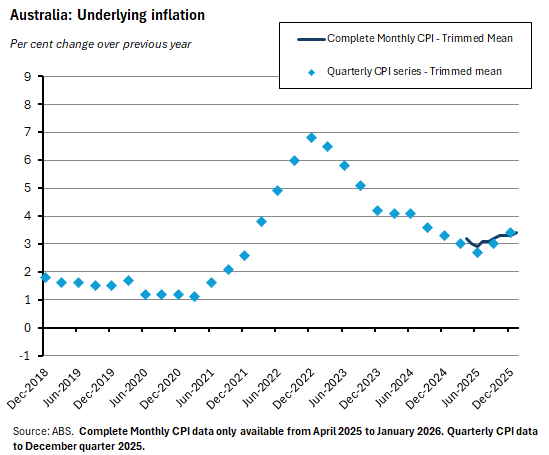
In the case of other ABS analytical measures of inflation, there were increases in the annual rate of the CPI ex volatile items, and in the CPI ex volatile items and holiday travel measures, along with rises in the annual rate of non-tradables inflation, goods inflation, and market goods ex volatile items inflation.
The weighted median measure of underlying inflation was unchanged from the December reading at 3.6 per cent. And there were declines in the annual rate of increase for tradables, services, and market services ex volatile items.
The inflation reading keeps the pressure on for an RBA rate hike
Following last week’s jobs and wages numbers, we wrote there was nothing in the labour market results likely to change the RBA’s view that inflation risks were currently tilted to the upside, and that it was therefore difficult to rule out the likelihood of a further tightening in monetary policy.
Recall that in the RBA’s view, the overshoot in inflation that began in the second half of last year was driven by a combination of temporary and sector-specific pressures (think the housing market, for example, as well as travel and fuel prices through late last year) together with more general capacity pressures across the labour market and the broader economy. Martin Place also thinks that the former driver is the relatively more important one.
This week’s January inflation numbers are consistent with that take. Headline inflation remained an uncomfortable distance above the top of the inflation target band while underlying inflation edged further away from target. Other analytical measures of inflation painted a mixed picture but overall offered little sign of a return to disinflation.
At this point, we should also inject our regular cautionary note that the RBA has told us repeatedly and recently that it will be careful in interpreting the new monthly CPI series and will continue to focus on the quarterly data until it gets more comfortable with the properties of the monthly numbers.
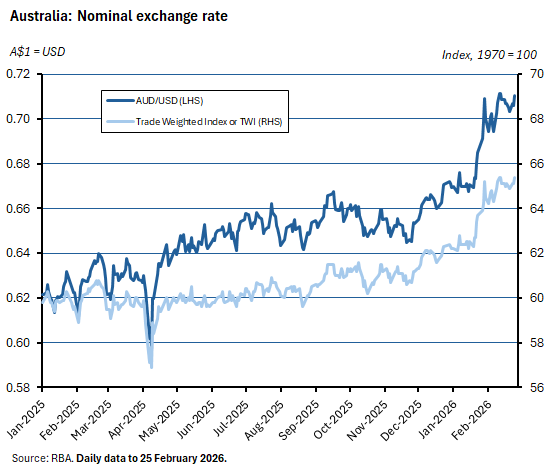
Market expectations for a rate increase following the upcoming 16-17 March Monetary Policy Board meeting nudged higher after the inflation data were released. Even so, at the time of writing market pricing continued to suggest policy tightening next month remains unlikely. Instead, markets are looking to May for the next rise in the cash rate target. Meanwhile, expectations of higher rates are contributing to the ongoing strength in the Australian dollar. As we have noted before, all else equal, AUD appreciation should do some of Martin Place’s work for it by tightening financial conditions.
Other Australian data points to note
The ABS reported that total construction work done fell 0.1 per cent over the December quarter 2025 (volumes, seasonally adjusted) but was still three per cent higher than in the corresponding quarter in 2024. The decline reflected 1.3 per cent quarter-on-quarter and 2.7 per cent year-on-year falls in engineering work done. In contrast, building work done rose over the quarter (up 0.9 per cent) and over the year (up 8.1 per cent).
Private new capital expenditure rose 0.4 per cent over the December quarter 2025 to be up 7.8 per cent over the year. The ABS said that capex on buildings and structures was up 2.3 per cent quarter-on-quarter and 6.5 per cent year-on-year. Capex on equipment, plant and machinery fell 1.7 per cent over the quarter but was still 9.4 per cent stronger in annual terms. The Bureau also reported that the lift in building investment was driven in part by renewable energy projects (battery energy storage systems, along with wind and solar developments) while the offsetting fall in equipment and machinery investment followed record high data centre-related spending in the previous quarter. Still, even after a 30 per cent drop over the quarter, equipment investment in the Information, Media and Telecommunications sector remains nearly 50 per cent higher than a year before. The ABS also released new estimates for planned capex in 2025-26, which were revised up by 4.3 per cent from the previous estimate. The first estimate for spending in 2026-27 was 7.3 per cent higher than the first estimate for 2025-26.
According to the ABS Monthly Employee Earnings Indicator, total wages and salaries paid in December 2025 came to $107.4 billion, for 15.3 million employee jobs. Payments were down 0.5 per cent from November 2025 (original, calendar adjusted basis) but 5.7 per cent higher compared with December 2024.
Sticking with wages and salaries, the ABS said that average weekly ordinary time earnings for full-time adults rose 3.8 per cent over the year to $2,051.10 in November 2025 (seasonally adjusted basis). The annual rate of growth has slowed from 4.5 per cent in May last year and 4.6 per cent in November 2024. Full-time average weekly total earnings rose four per cent to $2,125.80 while all employees average weekly total earnings rose 3.4 per cent to $1,562.40.
Further reading and listening
- The Productivity Commission’s Annual productivity bulletin 2026.
- Andrew Charlton speech on the macroeconomics of AI.
- A note from the ABS on Data Centres in Economic Statistics.
- Michael Plumb, Head of the RBA’s Economic Analysis Department, on recent developments in inflation and the economic outlook. Plumb’s speech includes reference to the new monthly CPI data, and he reminds his audience that ‘it will take us some time to understand the properties and seasonal patterns of the data.’ He also explains that the RBA has ‘been analysing underlying inflation measures constructed using the monthly data…eventually we aim to assess which underlying inflation measures from the monthly data will be preferred in a post-quarterly CPI world. During this transition period, we will be looking to understand the properties of monthly underlying measures, including any signs of bias, differences in seasonal patterns, responsiveness to changes in economic conditions, and effectiveness as a leading indicator for headline inflation. This will be some way off, but our intention is to engage widely and communicate our thinking ahead of any decisions.’
- Related, the transcript of an interview with RBA Deputy Governor Andrew Hauser.
- From the AFR, Bill Kelty says Australia has a cruel tax system for the young.
- According to the ABS, last year Australia recorded the highest number of deaths from influenza this century (1,701 deaths).
- Rising tail risk for the US economy.
- The WSJ on negative net US migration.
- Introducing the OECD.AI Index.
- That Citrini Research post on the 2008 Global Intelligence Crisis.
- A BIS Bulletin on global giants in the AI supply chain.
- The Economist magazine says that the AI productivity boom is not here (yet).
- An FT Big Read on the US-China trade truce.
- Some evidence on the WFH wage premium. French data suggest that workers who are more productive or have better negotiation skills seem to be able to secure both higher hourly wages and the right to work from home more often.
- Technological change and the war in Ukraine.
- Noema’s top 10 reads of 2025.
- The Ezra Klein show in conversation with Jack Clark, a co-founder of Anthropic.
- The FT’s Economics Show podcast explains why Trump’s tariffs are not dead yet.
- The Odd Lots podcast discusses the intellectual roots of Zohranomics.
- The Gray Area podcast talks to C. Thi Nguyen about the problem with gamifying life.
Latest news
Already a member?
Login to view this content