
It has been another dramatic week for the world economy, which has just undergone an extreme episode of geopolitical whiplash.
In the space of a few days we’ve swung from warnings about the potential collapse of the security underpinnings of the Western Alliance and speculation that Europe could weaponise its holdings of US Treasuries to the return of the TACO trade.
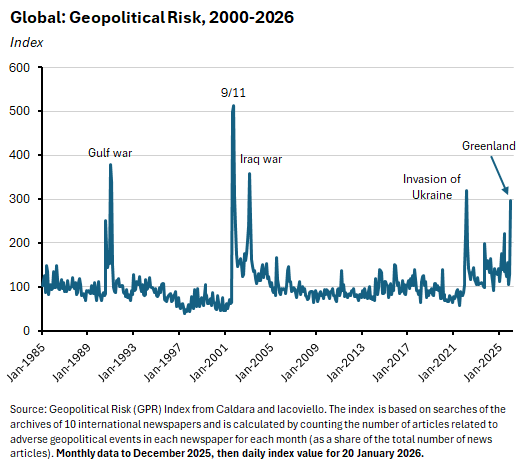
To recap: First, US President Trump reasserted the United States’ intention to acquire Greenland. The White House even indicated that ‘using the US military’ was a possible option. Next, the administration threatened eight European countries (France, Germany, the UK, the Netherlands, Denmark, Norway, Sweden, and Finland) with punitive tariffs that would start at ten per cent from next month and rise to 25 per cent in June unless those countries agreed to support a US takeover. Then, Trump backtracked and ruled out the use of force. And shortly after that, he dropped the tariff threat while claiming ‘the framework of a futuredeal’ had been agreed.
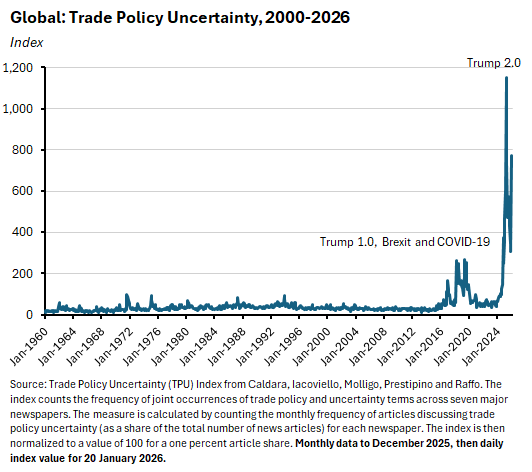
As the possibility of a trans-Atlantic trade war and the disintegration of NATO loomed, measures of geopolitical risk and trade policy uncertainty both spiked. In response, US stock markets, bonds, and the US dollar all slumped on Tuesday while gold soared. US equities then rebounded on Wednesday as news of the possible ‘framework for a future deal’ emerged. The TACO trade appearedto have paid off once again.
How to interpret all this? It’s possible that the sharp, negative market reaction to the Greenland fracas – in contrast to the more sanguine response to other developments we noted last week – may indeed have rejuvenated the TACO trade and prompted a rethink in Washington. But at this point it is still too soon to be sure. Either way, however, it seems reasonable to assume that the old NATO-led Western defence order has now been significantly degraded, with profound implications for the global security outlook. That in turn should influence Australia’s own thinking about security, which will ultimately involve significant budgetary implications.
Meanwhile, and with this rollercoaster ride as a backdrop, the IMF and World Bank have both released their latest forecasts for the world economic outlook. Both institutions expect global growth this year to be little changed from 2025, in effect assuming that last year’s demonstration of global resilience in the face of trade policy turmoil and geopolitical disruption will be repeated in 2026. We consider the case for that continued resilience in more detail below.
More prosaically, here at home the ongoing flow of Australian data continues to build a picture of economic conditions ahead of the 2-3 February meeting of the RBA’s Monetary Policy Board (MPB). We received another update on the labour market this week. The ABS released the December 2025 labour force numbers which showed the Australian job market ending the year on a strong note as the number of employed people jumped by more than 65,000 while the unemployment rate fell to 4.1 per cent. That provided more ammunition for those central bank watchers speculating that the MPB will be inclined to vote for a rate increase next month, with market pricing indicating a 50 per cent chance of a hike at the time of writing. For our part, we are still waiting for those December quarter inflation numbers (out 28 January) before we review our expectation that the MPB will be inclined to stick with the status quo.
More detail on the labour market numbers and their monetary policy implications below, along with a brief roundup of other Australian data from this week plus a selection of further reading and listening.
On 2026 forecasts and 2025 forecasting lessons
As noted above, the January 2026 edition of the IMF’s World Economic Outlook (WEO) Update and the World Bank’s latest Global Economic Prospects (GEP) have both been released, providing Fund and Bank economists with the opportunity to update their forecasts for the year ahead.
The WEO is the higher profile of the two and is probably the closest we get to an ‘official’ global economic forecast. Relative to the numbers presented in the October 2025 WEO, the Fund now reckons that world real GDP growth likely ran at 3.3 per cent last year, up slightly from its previous estimate of 3.2 per cent. For this year, the IMF again expects growth of 3.3 per cent, an upgrade of 0.2 percentage points from its October projections.
For its part, the World Bank’s GEP estimates world real GDP growth last year at 2.7 per cent (a 0.4 percentage point upgrade from the June 2025 GEP) and expects growth this year to run just slightly slower at 2.6 per cent (a 0.2 percentage point upgrade to June’s number).*
Both the Fund and the Bank cite similar reasons for this relatively benign outcome, assuming that once again the world economy will be able to absorb geoeconomic and geopolitical dislocation without taking a big hit to growth. Four factors support that optimism, including accommodative global financial conditions in a context of further monetary policy easing, primarily by the US Federal Reserve; continued fiscal support across key advanced economies including in the United States from the One Big Beautiful Bill Act, and ongoing momentum from the technology sector.
This all seems reasonable. But is a growth outcome for 2026 that is the same as last year a sensible base case, given the scale of the geopolitical turmoil that has already marked the start of this year?
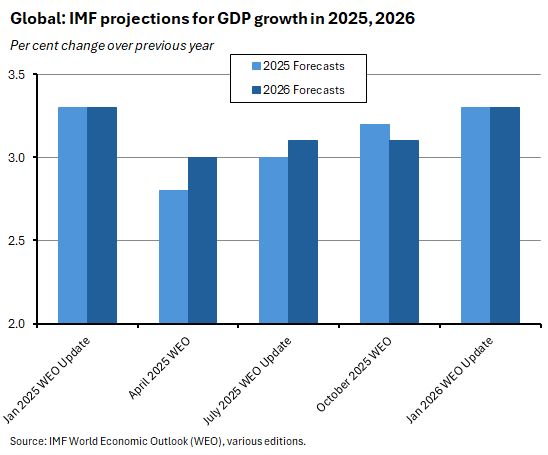
The Fund’s forecasts over the past twelve months tell an interesting story in this context. In the corresponding January WEO update at the start of last year, the IMF had projected global growth for 2025 of 3.3 per cent. Then, in the aftermath of the turmoil generated by President Trump’s ‘Liberation Day’ tariffs, the April 2025 WEO slashed that growth projection by half a percentage point, cutting forecast growth to 2.8 per cent. But over the course of the rest of the year, subsequent revisions delivered a series of growth upgrades, with estimated growth for last year finally returning to where the IMF had started, at 3.3 per cent.
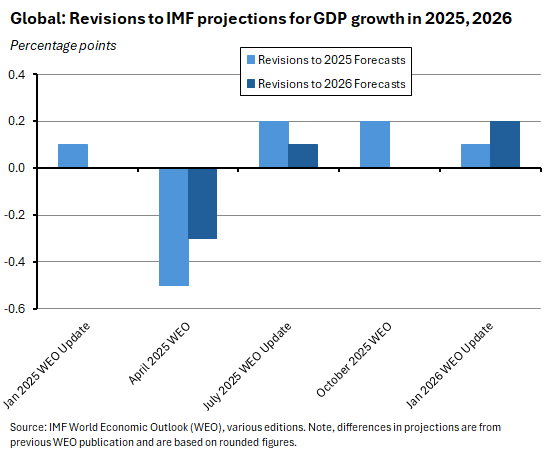
To date, revisions for 2026 have followed a similar path: an initial downgrade followed by a sequence of upward revisions.
*Note that some of the difference in the Fund and Bank growth rates reflects differences in methodology. For example, the WEO’s headline global growth numbers are calculated using country growth rates weighted by national GDP valued at purchasing power parities as a share of the world total (although the Fund also publishes an estimate of world GDP growth at market exchange rates, where weights are calculated as the three-year trailing average of nominal GDP in US dollars. For 2026, this alternative estimate puts forecast growth lower at 2.8 per cent, reflecting relatively smaller weights for faster-growing emerging economies). The GEP approach calculates world GDP growth by using weights based on average 2010-19 prices and market exchange rates.
Gauging global economic resilience
As we discussed back in October 2024, one standout feature of the post-pandemic global economy hasbeen its resilience amid risks.
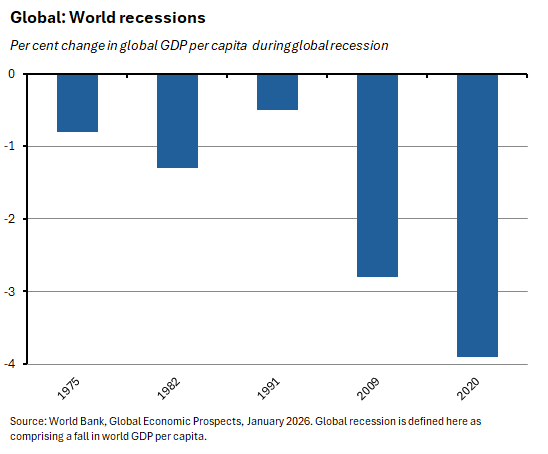
According to the World Bank’s analysis in the latest GEP, the world economy has suffered five global recessions (defined as a fall in GDP per capita) since 1960: in 1975, 1982, 1991, 2009, and 2020. The 2020 COVID-led recession was the deepest of them, with global GDP per capita falling by almost four per cent. The GFC recession in 2009 was the second deepest, with a fall of nearly three per cent.
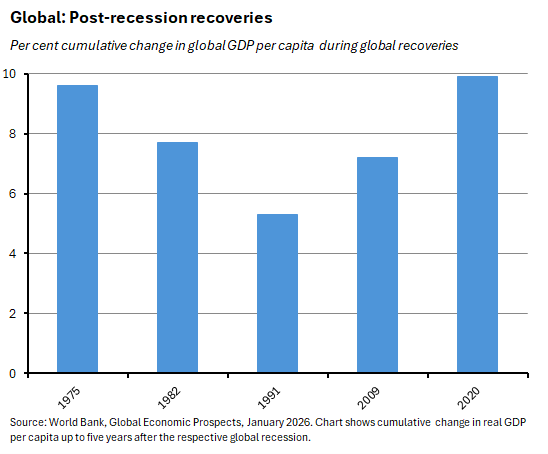
At the same time, the post-COVID recovery (measured across the first five years after the trough of each recession) has been the strongest, with global GDP per capita exceeding its 2019 level by ten per cent. That comfortably surpasses the recovery from the 2009 recession (7.2 per cent) and edges out the rebound that followed the 1975 downturn(9.6 per cent).
This robust performance came despite a series of adverse shocks. Those included: severe supply chain disruptions, the energy price jump triggered by Russia’s invasion of Ukraine, a worldwide surge in inflation, and the synchronised tightening of global monetary policy that followed. The global economy also navigated increased geopolitical and geoeconomic tensions and extremely elevated levels of trade policy uncertainty.
In part, this recovery story likely reflects the stylised fact that deeper downturns tend to be followed by stronger upturns. But the Bank also points to the large and sustained fiscal policy response pursued by advanced economies (in contrast to the case of poorer economies, which had less fiscal space to play with, and hence did less well relative to their post-GFC experience).
This resilience continued through last year, and both the IMF and the World Bank spend time in their latest reports explaining why 2025’s tariff turmoil and policy uncertainty failed to make a significant dent in global activity, contrary to initial expectations.
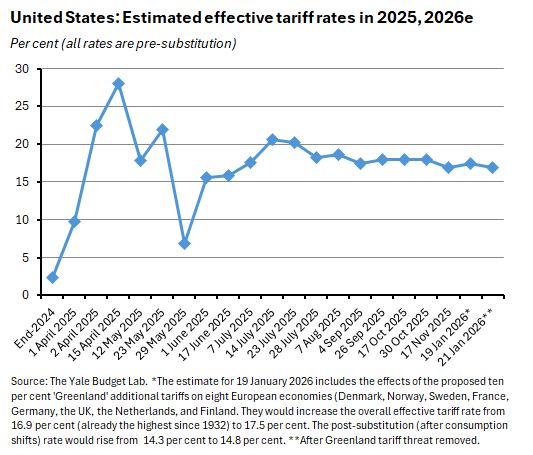
- The US effective tariff rate fell from its post-Liberation Day peak and while it remained high relative to recent history (estimates from the Yale Budget Lab put it at levels last seen in the 1930s), there was a degree of relative stability through the second half of last year. Even the recently mooted and now discarded ‘Greenland’ tariffs would have had a relatively minor impact on the estimated effective rate, assuming they did not kick start a retaliatory wave. Note also that a key unknown here is the upcoming decision from the US Supreme Court on thelegality of the administration’s use of the International Emergency Economic Powers Act (IEEPA). The Yale Budget Lab has previously estimated that invalidating the IEEPA tariffs would take the effective tariff rate down to around nine per cent (or eight per cent, post-substitution).
- Firm behaviour was also important. The gap between tariff announcements and implementation allowed businesses to frontload imports and accumulate inventories ahead of rate increases; by virtue of beginning with healthy profit margins, US firms were able to absorb much of the cost involved by accepting lower profit margins; and they were also able to redirect supply chains towards countries where the United States had negotiated preferential trade deals.
- In addition, with the notable exception of Beijing, the rest of the world largely refrained from retaliating with protectionist measures of their own. That left the effective tariff rate for the rest of the world at a modest 3.5 per cent, limiting the overall damage from protectionism to international trade flows. The prospect of a Greenland-inspired trans-Atlantic trade conflict briefly threatened to change this picture, but at the time of writing that threat appears to have been averted.
- Despite occasional bouts of market volatility, global financial conditions remained accommodative over the course of last year. Slowing inflation allowed for a gradual easing of monetary policy, while stock market exuberance, powered by optimism regarding the transformative possibilities of AI, boosted asset valuations. Strong risk appetite on the part of investors also manifested in relatively tight credit spreads. The main exception to this largely benign story was a steepening in sovereign bond yield curves in some advanced economies, as higher debt burdens pushed up term premia.
- Economic growth in the United States also benefited from strong increases in investment spending related to the AI boom. That in turn contributed to booming technology exports for a range of Asian economies. Growth in China was supported both by robust exports and by Beijing’s stimulus measures.
The central forecast scenarios assume that many of these effects will persist into this year: more US monetary policy easing, further fiscal support, and an ongoing AI boom. We may even see some AI-related productivity payoffs adding to the direct growth effects of the surge in capex. Hence, a baseline of ‘more of the same’ does notlook unreasonable.
At this point, however, we need to inject a note of caution. Both the IMF and the World Bank warn that risks to the outlook remain tilted to the downside, and the previous list also suggests at least two major points of tension.
First, as temporary buffers to tariffs fade and as distortionary effects accumulate, it is possible that the economic costs of last year’s policies will start to mount. Moreover, pending that US Supreme Court ruling, the world may not be safe from further trade policy disruption through 2026. Some of that risk reflects the predilections of the current White House. But another driver could be the adjustment strains triggered by the first post-tariff round of trade diversion, which could yet spark additional protectionist responses in third markets.
Second, the persistence of supportive financial conditions is dependent on ongoing progress with disinflation and on continued market exuberance in the face of concerns about an AI bubble and stretched valuations more generally. Should inflation prove stubborn, the AI bubble deflate, fiscal sustainability concerns mount, and/or confidence be hit by another shock – with this week demonstrating that geopolitical shocks do have the ability to move markets after all – then conditions could quickly become much less supportive.
Put slightly differently, there is no reason to believe the roller-coaster ride is over.
Australia’s labour market tightened in December last year
The ABS said that Australian employment rose by a seasonally adjusted 65,200 last month, with full-time employment rising by 54,800 and part-time employment rising by 10,400. That was a much stronger result than markets had anticipated, with the consensus forecast calling for a more modest 27,000 gain. Although do note that December’s monthly increase followed a (downwardly revised) employment drop of 27,000 in November 2025, consistent with the volatility of the monthly numbers.
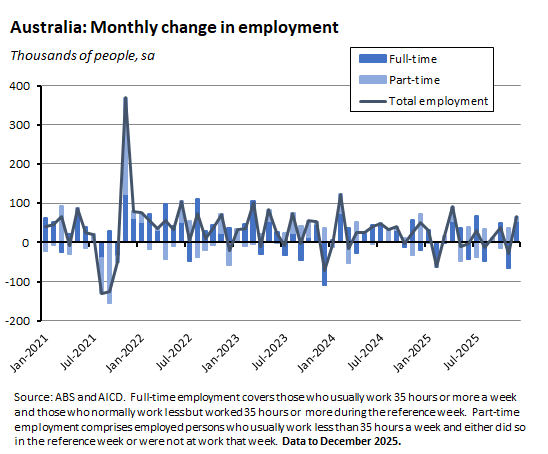
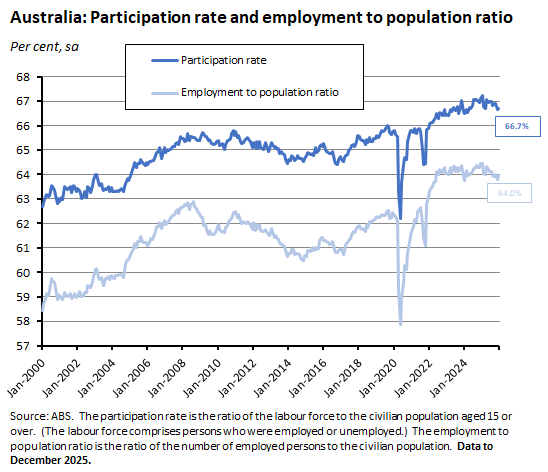
There were other signs of labour market strength. Monthly hours worked reached a record high of over two billion hours last month, the participation rate edged back up by 0.1 percentage point to 66.7 per cent, and the employment to population ratio increased from 63.8 per cent to 64 per cent.
At the same time, Australia’s unemployment rate dropped back to 4.1 per cent from 4.3 per cent in November 2025, reaching a low last seen in May 2025. Here too, the result comfortably exceeded market expectations, with the median forecast anticipating no change last month. The trend unemployment rate was also down, falling from 4.3 per cent to 4.2 per cent.
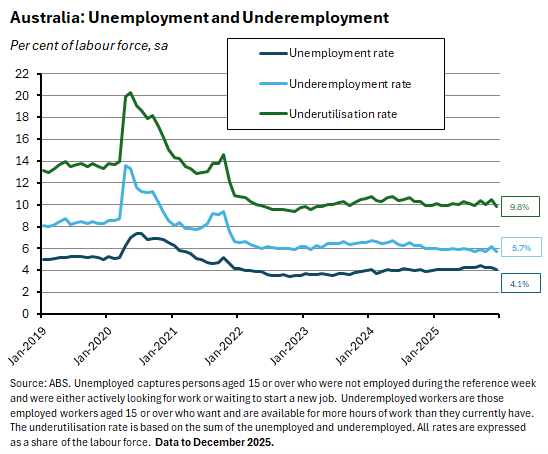
Consistent with a tighter labour market, the underemployment rate fell by half a percentage point in December, dropping from 6.2 per cent to 5.7 per cent. That took the overall underutilisation rate down from 10.5 per cent to 9.8 per cent, marking the firstsub-ten-per-cent rate since March last year.
As an aside, Australia has been remarkably successful in delivering high employment and a high participation rate in the aftermath of the pandemic. This is the other side of our disappointing productivity performance. Investment rates have been unable to keep pace with rapid employment growth, contributing to declining capital-labour ratios and hence to weaker productivity outcomes, even as employment outcomes have been strong.
Turning to the implications for monetary policy, this week’s labour market numbers strengthen the case for pre-emptive tightening, explaining why markets now think the chance of a rate increase next month has risen from 1-in-3 to 1-in-2. We are waiting for the December quarter’s inflation numbers before reviewing our expectation that the MPB will leave the cash rate target unchanged.
One last point. Global monetary policy is now starting to diverge as some countries (the WEO lists Norway along with Australia) are projected to see ‘some drawn-out persistence in above-target inflation’ even as others continue to ease in response to inflation returning to target. That in turn will have implications for exchange rates, which will in turn enter the calculations of central banks.
Other Australian data points to note
The ANZ-Roy Morgan Consumer Confidence Index fell 5.2 points to an index reading of 79.3 for the week ending 18 January 2025. That marked the sharpest drop in weekly confidence since February 2023 (when the RBA increased the cash rate target to 3.35 per cent) and took the index down to its lowest level in eighteen months. All five subindices fell over the week, with the biggest drop in the ‘time to buy a major item’ measure, which slumped by more than 12 points. There were also marked declines in reported confidence in economic conditions, suggesting that growing fears of a possible rate hike are souring sentiment.
The ABS said that the total number of dwelling units commenced in the September quarter 2025 rose 6.6 per cent over the quarter (seasonally adjusted) and grew 11.6 per cent over the year to reach 48,778 dwellings. (A regular reminder: the government’s target is to build 1.2 million new homes in the five years to July 2029, which implies an average of 60,000 dwellings per quarter.)
In the September quarter of last year, engineering construction work done was down 6.6 per cent over the quarter (seasonally adjusted) to be 1.8 per cent lower over the year. The ABS said that private sector work done slumped 14.2 per cent over the quarter while work for the public sectors rose by 3.8 per cent.
Further reading and listening
- The OECD has published its latest economic survey of Australia which includes a special feature on revitalising competition in the Australian economy, where it thinks that competition has waned over the past two decades. OECD economists judge that the Australian ‘economy is normalising, but long-standing challenges of slow productivity growth, strained housing affordability and high carbon emissions should be addressed.’ The Survey advocates more government action to lift competition, to reduce the fiscal deficit, ease land-use restrictions, and progress onemissions reductions.
- The Productivity Commission’s report on Opportunities in the Circular Economy reckons that despite some uptake in Australia, overall progress has been slow due in part to a mix of high costs, poor regulatory settings, coordination challenges, difficulties in diffusing innovations, and limited practical information.
- From the AFR, what would Adam Smith make of Australia?
- The e61 Institute’s submission to the Senate Select Committee on the operation of Australia’s capital gains tax discount.
- An ABS explainer on how it will continue to publish estimates of the quarterly trimmed mean through until at least the June quarter 2027, to provide an ongoing and consistent measure of underlying inflation as the new monthly CPI series beds in.
- Canadian Prime Minister Mark Carney’s powerful speech to the World Economic Forum declaring ‘a rupture in the world order, the end of a nice story, and the beginning of a brutal reality where geopolitics among the great powers is not subject to any constraints.’
- This paper on Neo-Royalism, the Trump Administration and the Emerging International System enjoyed a fair amount of linkage over the past couple of weeks. So, are we back in a Sixteenth Century-style world centred on ‘ruling cliques, networks of political, capital, and military elites devoted to individual sovereigns, seeking to generate durable material and status hierarchies based on the extraction of financial and cultural tributes’?
- Tacking AI’s contribution to US GDP growth. Recent investments in AI-related categories are now larger than the contribution of IT components to real GDP growth during the dot-com boom.
- Dan Wang’s 2025 letter. Long but worth it, even if you only read the opening two paras.
- How the ‘great reallocation’ is changing US supply chain trade.
- Related, a new report from the Kiel Institute estimates that domestic importers and consumers bear 96 per cent of the US tariff burden. Foreign exporters absorbed a mere four per cent.
- The FT on China’s two-speed economy and the news that last year China registered its lowest number of births since records began, marking a fourth consecutive year of population decline.
- Picturing China’s wind and solar buildout.
- The Economist magazine examines how geopolitics is reshaping multinationals.
- The ChinaTalk podcast talks to Dan Kim and Chris Miller about the future of economic security.
- The Bloomberg Australia podcast asks, how will global chaos reshape Australian politics in 2026?
- The final two episodes (for now) of the Past Present Future’s series on politics on trial look at the trials of OJ Simpson and Saddam Hussein.
Latest news
Already a member?
Login to view this content