

 This product has already been purchased.


Overview
- Cotality’s National Home Value Index recorded its largest monthly drop in July this year (down 0.7%) since December 2022 as the set of capital cities experiencing falling house prices expanded.
- Australia’s job mobility rate has fallen to a new low of 7.2%. That could signal a further decline in our economic dynamism. But there are other factors at work, too.
- According to the ABS June quarter 2026 Living Cost Indexes, Australian households saw their cost of living rise at an annual rate of between 3.7% and 4.7%. The rate of increase for employee households was the highest since the December quarter 2024.
In a mostly quiet week for Australian data, economy-watchers have continued to keep a close eye on global developments. Many of the themes remain familiar. There is the on again, off again conflict in the Middle East and the accompanying oscillations in oil prices. And there are the continued fluctuations in sentiment towards AI as investors switch between fear and greed. More recent stories have revolved around markets getting to know new Fed Chair Kevin Warsh and the implications of Washington’s decision last Friday to join Tokyo in propping up the Japanese yen in the first such operation in nearly 30 years. Meanwhile, the domestic focus remains on next week’s meeting of the RBA’s Monetary Policy Board (MPB), where the strong consensus is for the MPB to vote for no change to the cash rate target.
Even so, it’s still worth paying attention to three of the most recent domestic data releases, given that each of them touches on an important economic issue.
- This week’s housing market numbers not only told us that the current downturn is expanding but also prompted us to recall the important role the sector has played in Australia’s economic story in recent years, along with the challenges involved in trying to change this model.
- Last Friday’s update on Job Mobility reported that the mobility rate has fallen to 7.2%. Since the long-run decline in Australia’s job mobility rate is frequently seen as evidence of the economy’s loss of dynamism, a new record low looks like bad news. But the story is a bit more complicated than that.
- And finally, the latest ABS Living Cost Indexes (LCIs) showed the annual rate of increase for employee households rising at its fastest rate since the December quarter 2024, while also serving as a reminder of the ongoing importance of the cost-of-living story to Australian political as well as economic outcomes, as previously discussed here.
More on all three stories below, plus the usual roundup of other Australian releases along with the regular suggestions for further reading and listening.
Finally, I recently made a guest appearance on the AICD’s Director Download podcast. From the Reserve Bank's next interest rate decision to AI's economic impact and Australia's productivity challenge, we explored the major structural forces driving today's economy and what they mean for board decisions on risk, resilience and long-term growth. You can listen below or wherever you get your podcasts.
Australia’s housing market downturn widened last month
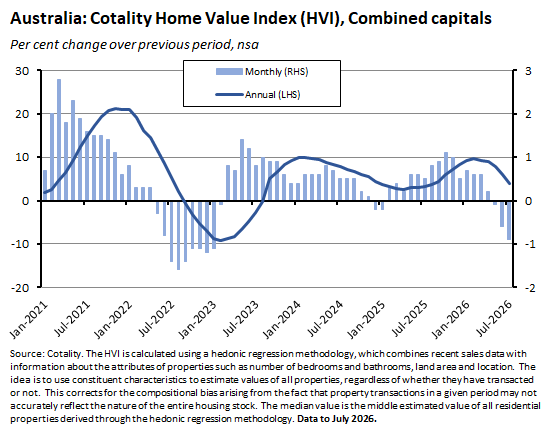
Cotality reported that its National Home Value Index fell 0.7% over the month in July this year in what was the largest single-month decline since December 2022, leaving the index up 5.3% over the year. The monthly drop in the Combined capitals Index was even steeper, at 0.9%, as annual growth slowed to 3.9%. Following the pattern of recent months, Sydney (down 1.4% over the month) and Melbourne (down 1.2%) led last month’s decline. But the downturn in the market has now broadened, with falls in Brisbane (down 0.6%) and Adelaide (down 0.2%), while growth in Perth and Hobart (both up 0.1%) slowed to a crawl. In its latest update, Cotality also highlighted that there had been large downward revisions to its previous May and June 2026 results.
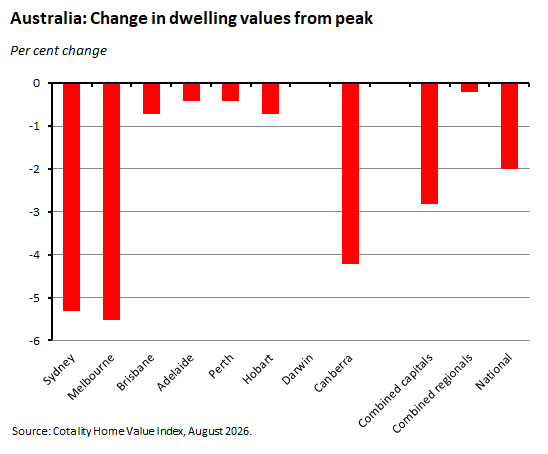
National home values are now down 2% from their recent peak (in March this year) while the Combined capitals index has fallen 2.8% from its peak. Melbourne prices are 5.5% below their March 2022 peak and Sydney prices are down 5.3% from that city’s January 2026 peak.
The current downturn is the product of several compounding factors: there is the ongoing impact of the three rate hikes delivered by the RBA earlier this year; stretched affordability measures; elevated cost-of-living pressures more broadly; low levels of consumer confidence; and the decline in purchaser sentiment triggered by policy changes announced in Budget 2026. Calls for lower rates of net migration – which would imply much lower rates of population growth and hence softer housing demand – may also have adversely influenced buyer sentiment. All of which suggests scope for further price declines.
From a macro perspective, falling house prices imply two near-term risks.
First, lower prices mean lower household wealth. All else equal, this negative wealth effect is likely to imply weaker household consumption and hence slower growth. Back in 2019, economists at the RBA estimated that a 1% change in the value of housing wealth would lead to a 0.16% change in the long-run level of consumption. They also found that consumption responded quite quickly to changes in housing wealth: a 1% change in housing wealth produced a 0.08% change in consumption over two quarters, so about half of the total long-term response. The same work finds that the kinds of consumption that respond most to changes in wealth are durable goods, such as household furnishings and motor vehicles, with the latter particularly sensitive. Discretionary spending (for example on recreation) also appears to be sensitive to wealth effects. Right now, of course, lower growth (and higher unemployment) is what the RBA is looking for, as it seeks to bring economic activity back into line with what it thinks is the economy’s lower speed limit. But it also doesn’t want to overdo things.
Second, lower housing values can raise issues around financial stability. Here, the RBA has been sounding relaxed. To date, only a small number of households are thought to have fallen into negative equity, for example. According to RBA Governor Bullock, less than 1% of borrowers faced that problem as of May this year. And within that already small group, the RBA’s estimates suggest that only a small share of borrowers were facing ‘severe difficulty’ (that is, were subject to an estimated cash flow shortfall where household incomes were insufficient to cover both minimum loan repayments plus other essential living expenses).
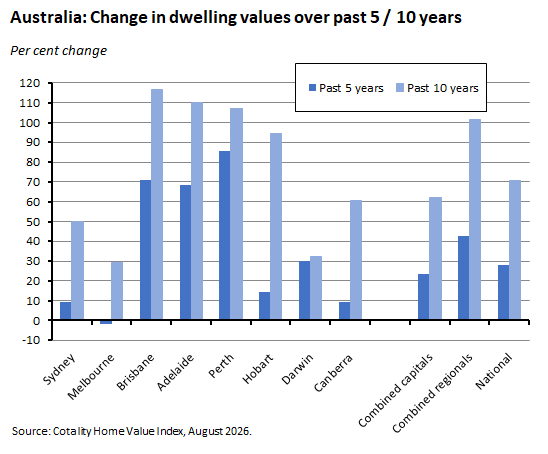
That degree of comfort on financial risk in part reflects the fact that the size of the current decline in dwelling values should not be overdone. Step back a little, and with the notable exception of Melbourne, Australian housing markets are still up over the past five years: national values are still around 28% higher, for example, while the combined capitals index is up nearly 24%. Wind the clock back even further, and the size of recent falls looks considerably more modest. National home values are still up more than 70% over the decade, for example, while combined capitals values remain more than 62% higher.
An interesting longer-term question to pose here is, does the current adjustment in prices reflect the normal cyclical swings of the housing market, or is something more fundamental at work?
Over the current century, the housing market has sat at the centre of the Australian economic model, with rising home values playing a key role in driving household wealth, underpinning consumption and supporting growth.
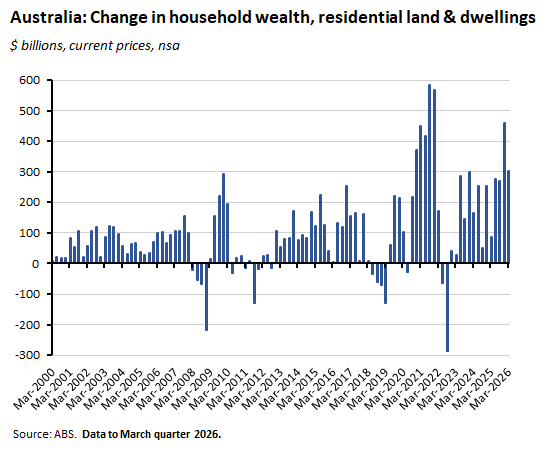
While commodity prices and the resource boom were the key forces propelling Australian growth during the 2000s, the housing market was increasingly central to our growth model during the 2010s. And until recently, government policy in one way or another has worked hard to keep that model going, through a mix of favourable tax treatment, local planning and development restrictions, and repeated fiscal pump-priming (often through schemes notionally designed to improve home ownership but which in a context of constrained supply in practice operated mainly to drive up prices).
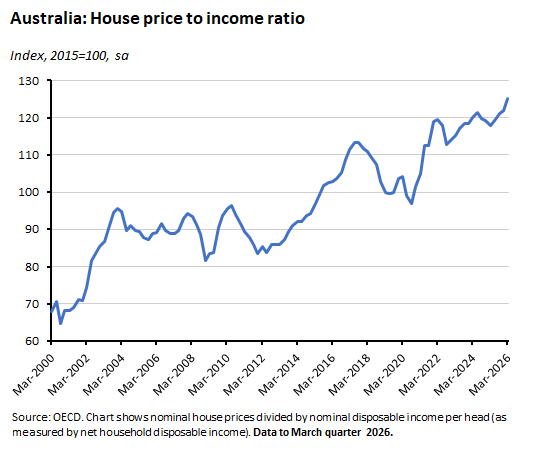
That model also came with a range of unfortunate side effects attached, most obviously declining housing affordability and as a consequence falling home ownership rates. It seems likely that it also had adverse implications for growth and productivity over the medium term, for example by limiting labour mobility and by diverting investible resources away from other uses into driving up the price of existing homes.
In that context, the changes around negative gearing and capital gains announced in Budget 2026 were significant to the extent that they signalled an attempted policy shift away from Australia’s traditional housing model (as opposed to just securing another source of tax revenue). And as already noted, given that rising political pressures calling for a rethink on Australia’s migration policy settings are also in play, two key underpinnings of the old housing growth model are now under threat. At the same time, and given the centrality of that model to wealth creation for many Australian households, any sustained transition away from it will be contested. And probably bumpy.
For now, it’s not clear how much the current bout of housing market weakness simply reflects the current cyclical conjuncture as opposed to indicating the start of a more structural shift. But this is certainly a theme to watch. As is the potential political fallout as the government discovers that for all the recent public angst over affordability, homeowners (still around 66% of households) are not keen on falling prices.
Labour market mobility and economic dynamism
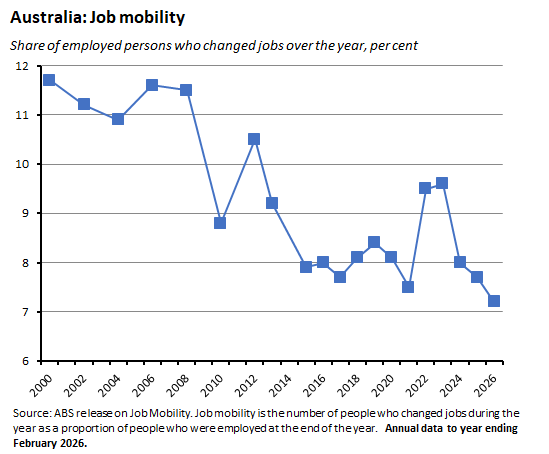
Last Friday, the ABS published new data on job mobility in the Australian labour market. The job mobility rate is measured as the number of people who changed jobs (changed their employer or business) during the year as a proportion of people who were employed at the end of that year. According to the latest numbers, one million people changed jobs in the year to February 2026, bringing Australia’s job mobility rate down to 7.2%. That was below last year’s 7.7% result and even below the COVID-19 low of 7.5% recorded in 2021.

As the chart shows, the fall in job mobility has been a long-running trend in Australia, with a decline from more than 17% in 1972. Note, however, that a recent paper by Carter and Siminski on declining job mobility in Australia finds that the official ABS data tends to ‘greatly overstate the extent of job mobility in early years, and hence the actual fall in mobility is smaller than commonly believed.’ That’s because between 1972 and 1994, the ABS mobility measure also included changes in location without a change in employer. Still, even restricting the data to the current century tells a clear story of falling mobility.
The job mobility rate has been the subject of interest in recent years as it has been seen as one key indicator of the Australian economy’s declining dynamism. That decline, in turn, is thought to be an important driver of our lacklustre productivity performance and a contributor to limited real wage growth. The Productivity Commission, for example, has noted (albeit with some important reservations) that declining job mobility has often been cited in this way. Recent research has suggested that declining labour mobility can help explain lower wage growth for workers and that rising market power has reduced the rate of productivity-enhancing labour reallocation from lower to higher productivity firms.
As this RBA article explains, the ability of workers to move easily between jobs is an important contributor to structural change, economic flexibility, and productivity, by allowing for better job matching between workers and firms. Although there are important benefits associated with movement between jobs, labour market churn can also come with costs attached, given that both firms and workers can benefit from the presence of a stable and experienced workforce, for example. In practice, then, there are trade-offs to be had for both firms and workers between mobility and stability.
It is also important to note that a range of factors will influence actual mobility levels. A significant number of job separations will be involuntary ones, as is the case with job retrenchments for example. Retrenchments are likely to reflect a mix of cyclical (downturns and recessions) and structural (shifts in industrial performance and demand patterns and skill requirements) factors. So, all else equal, we would expect involuntary separations to increase when the economy turns down and fall when growth picks up. For voluntary separations, on the other hand, the relationship with the economic cycle is likely to be the inverse, with workers more likely to seek new jobs during economic upturns when competition for labour drives up wages and the risk of finding new employment is lower.
The experience with job mobility in Australia during the COVID-19 pandemic captures some of these effects, as the economy experienced big swings in mobility. The initial impact was a sharp fall as workers faced lockdowns, high levels of uncertainty, and a slump in advertised jobs. Plus, there was the impact of Canberra’s JobKeeper program, which was designed to maintain the link between workers and employers. All of which saw the ABS job mobility measure slump to a record low of 7.5% in 2021. Later, as the pandemic wound down, job mobility increased sharply, rising to more than 9% in 2022 and 2023. Some workers ‘caught up’ on previously planned job changes put on hold during lockdown while others responded to the opportunities offered by a tight labour market and rising demand for high-skilled roles. More recently, mobility has fallen again, and as noted above, is now below its pandemic low.
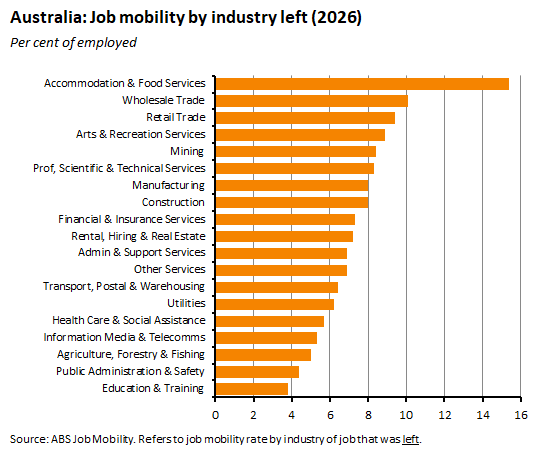
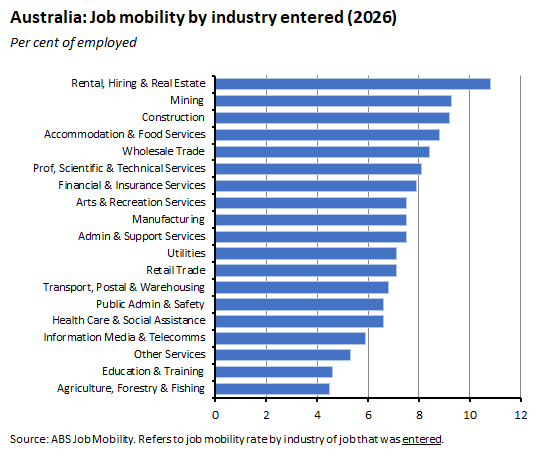
Mobility can also differ between industries, with some industries experiencing much higher rates of labour market turnover than others. There is some evidence that turnover tends to be lower in industries characterised by higher average earnings and more experienced and older workers, for example, while ABS data show that (measured by industry of exit) turnover is high in the accommodation and food services and wholesale and retail trade industries.
The results look somewhat different when measured in terms of the industry joined.
Another important driver of mobility is demographics, with the data showing that younger workers are much more likely to change jobs than their older counterparts (although the gap is narrowing).
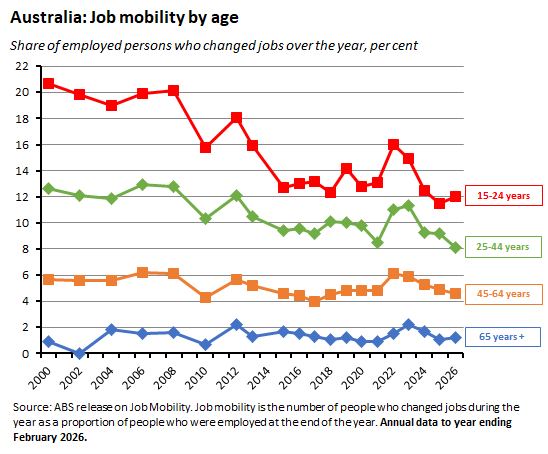
It follows that demographic change (population ageing) is a compelling explanation for at least some of the decline seen in overall mobility. Indeed, the Carter and Siminski paper cited earlier reckons that demography can explain pretty much all the decline in mobility seen up until the global financial crisis (but none of the decline seen after, when it is possible that slower growth and therefore fewer employment opportunities may have been a driver).
What about the more recent decline in job mobility? Here Carter and Siminski point to the impact of working from home (WFH), which rose significantly following the pandemic.
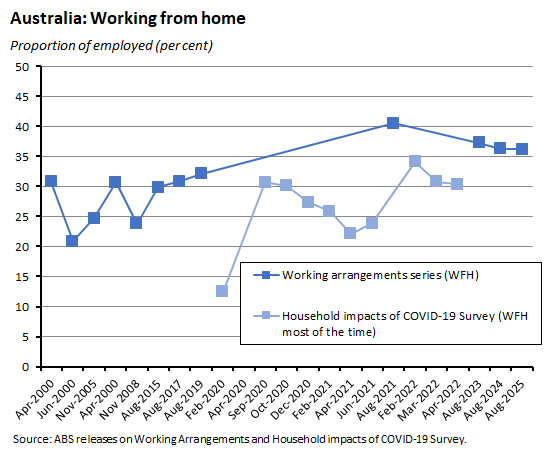
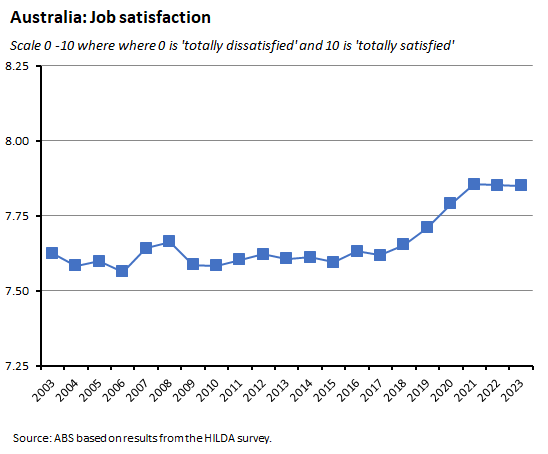
This rise in the WFH rate is correlated with an increase in reported job satisfaction as measured by the Household, Income and Labour Dynamics in Australia (HILDA) survey. Since satisfied workers are presumably less likely to look for new jobs, this might explain some of the more recent decline in mobility.
So, where does all this leave us? On the surface at least, the latest fall in job mobility as reported by the ABS is another reason to feel concerned about the dynamism of the Australian economy and the prospects for its future productivity and growth performance. Dig deeper into the data, however, and while those concerns certainly do not disappear, the story around job mobility does become more complicated.
Living costs for Australian households rose in the June quarter
According to the latest set of ABS Living Cost Indexes (LCIs), living costs rose again in the June quarter of this year.
The Bureau produces five LCIs covering five types of households: Employee, Age pensioner, Pensioner and beneficiary, Self-funded retiree, and Other government transfer recipient households. All five household types recorded increases in living costs last quarter, ranging from 0.6% quarter-on-quarter (the Pensioner and beneficiary LCI) to 1.5% quarter-on-quarter (the Employee LCI). On an annual basis, the increases range from 3.7% (the Employee LCI) to 4.7% (the Age pensioner LCI).
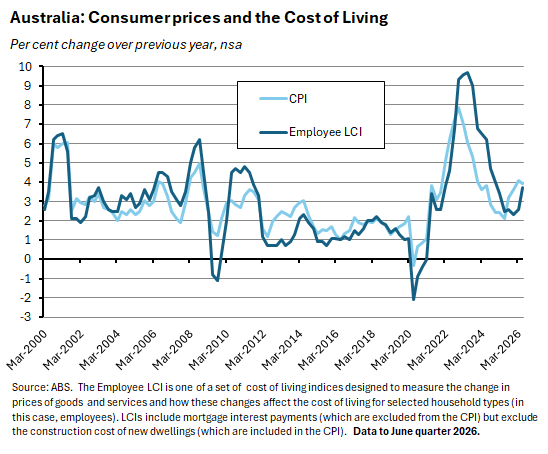
Focusing on the Employee LCI, the quarterly rise was the product of an increase in the Insurance and financial services group. This includes mortgage interest charges, which rose 8.2% over the quarter as banks passed on this year’s RBA rate hikes (although the ABS notes that only part of the RBA’s May increase was captured in the latest numbers). The inclusion of mortgage interest payments in the LCI distinguishes it from the Consumer Price Index, which excludes this measure. Swings in the RBA’s monetary policy stance therefore play a direct role in driving changes in the LCI in a way that they do not influence standard inflation measures.
On an annual basis, the growth in employee living costs has picked up again, in this case led by growth in the Housing component which captures increases in rents, utilities, and other housing costs (property rates and maintenance and repair). At an annual rate of 3.7%, the June quarter 2026 result was the biggest increase recorded since the December quarter 2024.
As we discussed in some detail here, pressures around the cost of living are currently helping to reshape Australia’s political economy.
Other Australian data points to note
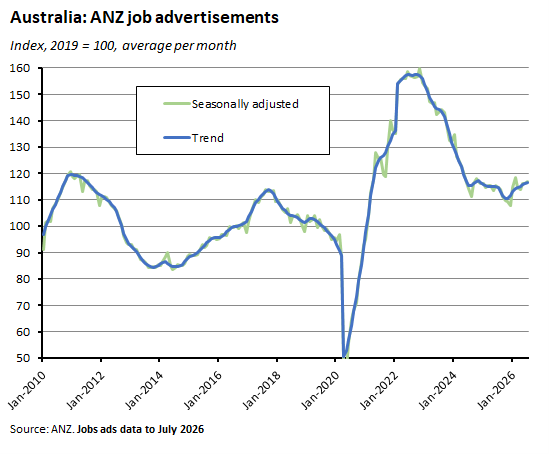
ANZ-Indeed Job Ads rose 0.8% over the month in July 2026 to be up 2.1% over the year. That increase followed a (revised) 0.1% monthly drop in June. The level of ads remains 16.2% above its 2010s average and has been little changed over the year to date, despite three RBA rate hikes. ANZ reckons that is consistent with the ongoing resilience of the Australian labour market.
The ABS said that its Monthly Household Spending Indicator rose 0.8% month-on-month (current prices, seasonally adjusted) and 6% year-on-year in June this year. The Bureau said that June’s increase in spending was driven by a second straight month of increases in discretionary spending in general and spending on Transport and on Recreation and culture in particular. Within the broader Transport grouping, the ABS highlighted the role of new vehicle sales in the June data, which in turn were propelled by significant growth in EV sales. Spending on air travel was the second largest contributor to Transport spending, as it returned to levels seen before March 2026 and the onset of the conflict in the Middle East. Increased spending on recreation and culture, meanwhile, was driven by expenditure on electronic goods, the performing arts and other live entertainment, and gambling activity (the latter likely supported by major sporting events). In volume terms, household spending rose 0.7% over the June quarter to be 2.4% higher over the year. That marked a third consecutive quarterly increase. Here too, spending on discretionary items led the way.
The weekly ANZ-Roy Morgan Consumer Confidence Index rose 3.5 points to an index reading of 74.7 for the week ending 2 August. After they all registered declines in the previous reading, the latest result brought increases across all five subindices, led by a 6.9-point jump in the ‘future financial conditions (next 12 months)’ subindex. Weekly inflation expectations also fell 0.4 percentage points to 5.5%. ANZ pointed to last week’s softer than anticipated inflation reading as a likely driver of both the rise in confidence and the decline in inflation expectations.
According to the ABS, the seasonally adjusted balance on Australia’s trade in goods rose $4.3 billion in June this year, swinging from a deficit of $2.4 billion in May to a surplus of $1.9 billion. The key driver was a $4.2 billion increase in exports of goods, led by a $2.7 billion jump in exports of non-monetary gold.
Further reading and listening
- Relevant to the previous discussion on job mobility, this Productivity Commission working paper looks at occupation and industry mobility.
- The Grattan Institute reckons that Australia has a problem with money in politics.
- On the potential implications of changing the rules around initial public offerings.
- The AFR’s John Kehoe makes the case for Australia adopting a dual-income tax system.
- The ABS reports on how Australians use their time.
- A new report from EY Oceania on the economic upside of AI for Australia reckons that AI could add between $95 billion and $116 billion to Australia’s economy by 2036, boosting real GDP by between 2.6% and 3.2%, and supporting 36,000 to 44,000 additional full-time equivalent jobs.
- The WSJ examines some of the ways the AI boom is already transforming the US economy.
- How shifts in geoeconomic power are rewiring global trade.
- The FT highlights Mexico’s role in the US AI boom and (separately) the UAE’s push into Africa.
- The latest IMF External Sector Report looks at the distribution of global current account balances in 2025 and warns that excess balances have increased, awarding a leading role in last year’s dynamics to China. That country saw its current account surplus increase by about US$300 billion or 0.25% of world GDP, marking the largest absolute widening in a current account over the past two and a half decades. In levels terms, the Fund says that the United States, China and the EU together account for about half of global current account balances. China’s surplus is the world’s largest, at about 0.6% of GDP, followed by the Euro Area at around 0.25%. The United States is the largest deficit economy, with a deficit of about 0.9% of world GDP, large enough to broadly offset the combined surpluses of China, the EU, and (non-US) oil exporters.
- Also from the IMF, a new working paper analyses a century of evidence to consider the Coming Great (Financial) Repression.
- Has AI entered the ‘loss of control’ transition? (Noema)
- How unusually hot weather is bad for us and bad for productivity.
- The air-conditioning divide among rich nations. (Australia doesn’t make the chart, but according to this ABC story by 2010 about 70% of Australian homes had air conditioning).
- The Economist magazine celebrates 40 years of burgernomics and the Big Mac Index.
- The Guardian reckons our current age is one of decadence without pleasure.
- The Macro Musings podcast gathers together Barry Eichengreen, Paul Blustein, and Brendan Greeley to talk the US dollar and global finance.
- The Odd Lots podcast considers the geopolitical implications of tungsten.
Latest news
Already a member?
Login to view this content