

 This product has already been purchased.


Overview
- Australian households and businesses are feeling squeezed. Consumer sentiment has fallen back to the pessimistic levels that marked the start of this year in the face of higher fuel prices plus the prospect of more rate rises. Business confidence and conditions are down too, reflecting slowing activity, rising costs, and narrowing margins.
- July’s stronger than expected inflation reading plus hawkish rhetoric from Martin Place have driven a re-evaluation of the likely trajectory for monetary policy. Markets are increasingly convinced that Australia’s central bank will deliver at least one and possibly two more rate hikes before the end of the year.
- Economic growth continues to slow, although the economy was still bumping up against its speed limit as of the June quarter. Australia’s productivity performance remains disappointing.
- The labour market is gradually easing while also remaining relatively resilient. The unemployment rate now stands at 4.5%. Growth in unit labour costs remains uncomfortably high, even as real wages continue to go backwards.
- Techno-economic change is making its presence felt in the data. In the March quarter of this year, data centre capex drove private business investment. In the June quarter, the transition to EV’s lifted household consumption spending.
- Given a challenging global backdrop (rising oil prices and a global bond market sell off), overall economic conditions look difficult. AI-related investment remains a key bright spot…and a key vulnerability.
After a three-week break we are back with a ‘catch-up edition’ of the Economic Weekly that looks at what we’ve learned over the intervening period about the Australian economic outlook.
The extended break means that there is quite a lot of detail to cover, but in summary:
- This week’s batch of consumer and business survey results told us that Australian consumer sentiment has now fallen back to the pessimistic levels that characterised the start of this year, as households fret about higher fuel prices and the prospect of higher interest rates. The ongoing slide in house prices is another headwind for sentiment among homeowners. Meanwhile, business confidence is down and business conditions are weakening as firms are squeezed by still-rising costs. Overall, the Australian private sector is not feeling confident about current or expected future conditions.
- Expectations of a looming interest rate rise help explain some of that unhappiness. The Minutes for the August 2026 meeting of the RBA’s Monetary Policy Board (MPB) depicted a central bank already giving serious consideration to the case for a pre-emptive rate increase. After the arrival of a stronger-than-expected set of monthly inflation numbers for July, depicting underlying inflation stubbornly above target, financial markets and RBA-watchers have reacted by pricing in a strong possibility of a rate hike either at the upcoming 28-29 September MPB meeting, or at the 2-3 November meeting, and even perhaps at both.
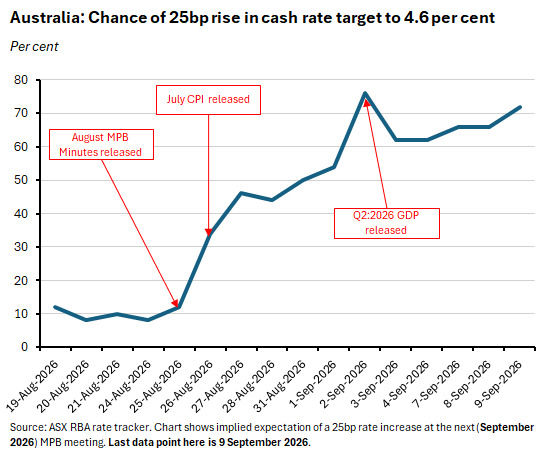
- The case for a fourth RBA rate hike this year was further reinforced by the June quarter 2026 national accounts. Granted, the latest set of GDP numbers did report an ongoing deceleration in annual economic growth – falling from 2.6% in the December quarter 2025 to 2.5% in the March quarter of this year to just 2.1% in the June quarter. Indeed, in per capita terms the economy hardly grew at all, rising by just 0.7% over the year. But at 2.1%, the economy’s headline rate of expansion is still running at or above the central bank’s estimate of potential growth of ‘a little above 2%.’
- The central bank’s concerns about the inability of the Australian economy’s supply side to cope with even 2% growth were likely further validated by another lacklustre productivity result. According to the same set of national accounts, labour productivity was flat over the June quarter and went backwards over the year. Our current level of productivity is barely 1% above its 2015-19 average.
- The labour market continues to show signs of softening, albeit at a gradual pace. The unemployment rate nudged up to 4.5% in July. That’s the highest rate since April this year, and before that since November 2021. Even so, the labour market is likely still a little tighter than the central bank would prefer, despite the recent rate of loosening running somewhat ahead of the RBA’s projections as set out in the August 2026 Statement on Monetary Policy (SMP). Meanwhile, other indicators including vacancy rates and job ads still suggest relative job market resilience.
- Nominal wage growth as measured by both the Wage Price Index (WPI) and the national accounts measure of earnings per hour has continued to moderate. But the impact on unit labour cost growth has been offset by that disappointing productivity performance. Meanwhile, the annual rate of real wage growth was negative again in the June quarter as headline inflation outpaced nominal wage increases for a third consecutive quarter.
Taken overall, then, the economy finds itself in an uncomfortable place. Despite slowing growth, falling house prices, declining real wages and (gently) rising unemployment, inflation remains stubbornly high. That in turn raises the prospect of further monetary policy tightening, and hence additional downward pressure on activity and housing values.
Add to that mix an international economic environment that combines the persistent disruption associated with the Iran war (the latest escalation in that conflict saw oil prices climb past US$100/b this week for the first time since July this year), increasingly jittery global bond markets (the average yield on 10-year government bonds across the G7 is now at its highest level since 2008), and an international financial and economic outlook that as a result has been left more and more hostage to the AI story, and it is hardly surprising that households and businesses are feeling nervous.
We dig into these various stories in more detail below, briefly discuss how techno-economic change is making its presence felt in Australian data, and then conclude with our regular roundup of suggestions for further reading and listening.
Consumer sentiment is softening again
After having spiked upwards in August 2026, the Westpac-Melbourne Institute Consumer Sentiment Index fell 5.2% to an index reading of 84.4 in September this year. That took sentiment back down towards the pessimistic levels that characterised the start of the year. All five subcomponents fell over the month, ranging from a 9.2% fall for ‘family finances vs a year ago’ to a 3.8% drop for ‘family finances next 12 months.’ The combined impact of higher petrol prices, rising expectations of another RBA rate increase, and broader cost of living pressures all likely contributed to this month’s marked souring of sentiment.
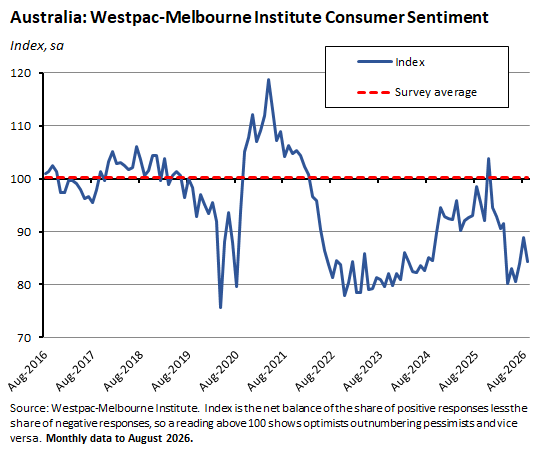
Consistent with that message, the latest ANZ-Roy Morgan Consumer Confidence Index fell to an index reading of 71.9 for the week ending 6 September 2026, with the overall drop again reflecting declines across all five subindices that left confidence at its lowest level since late July.
The housing market continues to weaken
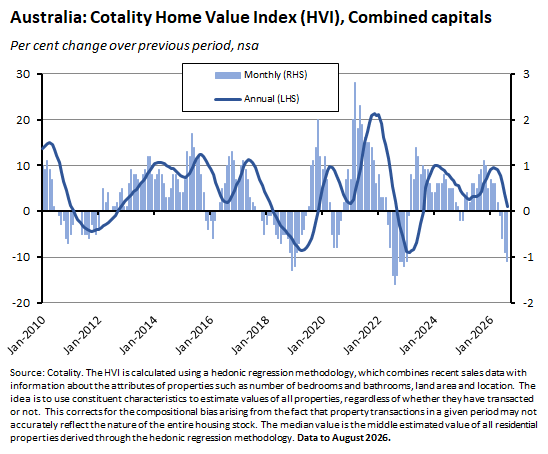
For homeowners in particular, uncertainty around a weakening housing market is likely another factor driving sentiment lower. In a fifth consecutive monthly decline, Cotality’s national Home Value Index fell 0.9% over the month in August 2026. Housing values are now down 3.6% from their March 2026 peak, albeit still up 2.7% over the year.
The Cotality combined capitals index was down 1.1% over the month, with values 4.6% below their May 2026 peak, although still 1.1% higher over the year. According to the data provider, the housing downturn is now widespread, with more than 90% of capital city suburbs having recorded a decline through this year’s winter months.
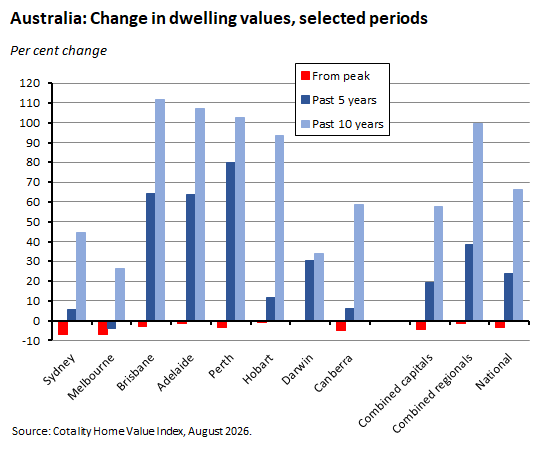
Sydney has suffered the largest fall to date, with values down 4.6% over the past year and 7.1% below their peak. Melbourne has seen similar-sized declines, of 4.7% and 6.8%, respectively (although in this case the peak was back in March 2022). Still, for most cities, recent moves continue to look relatively modest when set against the preceding increases seen over the past decade (granted, this will be cold comfort for more recent buyers).
Cotality highlights weakness on the demand side of the housing market, noting that its quarterly estimate of home sales is now tracking 15.5% lower than for the same period last year and has eased to 11.5% below the five-year average. With homes now taking longer to sell, advertised supply is likewise running markedly above past levels: over the four weeks ending August 30, for example, capital city listings were 24% higher than a year ago and 8% above their five-year average, despite a decline in new listings. Other indicators of housing market weakness include low auction clearance rates (currently below 50%) and large vendor discounting.
The shifting dynamics of the housing market are also visible in new ABS data on the total value of dwellings in the June quarter 2026. Here the numbers show the total value of residential dwellings in Australia falling by $34.1 billion (a 0.3% drop) over the previous quarter to $12.7 trillion. That marked the first decline in the value of Australia’s dwelling stock since the September quarter 2022 and was accompanied by an $8,200 (0.7%) fall in the mean dwelling price, to $1.1 million.
Business confidence and conditions are also weakening
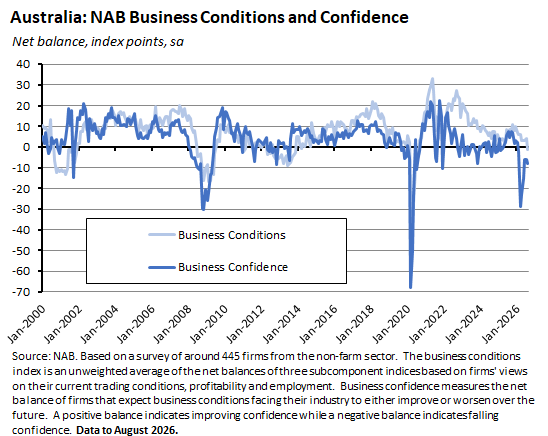
Importantly, it is not just households and the consumer that are struggling with current economic circumstances. The August 2026 edition of the NAB Monthly Business Survey reports what NAB describes as a ‘material softening in conditions’, in a manner consistent with the pace of economic growth continuing to slow into the second half of this year.
According to this week’s release, business conditions fell five points to -1 index point last month, with the conditions index suffering its first negative reading in six years (since August 2020) and dropping well below its long-run average of +6 index points. All three subcomponents of the index also declined, with falls for employment (down one point to +3 index points), trading conditions (down five points to +3 index points) and profitability (down 10 points to -9 index points). Note that both the profitability and trading measures have now fallen to multi-year lows. In contrast, the employment indicator has proved relatively resilient, which is consistent with the labour market story told below.
Business confidence was also down in August this year, falling two points to -8 index points. That is 12 points below the index’s January 2026 level and three points below the series’ long-run average.
The capacity utilisation rate eased to 82.5% (down 0.6 percentage points from an elevated July reading but still more than a full percentage point above its long-run average).
Even as activity softens, businesses continue to face persistent cost pressures. Purchase cost growth rose 0.1 percentage points to 2.3% (quarterly rate) last month, due to large increases in construction and manufacturing costs which together offset modest declines in other industries’ costs. The rate of increase in labour costs eased by 0.1 percentage points to 1.9%. Final product price growth dropped 0.2 percentage points to 0.8%, prompting NAB to highlight the historically large gap between purchase cost growth and product prices that was helping drive the sharp drop in the survey’s measure of profitability noted above.
The RBA remains worried about upside risks to inflation
Household and business sentiment is also suffering from renewed concerns regarding the prospect of further rate increases from the RBA. Those concerns were reinforced last month with the publication of the Minutes of the 10-11 August MPB meeting. That meeting had delivered what we described at the time as another hawkish hold after policymakers had debated the merits of a fourth increase in the cash rate target this year.
The Minutes explained that the case for leaving the cash rate unchanged had largely rested on the judgement that monetary policy was already ‘sufficiently restrictive to bring inflation back to target within a reasonable timeframe, and that there was still some time to assess the accuracy of that judgement.’ In line with this view, actual inflation outcomes prior to the August MPB meeting had turned out to be a little lower than the RBA had previously expected even as the unemployment rate had risen by a bit more than anticipated. In addition, given the presence of downside risks including the ongoing conflict in the Middle East and the correction in the domestic housing market, there was a case that the risks to the inflation outlook were more balanced than assumed in the August 2026 SMP.
As the Minutes put it:
‘Members agreed that the prevailing cash rate appeared to be working to bring the economy gradually back into balance and that the data received since the previous meeting had been consistent with this observation. The Board concluded that, in this light, there was time to assess the incoming data for signs of the risks to the inflation forecast materialising.’
Still, the MPB did debate the case for a rate hike last month. According to the Minutes, the argument for action rested on pre-emptive policy tightening. For example, to the extent that risks around the inflation outlook were skewed to the upside (which after all was the judgement made in the SMP), then it could ‘be appropriate to mitigate those risks somewhat by tightening monetary policy pre-emptively.’ Likewise, the importance of short-term price expectations in driving inflation dynamics even under circumstances when long-term expectations remain anchored could, given their elevated levels, reinforce the case for a more pre-emptive policy approach.
That case could be further supported if the trade-off involved in bringing inflation down faster (given by the associated cost in terms of higher unemployment and lower activity) is more attractive than it has been before. Recent RBA staff research has found that relatively significant changes in inflation can be associated with quite small changes in capacity utilisation when the economy is operating with limited spare capacity – something the RBA does think characterises current conditions. Moreover, avoiding any further prolonged delay in returning inflation to target could also argue for a more aggressive policy approach.
Despite the unanimity in the August MPB’s ultimate vote to leave policy unchanged, the Minutes did report that there were differences in members’ assessment of the outlook:
‘Several members judged that it was quite possible that the upside risks to the inflation forecast would crystallise, requiring some further tightening. Other members noted the potential for downside risks to offset them. All members agreed that, given prevailing uncertainties, upcoming decisions would benefit from additional information that could strengthen their conviction about the outlook for inflation.’
And in a repeat of the message delivered immediately after that August MPB meeting, the Minutes reminded us that the RBA was ready to tighten policy if required:
‘The Board will remain focused on its mandate to deliver price stability and full employment and will continue to do what it considers necessary to achieve that outcome, including increasing the cash rate target if upside risks materialise.’ [emphasis added]
July’s inflation reading sounded alarm bells
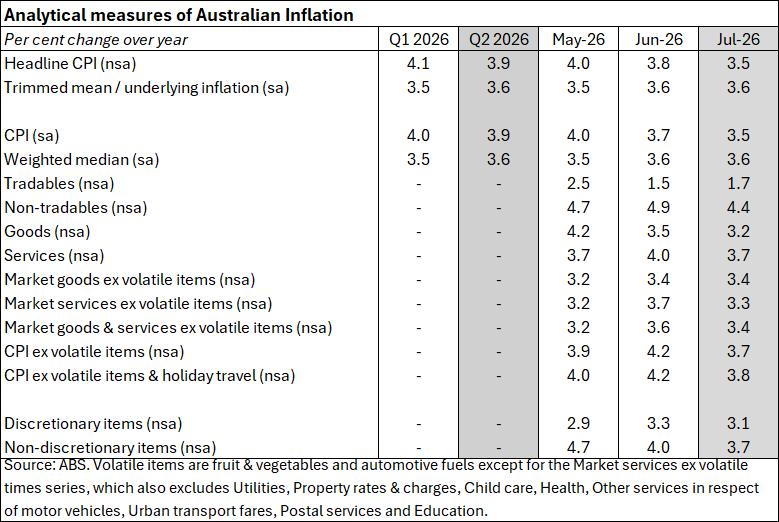
Helpfully for narrative coherence, a potential indicator of those upside risks arrived just one day after the release of the Minutes in the form of the July 2026 Consumer Price Index (CPI) release. This showed headline CPI inflation running at 3.6%. Granted, that was down from an annual rate of 3.8% in June. But the outcome was markedly stronger than the market had expected, with the consensus forecast having anticipated a more muted 3.3% print.
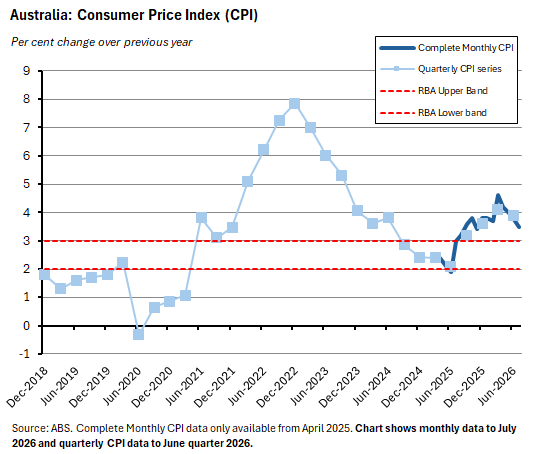
According to the ABS, the largest contributor to July’s annual inflation result was the Housing group, which rose by 5%, powered by rising costs for new dwellings as builders passed on higher expenses related to materials and labour. Other important drivers included Food and non-alcoholic beverages (up 3.2%) and Recreation and culture (up 2.6%). In the case of the former, the main contributor was Meals out and takeaway food prices, up 4.5% over the year due to higher costs including the minimum wage award increases, which took effect from 1 July. Transport inflation also picked up sharply: after having fallen for three consecutive months, automotive fuel prices rose 7.5% over the month in July, reflecting higher global oil prices and the partial unwinding of Canberra’s fuel excise relief measures. Worryingly for the central bank, all this suggested persistent, broad-based price pressures in the economy.
Such concerns will have been exacerbated by the latest monthly version of the CPI Trimmed Mean, which printed at an unchanged 3.6% in July after rising by a strong 0.5% month-on-month, exceeding the consensus forecast for a 3.5% result.
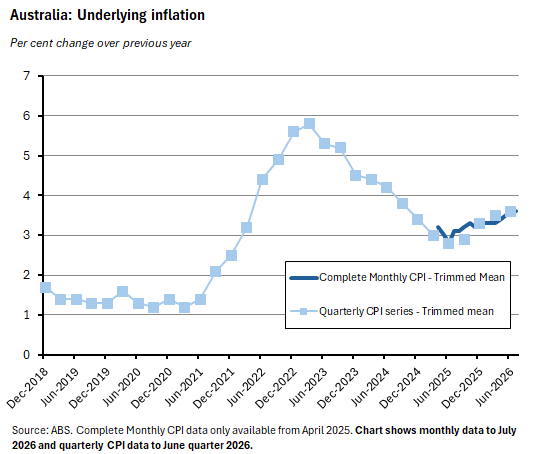
The weighted median measure of underlying inflation was likewise unchanged at 3.6% and while other analytical measures moved lower from their June outcomes in terms of their annual rates, that still left most readings stuck above the top of the 2%-3% inflation target band.
As discussed earlier, both financial markets and RBA-watchers have reacted strongly to the July inflation numbers, judging that evidence of stubborn inflationary pressures in the context of a central bank that has warned repeatedly about upside risks to inflation is likely to call forth a policy response. That change in sentiment has manifested in an abrupt shift to pricing in at least one and possibly two more rate rises from the central bank, with markets at the time of writing pricing in a more than 70% probability of a rate hike later this month.
It is, however, worth injecting one note of caution here. In the past, the RBA has been reluctant to place too much weight on the still-new monthly CPI series, preferring to put more emphasis on the quarterly readings. The next monthly CPI reading (for August 2026) is due on 30 September (the day after the conclusion of the September MPB meeting) while the September quarterly data will arrive on 28 October (a few days before the November MPB meeting). It is therefore possible that at least some MPB members will prefer to wait until November before acting on rates, even though such patience would push against both the arguments for a pre-emptive response and the hawkish tone of the recent rhetoric emanating from Martin Place. So, scope for a split MPB vote this month?
Economic growth is slowing but still pushing against the economy’s ‘speed limit’
The June quarter 2026 national accounts showed real GDP rising 0.4% over the quarter (seasonally adjusted) to be up 2.1% over the year. Compared to the March quarter 2026, that result represented a modest pickup in the rate of quarterly growth (from 0.3% quarter-on-quarter previously) but a slowdown in the annual rate (from 2.5% year-on-year). It also represented another stronger outcome than the market had expected, with the consensus forecast having anticipated 0.3% quarter-on-quarter and 1.8% year-on-year. And it was also faster than the 1.9% projection in the August 2026 SMP.
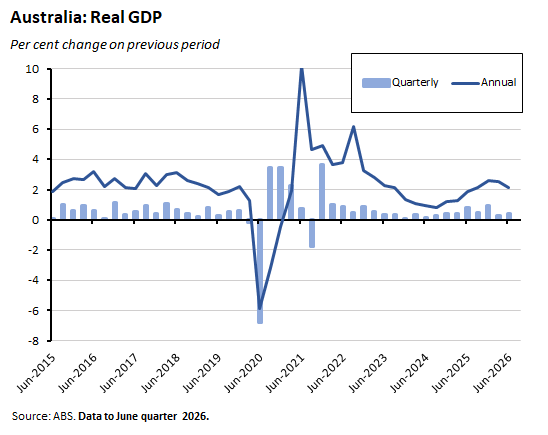
Strip out population growth (still running at an annual rate of around 1.4%), and GDP per capita was flat over the quarter and up just 0.7% over the year.
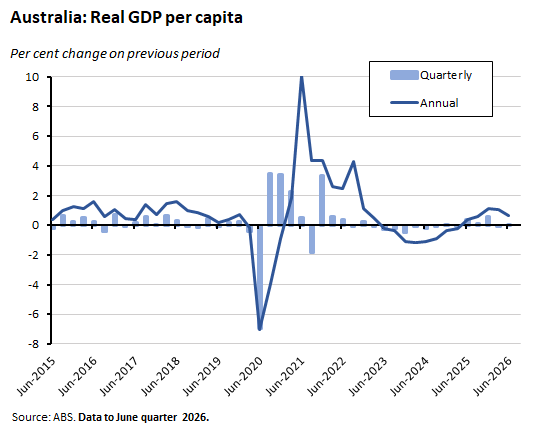
The ABS also said that GDP grew by 2.4% across the full 2025-26 financial year (stronger than the August SMP forecast of 2.2%) while GDP per capita rose by 0.8%.
According to the Bureau, the relatively subdued growth outcome in the June quarter 2026 was driven by a mix of cautious consumers (with the standout exception of spending on EVs), a drop in business investment (the latter reflecting some payback from the March quarter surge in capex on data centre fit-outs, even as investment in data centres remained at elevated levels), a rise in dwelling construction, a modest contribution from public consumption, and a decline in public sector investment.
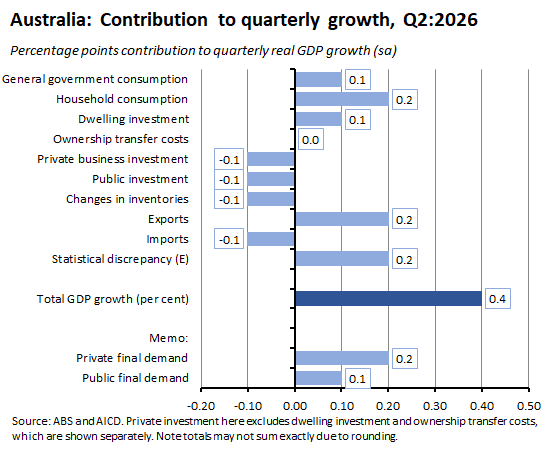
With the RBA estimating that Australia’s current annual rate of potential growth is ‘a little above 2%’, the slowdown in activity still leaves the economy bumping up against its speed limit. According to the August SMP, Martin Place thinks we will slow further from here, with real GDP growth falling to an annual rate of just 1.4% by the December quarter of this year before recovering through the second half of 2027.
Australia’s productivity performance continues to disappoint
Labour productivity (measured as GDP per hour worked) was unchanged over the June quarter 2026 and down 0.2% over the year. That left the level of economy-wide labour productivity barely 1% above the 2015-19 average. Non-market sector productivity has fallen below the level it had attained back in March 2007.
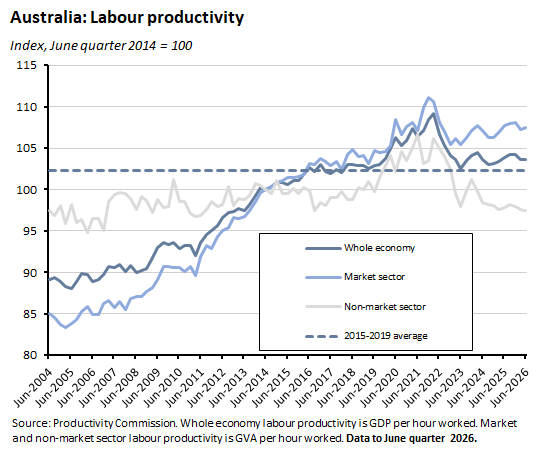
There is, then, still no sign of the hoped-for turnaround in Australia’s productivity performance. Indeed, to the extent that productivity growth might be expected to be procyclical, and with growth set to slow further this year, there seems to be little scope for any significant improvement in the near term.
The labour market has continued to ease, albeit gradually
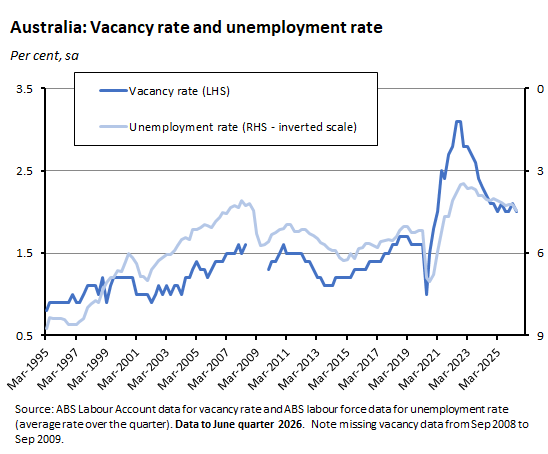
Along with the economy’s overall speed limit, the RBA has also been concerned that the labour market in particular is too tight to be consistent with inflation at target (while remaining mindful of its objective to achieve ‘the current maximum level of employment that is consistent with low and stable inflation’). The recent story of the labour market in this light is one of gradual loosening combined with overall resilience, and the latest data suggest that we remain on this trajectory. Thus, Australia’s unemployment rate rose to 4.5% (seasonally adjusted) in July 2026, up from 4.4% in the previous month, as the number of unemployed people increased by 4,200. Measured on a trend basis, the unemployment rate also rose from 4.4% to 4.5% over the same period. The market consensus had expected a 4.4% print.
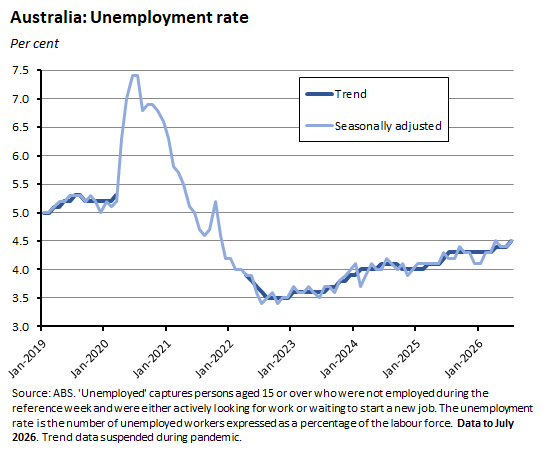
Meanwhile, the underemployment rate was little changed at 6.4% while the underutilisation rate edged down to 10.8% in July from 10.9% in June.
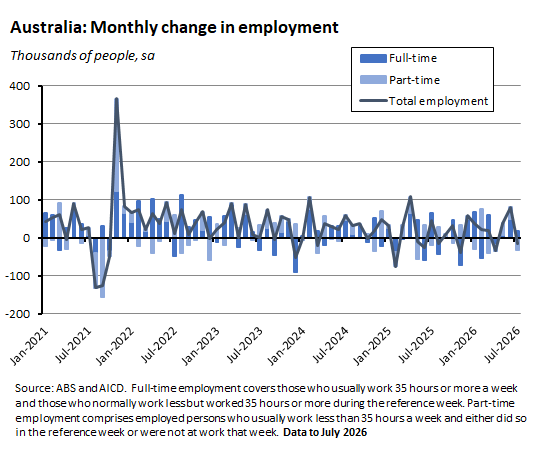
Employment fell by 15,800 people over the month in July, as a 16,300 increase in full-time employment was more than offset by a 32,200 drop in part-time employment. Again, this was weaker than the market consensus forecast, which had expected employment to increase by 12,000.
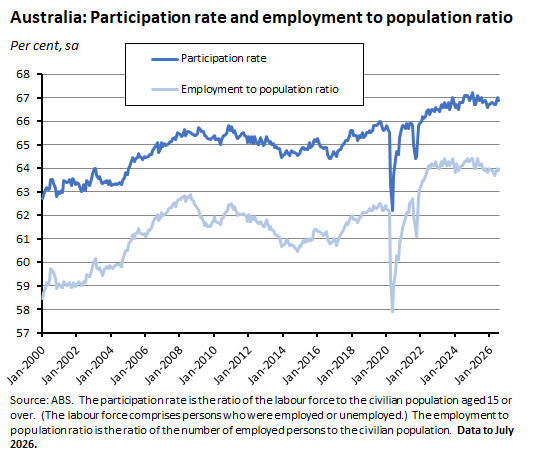
The employment-to-population ratio fell 0.2 percentage points to 63.9%. The participation rate fell 0.2 percentage points to 66.9%.
To provide some context here, in the August SMP, the RBA had forecast the unemployment rate to end this year at 4.5% and after that to grind slowly higher, reaching 4.6% by the middle of next year, 4.7% by end-2027 and 4.8% by mid-2028. This entailed the labour market ‘returning to balance’ in 2027 followed by ‘some spare capacity in the back half of the forecast.’ That suggests the labour market is broadly tracking in line with the RBA’s projections, that the recent pace of loosening is running slightly ahead of them, and that the adjustment still has some way to go.
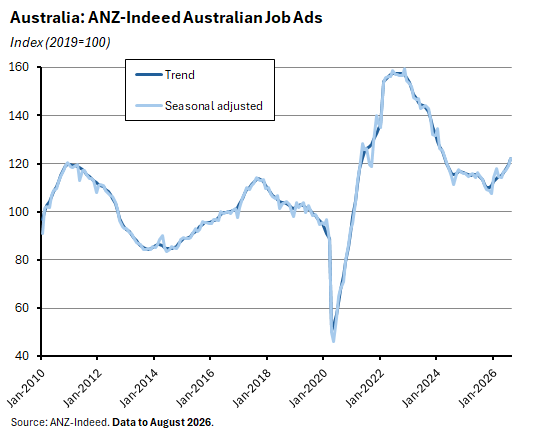
Other recent data are consistent with labour market resilience. For example, ANZ-Indeed Australian Job Ads rose 2.5% over the month in August 2026 to be up 7.8% over the year.
Similarly, the ABS Labour Account data for the June quarter 2026 reported a 110,700 increase in the number of filled jobs over the quarter, representing a fifth consecutive quarterly rise. Main jobs were up 0.4% while secondary jobs rose 4.6%. The multiple job-holding rate rose to a new record high of 6.9%, with around one in fourteen Australians now holding more than one job.
The Labour Account numbers also showed a modest fall in the vacancy rate to 2% from 2.1% in the March quarter of this year. Overall, however, the vacancy rate has been little changed since the second half of 2024.
Nominal wage growth is moderating
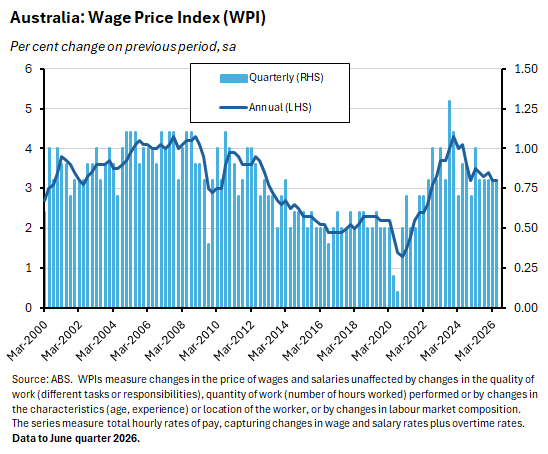
That easing labour market has been accompanied by a gradual moderation in wage growth. According to the ABS June quarter 2026 Wage Price Index (WPI), wages rose by a seasonally adjusted 0.8% over the quarter to be up 3.2% over the year. While that annual rate of increase was unchanged from the March quarter of this year, it was slightly below the 3.4% recorded in the June quarter 2025. The rate of change of the WPI was also in line with market forecasts and a little softer than the RBA’s August 2026 SMP projection, which had expected a 3.3% rise. That same RBA forecast sees wage growth slowing to 3.1% by year-end and continuing to ease to 2.9% by end-2028.
Wage growth is also well down from the peak annual rate of 4.3% recorded in the December quarter 2023.
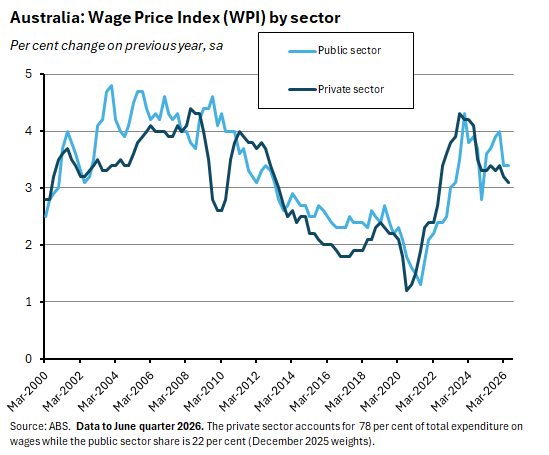
Private sector wage growth slowed to 3.1% year-on-year last quarter while public sector wages rose 3.4% in annual terms. Public sector wage growth has now outpaced its private sector counterpart for six consecutive quarters.
Some 10% of private sector jobs recorded a wage change over the June quarter – the lowest share of private sector jobs recording a wage change since the June quarter 2020 – while the average hourly wage change for those private sector jobs was 3.9% (original basis).
The ABS also noted that overall jobs with a wage change of less than 4% over the past year rose to 79%, which according to the Bureau is the largest share seen since the June quarter 2022 (84%).
But growth in unit labour costs remains too high
The annual rate of increase in the national accounts measure of average earnings (AENA) has also continued to slow from its recent September quarter 2025 peak (6.2%), easing to 3.3% in the June quarter (growth in non-farm AENA was lower, at 3.1%).
Readers may recall that in the past the RBA has reckoned that a sustainable rate of medium-term wage growth based on this measure is around 3.2% (equal to at-target inflation of 2.5% plus 0.7% labour productivity growth). For the WPI, the comparable figure is 2.9%. So, wage growth is now close to that ‘equilibrium’ rate.
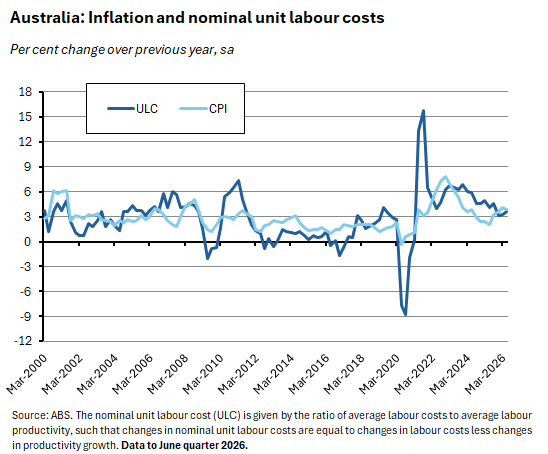
Unfortunately, a complication here is that with labour productivity going backwards over the same period, unit labour cost growth remained uncomfortably high in the June quarter, running at an annual rate of 3.6% (3.5% for non-farm unit labour costs).
Meanwhile, real wages are still going backwards
At the same time, with annual WPI wage growth running at 3.2% last quarter compared to a headline inflation rate of 3.9%, annual real wage growth was negative for a third consecutive quarter.
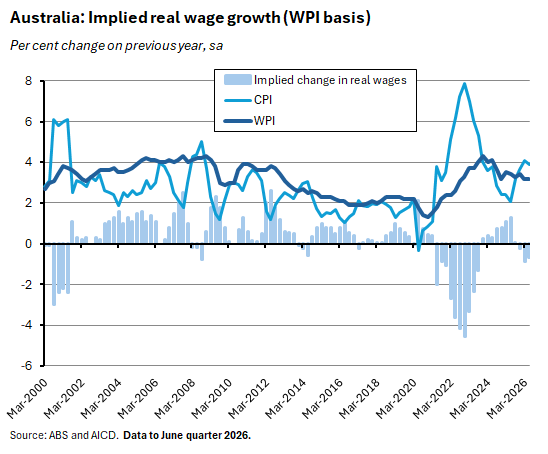
Which brings us back to where we started. Given falling real wages, a slowing economy and the prospect of further interest rate increases, it is no surprise that many Australian households are feeling squeezed.
A quick note on structural change and the economy
Before wrapping up, it’s worth highlighting one interesting feature of the national accounts for both the March and June quarters of this year – the appearance in the growth data of new techno-economic paradigms, in the form of AI-related spending on data centres and household spending on the transition to electric vehicles (EVs). So:
- In the March quarter 2026, this was evident in the major contribution that data centre investment made to the economy. As the ABS reported at the time, private business investment was boosted by a 16.3% jump in machinery and equipment capex, its largest rise in 30 years. Mostly that reflected the expansion of data centres in New South Wales and Victoria, although the net impact of that higher investment on GDP growth was offset by the high import content of the equipment.
- And in the June quarter 2026, household consumption spending was boosted by a 10.3% jump in the purchase of vehicles, as households continued to transition to EVs. Almost half of the June quarter’s growth in discretionary spending was due to this source. Once again, there was an offsetting trade impact, with the ABS reporting record imports of electric and plug-in hybrid vehicles as imports of non-industrial transport equipment jumped by 38.1%.
Further reading and listening
- The PBO’s 2026-27 National Fiscal Outlook for Australia.
- Related, Grattan on Australia’s debt problem.
- Also related, Australia’s $1 trillion of federal government debt, charted.
- And some ABS insights into Australia’s government finance statistics as of the June quarter this year.
- A Productivity Update from the Productivity Commission.
- An Inflection Points essay suggesting changes to Australia’s immigration system including a proposal to limit the annual rate of population growth due to immigration to below 1%.
- The National Housing Supply and Affordability Council’s August 2026 Quarterly Report. The good news: there were 244,000 dwellings under construction in the March quarter 2026, marking the highest result since records began in 1984. Since the Accord started, some 308,000 homes have been built, or about a quarter of the target. That covers seven of the 20 quarters of the Accord period to date. The not-so-good news: the forecast date for meeting the target of 1.2 million new homes has now been pushed back to the December quarter 2030.
- Related, why are Bathla and other Australian home builders collapsing?
- A transcript of RBA Deputy Governor Andrew Hauser’s ABC 7.30 interview.
- The August 2026 edition of the RBA Bulletin.
- The Economist magazine says inflation is back. Across the world economy, central banks are hiking interest rates in response.
- An IMF note on current issues in forward guidance.
- An FT Big Read on the world’s US$2 trillion interest bill.
- The WSJ’s Greg Ip explains why the bond market has issued world leaders a failing grade.
- Ken Rogoff asks, is the Trump Treasury panicking over the level of US debt?
- Related, a Brookings Institution working paper analysing foreign demand for US assets.
- Chatham House on the next financial crisis and the possibility of a ‘reverse Kindleberger trap.’ A Kindleberger trap is when the declining global hegemon is unable to provide the leadership necessary to stabilise the world economy and the rising hegemon is unwilling. Thus, in the notorious case of the interwar years, the UK couldn’t and the USA wouldn’t provide that leadership. But this time, it may be the existing hegemon that proves unwilling to provide the necessary global public goods – hence the reverse Kindleberger trap.
- Apollo’s Torsten Slok reckons that in six months’ time, interest rates are likely to be lower. That’s because either AI will have succeeded, tech companies will be generating trillions in revenue, and deflation will be widespread, pushing rates lower; or AI will have failed, the market bubble will have burst, and investors will have fled equities for bonds, driving down yields.
- The IEA on the rise of lithium-ion batteries.
- Thomas Neuberger’s three-part series on the incoming ‘Super El Niño,’
- On climate change and monetary policy.
- Warnings of a breakdown in the global maritime order.
- The September 2026 edition of the IMF’s Finance & Development magazine focuses on Asia.
- Two interesting reports from the OECD. Tax Policy Reforms 2026 covers tax policy changes and trends from last year and finds that after the economic shocks of COVID-19 and the 2022-23 energy crisis had triggered a set of common policy responses across countries, now policy objectives are becoming more diverse. The second report, The Space Economy at a Glance 2026, summarises recent developments across the space economy, which it reckons is ‘now a growing industrial force supporting innovation, new services and public policy objectives.’ According to the OECD, estimated global space-related revenues were US$550 billion-600 billion in 2025, meaning that the industry is starting to approach the scale of the global semiconductor industry (valued at about US$620 billion in 2024).
- Some possible implications of SLMs vs LLMs.
- The generative AI learning penalty in secondary schools.
- Lessons from Singapore regarding efficiency vs self-sufficiency.
- On payday loan apps.
- The Joe Walker podcast has started a new series on Compute in Australia. The first episode talks with Andrew Charlton (Assistant Minister for Science, Technology and the Digital Economy) about data centres and plans for sovereign AI while the second considers the geostrategic case for compute in Australia.
- The Australia in the World podcast in conversation with Graham Fletcher on managing China.
- The Conversations with Tyler podcast with Jared Diamond on the role of leaders.
Latest news
Already a member?
Login to view this content