

 This product has already been purchased.


Overview
- Better-than-expected June inflation numbers have seen markets price in virtually no chance of an RBA rate hike in August.
- Even so, with headline and underlying inflation both still uncomfortably above target, Australia is yet out of the inflation woods just yet.
- Despite the US Supreme Court’s February 2026 decision to strike down some of its earlier tariff measures, the Trump administration has largely rebuilt its tariff wall. Washington’s appetite for further coercive trade policy looks undiminished.
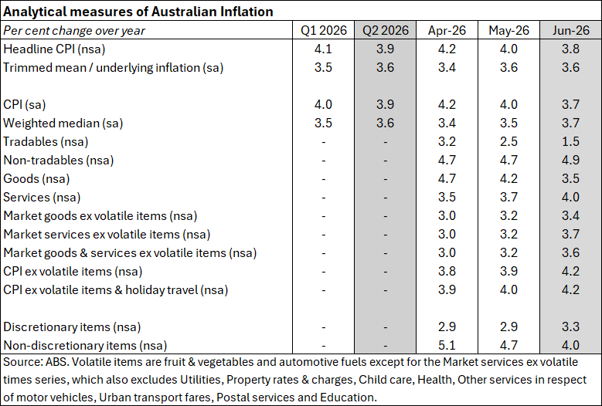
This week’s Consumer Price Index (CPI) numbers from the ABS turned out better than the market had expected. Headline inflation slowed to 3.8% in June 2026, down from 4% in May and below the consensus forecast for another 4% print. At the same time, the RBA’s preferred measure of underlying inflation – the quarterly version of the trimmed mean – came in at an annual rate of 3.6% in the June quarter. While that was up from the March quarter’s 3.5%, it was still softer than the median forecast for a 3.7% result. All of which takes some of the pressure off the RBA ahead of the upcoming Monetary Policy Board (MPB) meeting on 10 – 11 August. The market probability of a rate hike next month, which had briefly spiked to above 40% last week, had already started to fall by the start of this week. After the new CPI data, that probability has slumped.
Note, however, that an expected hold by the MPB in August is not equivalent to declaring Australia’s inflation problem over. Both headline and underlying inflation remain uncomfortably above the top of the RBA’s inflation target band, and on an annual basis a series of analytical measures of inflation continued to rise last month. We dig into the inflation numbers in more detail below. We also consider the new structure of US tariffs and their implications, and provide the usual selection of further reading and listening.
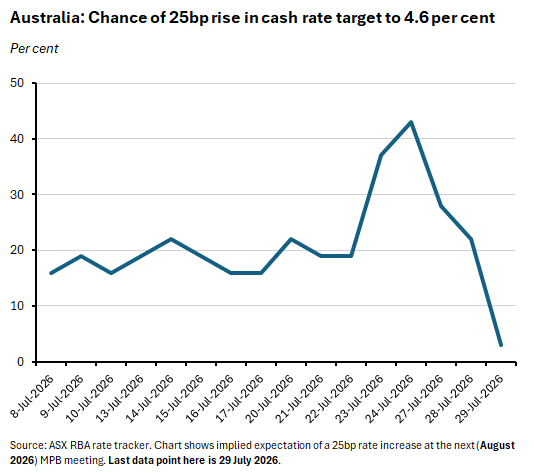
June’s inflation results were a bit softer than expected
The ABS said that Australia’s CPI fell 0.1% over the month in June 2026 to be up 3.8% over the year. That annual rate of inflation was down from May’s 4% print and marked the lowest reading since February this year. It was also a better outcome than the market had expected: the consensus forecast had called for a 0.2% month-on-month rise and another 4% annual gain. Even so, June’s result means that headline inflation has now been above the top of the RBA’s inflation target band (that is, greater than 3%) for 10 consecutive months.
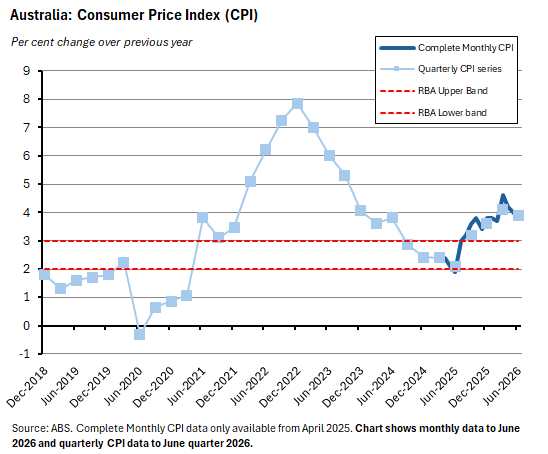
While the inflation target is set in terms of the headline rate, the RBA pays more attention to underlying inflation as a guide to the ‘true’ state of price pressures in the economy, since this measure strips out volatile, one-off and temporary factors. The central bank’s preferred gauge of underlying inflation is the trimmed mean, although complicating the matter here is the presence of two different versions – the new monthly one and the old quarterly one. According to the latest monthly reading, underlying inflation was up 0.3% over the month to stand at 3.6% in annual terms. That annual increase was unchanged from the previous month but again was slightly lower than the consensus forecast of 3.7%.
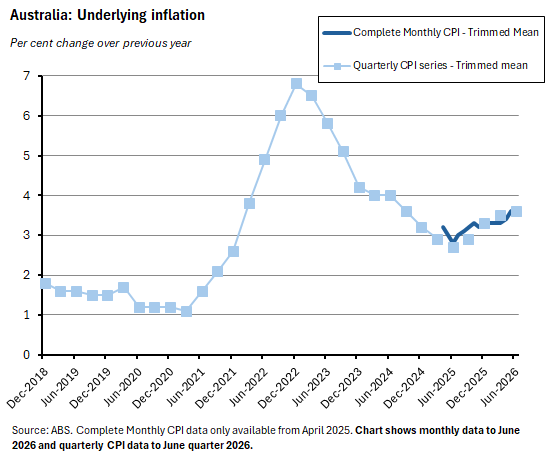
Importantly, however, the RBA has said that until it is comfortable with the new monthly series (including its seasonal properties), it will continue to track the quarterly trimmed mean as a key guide to underlying inflation. That preferred measure of underlying inflation was unchanged at 0.8% quarter-on-quarter in the June quarter, while the annual rate edged up to 3.6% from 3.5% in the March quarter. Once more, this was a better outcome than the market had anticipated, with the consensus forecast having projected outcomes of 0.9% quarter-on-quarter and 3.7% year-on-year.
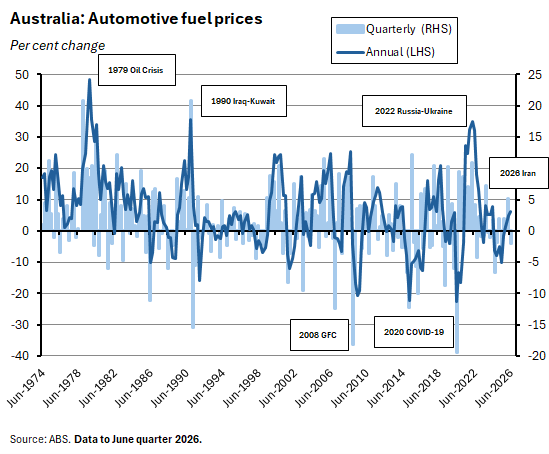
Both headline and underlying inflation also printed softer than the RBA’s forecasts in the May 2026 Statement on Monetary Policy (SMP). The gap was particularly large in the case of the headline rate, where the SMP had predicted 4.8% instead of the actual 3.8% result. The difference reflects a smaller than expected direct impact from the war in the Middle East, due to the combined consequences of lower global oil prices over the quarter plus the ongoing effect of the government’s fuel excise reduction. Prices for automotive fuel were down 10.9% over the month in June, in a third consecutive monthly fall. Across the complete June quarter, they were down 2.1% on the previous quarter and up 6.3% over the year. That is a much lower spike (to date) than the one witnessed during the 2022 Russian invasion of Ukraine, for example.
The difference between actual underlying inflation and the SMP projections was more modest, with the RBA’s 3.8% forecast around 0.2 percentage points higher than the outcome.
Other analytical measures of inflation painted a more mixed picture. The annual rates of increase in the weighted median, CPI ex volatile items, CPI ex volatile items and holiday travel, and various measures of market goods and services inflation ex volatile items all picked up in June relative to May, for example, as did overall services and non-tradables inflation. On the other hand, goods and tradables inflation both slowed, pulled down by lower oil and fuel prices.
The bricks in Trump’s new tariff wall
In last week’s note we noted the expiration of temporary US tariff measures introduced earlier this year and flagged Washington’s pending response. Recall that on 20 February this year, the US Supreme Court struck down the subset of tariffs that President Trump had imposed under the International Emergency Economic Powers Act (IEEPA). The Trump administration had initially responded by reimposing tariffs under Section 122 of the Trade Act of 1974. Section 122 gives the US President authority to impose temporary import surcharges of up to 15% to address ‘fundamental international payment problems.’ The new measures were introduced for 150 days and applied a broad 10% tariff from 24 February to 24 July this year.
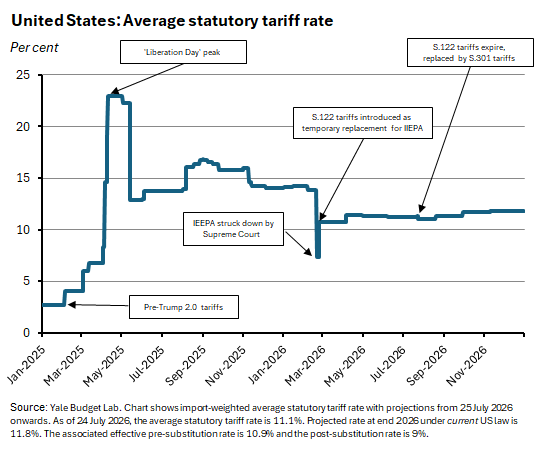
Those temporary measures have now effectively been replaced by new tariffs applied under Section 301 of the same 1974 Trade Act. Section 301 permits the Office of the US Trade Representative (USTR) to investigate unfair trade practices. Following an investigation, it allows for the imposition of tariffs or other import restrictions as well as the suspension or withdrawal of trade agreement concessions.
On 12 March, the USTR launched investigations into forced labour practices across 60 economies (including Australia) which collectively account for more than 99% of all US imports. On 2 June, it issued its findings, which determined that every economy under review had failed to meet US standards by failing to ban imports of goods made with forced labour. New forced-labour Section 301 tariffs then took effect on 24 July. Seventeen economies (including the UK, Canada, and India) which were judged to be closer to US requirements now face a flat 10% tariff that applies on top of the relevant most-favoured-nation (MFN) tariff. The EU and Taiwan also face a 10% tariff, but in their case, this is net of the MFN rate. Another 38 countries including Australia, Brazil, China, and Russia are subject to a flat 12.5% tariff. And three others (Japan, South Korea, and Switzerland) get the slightly more favourable deal of paying the 12.5% net of MFN rates. Complicating the picture still further is the presence of 15 exemption lists which mix universal exemptions with country-specific carve outs.
The administration has also used Section 301 to target Brazil in addition to the forced labour tariffs already noted. The USTR introduced a 25% tariff on Brazilian goods (subject to a range of exemptions) that went into force on 22 July. The USTR’s list of complaints against Brazil includes Pix, the country’s state-run digital payments system.
Combine the two new Section 301 measures now in force, and the impact is that the average US tariff level is largely unchanged following the expiration of the Section 122 tariffs. Global Trade Alert (GTA), for example, estimates that the trade-weighted average US tariff edged up from 11% to 11.2%. The Yale Budget Lab calculates that the average statutory tariff rate dipped slightly, falling from around 11.4% to 11.1%.
What has changed is that the single uniform rate under Section 122 has now been replaced by a more complex mix of varying country rates.

Moreover, more Section 301 measures are incoming. Back in March this year, the USTR opened investigations into structural excess capacity in 16 economies, including China, the EU, India, Indonesia, Japan, Thailand, and Vietnam. More recently, new Section 301 investigations have also been launched into Germany’s pharmaceutical pricing and Vietnam’s intellectual property practices.
The White House has also deployed other trade tools in recent weeks. On 20 July, President Trump invoked Section 338 of the Tariff Act of 1930 (the infamous Smoot-Hawley Tariff Act) against Canada, introducing an additional 50% duty on 554 Canadian tariff lines. Section 338 authorises the US President to impose tariffs when a foreign country discriminates against US commerce. According to GTA, Section 338 has not been invoked since the 1930s or 1940s, and there is no previous record of it ever having been used to impose tariffs.
Then there is Section 232 of the Trade Expansion Act of 1962, which allows the US President to adjust imports in response to threats to national security, following an investigation by the Bureau of Industry and Security within the Department of Commerce. Section 232 was already a growing favourite of the Trump White House, with previous investigations (including some set in train by the previous Biden administration) having produced higher tariffs for aluminium, steel, automobiles and parts, copper, timber and lumber, trucks and buses, and semiconductors. Sectors still under investigation include critical minerals, drones, wind turbines, robotics, medical equipment, and coal.
Back in April, the administration said that it was imposing Section 232 tariffs on patented pharmaceuticals and their ingredients. That has since been followed by plans to levy tariffs on generic or unpatented drugs. An investigation into commercial aircraft and parts also concluded earlier this month, finding a threat to national security and recommending negotiations with US trading partners. And the White House has threatened European countries with tariffs in response to digital services taxes (the UK and France already have such levies in place, while the EU parliament is pushing a Union-wide measure).
These adjustments to US trade policy have allowed Washington to rebuild the tariff wall that had been partially dismantled by the Supreme Court. These latest administration manoeuvres on the trade front also highlight a determination to persist with the Trump 2.0 version of trade policy with its regular recourse to tariff measures, its tolerance (embrace?) of the accompanying elevated levels of trade policy uncertainty and trade flow diversion, and the consequent flow of revenue. Indeed, not only has the previous, brief lowering of the US tariff wall been reversed, but the White House is signalling that it has the appetite to do more. Pharmaceutical trade is on the agenda, for example, while the targeting of Pix in Brazil plus the sabre rattling over European digital services taxes and fines for US tech firms demonstrate that Washington remains willing to deploy coercive trade measures in pursuit of national objectives across multiple fronts. And while some of those measures (Section 232 and Section 301) require at least the fig leaf of a preceding investigation, others (Section 338) do not, and might give the White House even greater leeway.
The new tariff wall is one component of a broader economic agenda. A significant area to watch here is AI. In a context where financial markets are increasingly nervous not just about the quantum of US hyperscaler capex and still-stretched valuations, but also about the implications of effective Chinese competition, calls for an aggressive ‘national security’ approach to AI are likely to mount. A protected market may be an attractive option for some US businesses, which would align commercial incentives with already-existing security concerns. The previous experience with Huawei offers one case study of how this could play out.
Other Australian data points to note
The ABS said that the number of total dwellings approved in June this year rose to 18,328. On a seasonally adjusted basis, approvals were up 7.2% over the month and 8.9% higher over the year. Approvals for private sector houses (10,631) were little changed over the month but up 15.8% in annual terms, while approvals for private sector dwellings excluding houses (7,138) jumped 17.8% over the month while dropping 1.5% over the year. According to the Bureau, across 2025-26 a total of 205,249 dwellings were approved for construction (original basis). That was up 9.2% on the previous financial year and marked the highest level of approvals since 2020-21, with private sector house approvals at their highest since 2021-22 and private sector dwellings excluding houses at their highest since 2017-18.
The ANZ-Roy Morgan Consumer Confidence Index fell 4.4 points to 71.2 points in the week ending 26 July 2026, taking the index back down to its lowest level since mid-June. All five subindices fell over the week (current and future financial conditions, short-term and medium-term economic confidence, and time to buy a major household item), with ANZ pointing to the depressing effects on sentiment of renewed conflict in the Middle East as one potential driver. Another may have been perceived higher inflation risk: ahead of this week’s CPI release, the survey’s measure of weekly inflation expectations rose 0.1 percentage point to 5.9%.
According to ABS data on international trade prices for the June quarter 2026, Australian import prices (up 5.7% over the quarter and 6.2% over the year) recorded their largest quarterly increase since the December quarter 2021. The key driver was the Middle East conflict, which saw prices of petroleum and related products jump more than 47% over the quarter in what was the biggest quarterly rise in the history of the Import Price Index (since 1983). Price rises for fertilisers (up 25%) and plastics (up 26%) were likewise significant. Prices for Australian exports rose 1.1% quarter-on-quarter and 3.9% year-on-year.
Further reading and listening
- RBA Governor Michele Bullock gave a speech on Monetary policy in an era of shocks (attendees at my recent National Economic Update and SA Forum talks might recall that the ubiquity of supply disruptions was a key theme). The good news is that the Governor reckons the Australian economy is now better placed to handle shocks such as those originating from the Iran war – the economy is less oil intensive than it used to be, monetary policy frameworks have improved, and the international economic system is more dynamic and interconnected (which trades off faster transmission of shocks for more flexibility and adaptability). Less happily, she notes, things get more complex when multiple shocks occur in quick succession and interact with each other. Governor Bullock also discussed the recent evolution of the Australian economy. Key observations included: underlying inflation has been tracking largely in line with the RBA’s expectations, although it remains too high; there has been some pass-through of higher fuel prices due to the Middle East conflict (for example, in new dwelling prices) but so far the impact on headline inflation has been smaller than initially feared; demand growth overall is moderating in line with the central bank’s May forecasts; the housing market has been weaker than expected; and the labour market has also eased ‘a bit more than expected’ over recent months, although the RBA view is that ‘some further easing in labour market conditions will likely be required to bring inflation back to target.’
- The Productivity Commission (PC)’s Interim report on Housing supply regulation sets out four principles for a best practice regulatory system for housing: adopt a ‘build’ mindset; only regulate when necessary; coordinate with infrastructure; and keep the process simple. The PC reckons that relaxing land-use controls would have the greatest effect on housing supply of all its reform proposals, arguing that governments ‘should commit to broad-based upzoning in cities, including by allowing 3-storey development on most residential land, reducing minimum lot sizes, using more mixed commercial and residential zones, and allowing more mid- and/or high-rise development in high-demand areas.’ To that end, the Commission says that this upzoning ‘should be supported by reducing restrictive land-use and built-form controls that lower development feasibility, limit choice or impose costs that outweigh their benefits, such as maximum floor-space ratios or minimum car parking requirements.’
- In a related item, the NSW Productivity and Equality Commission estimates that it now costs more than $1 million to build a typical mid-rise apartment in Sydney. And construction projects are only commercially viable (‘feasible’) when the sale price covers construction costs plus profit. Unfortunately, while building new homes is still highly feasible in some Sydney suburbs (in the east, north and inner suburbs), planning rules have historically stopped homes being built here. The Commission reckons that allowing further upzoning for higher density developments in these areas could unlock ‘thousands of buildable homes.’
- Also related, the e61 Institute examines the impact of local land use reform.
- The Policy Institute makes a case for better means testing for government support programs, including the Child Care Subsidy, Parental Leave Pay, Aged Care, and the Age Pension.
- The Grattan Institute offers more thoughts on Australia’s gas reservation scheme.
- A view on what is wrong with the Petroleum Resource Rent Tax (PRRT)?
- The ABS offers seven interesting stats on Australian marriage and divorce in 2025.
- The AFR’s economics and deputy economics editors warn that Australia risks repeating Britain’s two decades of stagnation. As they acknowledge, the parallels are far from exact: Australia is buffered from commodity price shocks in a way that the UK is not, and partly as a result, also has far more fiscal space to play with. Still, it is useful to keep in mind that many advanced economies (and not just the UK) currently face a similar mix of problems including inflationary pressures, sluggish growth, and budgetary pressures amid rising discontent with established political parties. Despite significant differences in cross-country experience, there are also enough similarities to suggest some broader trends are in play alongside national policy choices (without downplaying the role of the latter).
- As US borrowing costs hit their highest level since 2007, has US Fed Chair Kevin Warsh just delivered a central bank credibility shock? (FT, WSJ)
- From the WSJ, a look at the implications of China’s recently demonstrated ability to flex its oil consumption: the country slashed its imports of crude oil by 40% in response to the first phase of the Iran war. An exceptionally large stockpile, electrification and a renewable energy buildout are all parts of the story.
- In this context, this April 2026 FT visual story on how US energy supremacy is being forged by war is also worth revisiting.
- Also from the FT, a new Big Read on Japan’s economy as it emerges from a generation of deflation.
- The IMF analyses two economies at different ends of the size spectrum: the latest Article IV country report on Brazil and a selected issues paper on Climate change, macroeconomic risks and adaptation in the Solomon Islands.
- Also from the IMF, a new working paper on the Generalized Jevons Paradox and the future of energy.
- The Centre for Strategic & International Studies (CSIS) reckons that an extended conflict with Iran would test US interceptor inventories.
- Is bureaucracy an insurance policy against the economic damage from populism?
- The Economist magazine considers the geopolitics of air conditioning. A separate piece reviews the rise of the deserving rich.
- The Atlantic Council’s 2026 Freedom and Prosperity Indexes warns that global adherence to the rule of law has declined significantly since 2020 while political freedom more generally continues to fall across much of the world. Denmark tops this year’s Freedom rankings ahead of Luxembourg and Sweden while Norway ranks #1 on Prosperity, ahead of Denmark and Iceland. Australia is classed as enjoying high freedom (#8 out of 171 ranked countries) and high prosperity (#15 out of 171).
- The Pew Research Center highlights increasingly positive international views of China, particularly relative to the United States.
- A new BIS Bulletin looks at AI and the global economy and draws out the implications for central banks.
- History suggests labour shortages can (eventually) be good news for productivity growth.
- A brief history of the internet’s favourite scam (the 419 fraud).
- The Odd Lots podcast talks with Branko Milanovic on what will follow globalisation.
- The FT Economics Show asks whether China is catching up with the United States on AI.
- The New Bazaar podcast in conversation with Alvin Roth on Moral Economics and how we manage morally questionable and repugnant markets.
Latest news
Already a member?
Login to view this content