
This special edition of the Economic Weekly looks at Australians’ unhappiness with current economic conditions, where a breakdown in our growth performance and the (linked) inability of wages to keep pace with rising living costs are probably the most important forces at work. Potential consequences include greater pressure on the political status quo, which could in turn translate into greater unpredictability in future policy settings, along with more radical or unconventional policy choices that could exacerbate existing problems.
Last week brought the release of the 2026 edition of the annual Lowy Institute Poll. Two record-breaking results stood out.
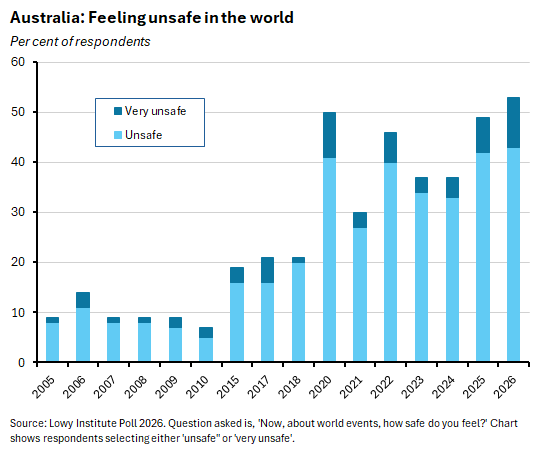
First, more than half of respondents (53%) reported feeling either ‘unsafe’ or ‘very unsafe’ in the world. That was the highest result for that question in the history of the series.
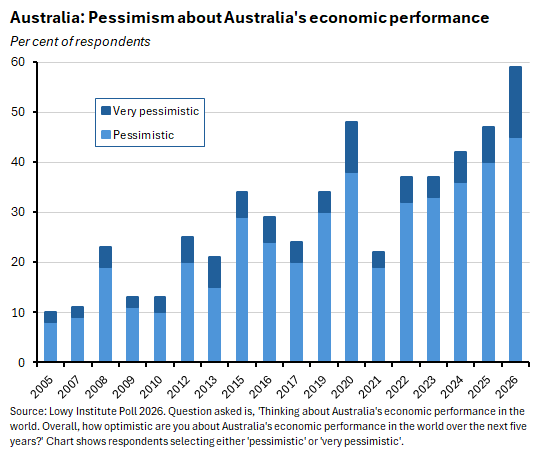
Second, almost six in ten Australians (59%) said they felt pessimistic about Australia’s economic performance. That share was up 12 percentage points from last year’s poll and marked another all-time high for the survey. On this measure at least, Australians report feeling worse about the economy than they did during the COVID pandemic and much worse than after the Global Financial Crisis.
According to Lowy, its polling shows that Australians have registered ‘historical levels of distrust and unease in 2026.’
Consumer sentiment is in the doldrums
That Australians are feeling unhappy will come as no surprise to anyone who has been tracking consumer confidence surveys. The June 2026 result for the Westpac-Melbourne Institute Consumer Sentiment Index was among the lowest in the series’ 50-year history, for example.
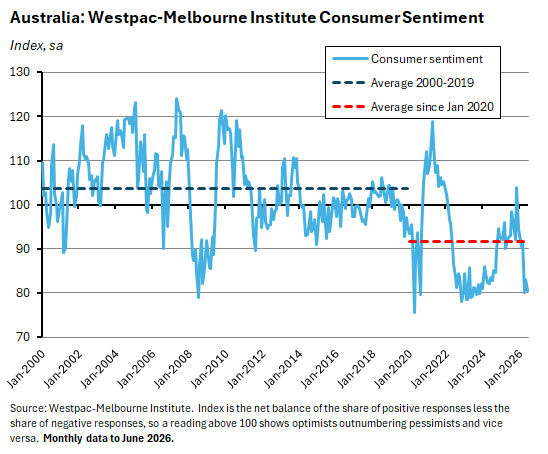
That slump in sentiment was driven by the impact of the war in the Middle East plus the three consecutive rate increases the RBA delivered between February and May this year.
But as well as recent developments, it also reflects a prolonged decline in consumer confidence that stretches across much of the current – turbulent – decade. Between January 2000 and December 2019, the monthly sentiment index averaged around 103.7, with optimists outnumbering pessimists. Since January 2020, the same index has averaged just 92, with pessimists very much in the ascendancy.
The COVID-19 pandemic, wars in Ukraine and the Persian Gulf, and other global shocks have clearly shaped Australians’ sense of insecurity — as reflected in the Lowy poll numbers. But geopolitics is only part of the story. A deterioration in key national economic indicators has also played a major role. While global shocks have pushed inflation higher and weighed on activity, Australia is also grappling with deeper structural pressures, including fading economic dynamism and a sustained cost-of-living squeeze.
Our economic model is failing to generate enough growth
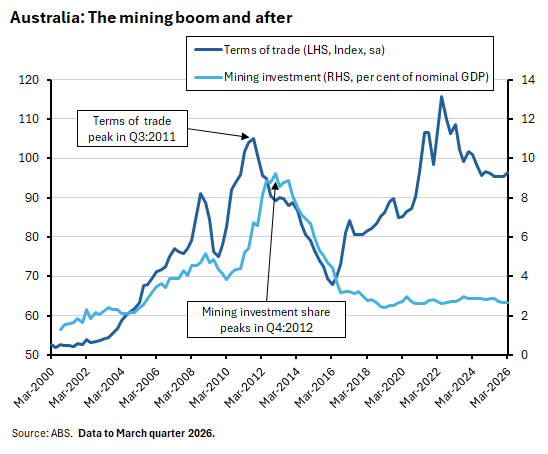
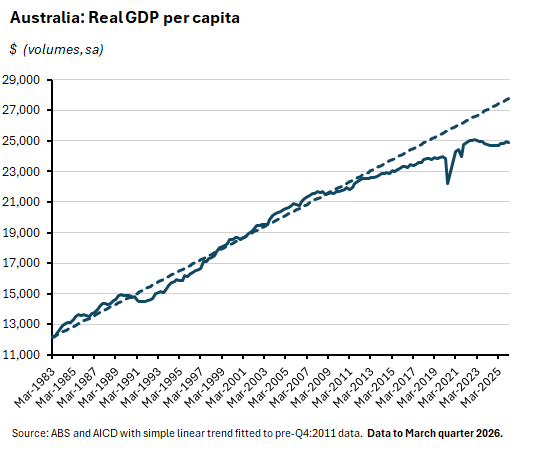
There are signs Australia’s growth model has run out of steam. Exactly when our growth engine began to stutter is debatable. But somewhere between the onset of the Global Financial Crisis and the arrival of the COVID-19 pandemic, economic dynamism started to wane. A plausible candidate for timing is around the end of the mining boom, marked either by Australia’s terms of trade peaking in the September quarter 2011 or by the mining (and business investment) shares of GDP peaking in the December quarter 2012.
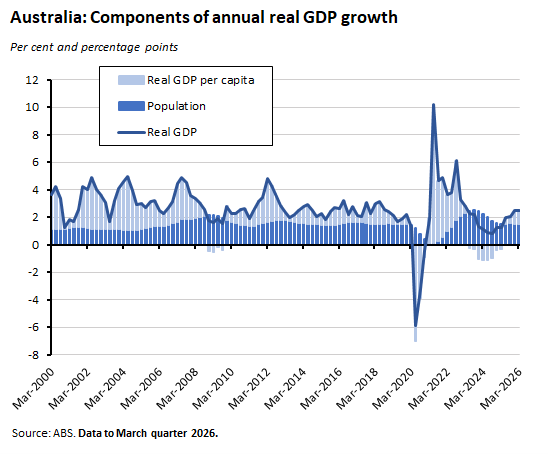
The result was that real GDP per capita started to shift onto a lower, flatter trajectory. Some significant fluctuations around the pandemic years complicated the picture a little but have been followed by another period of uninspiring performance. As a result, by the March quarter 2026, the gap between actual real GDP per capita and the level that would have been implied by a simple pre-Q4:2011 trend had widened to more than 10%.
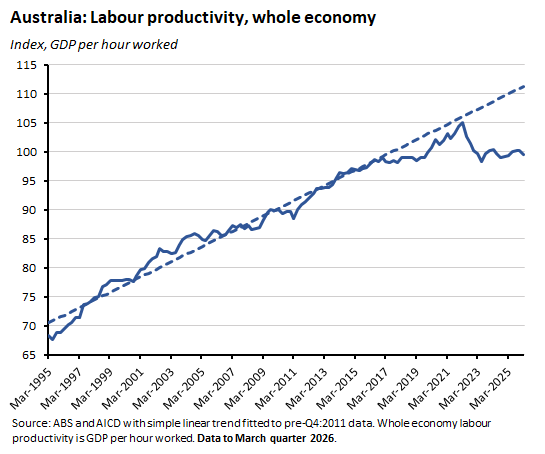
Helping to drive that faltering GDP per capita story has been a disappointing productivity performance. The current level of labour productivity (measured as GDP per hour worked) is little changed from where it was back in late 2016. Once again, COVID-19 knocked the numbers around a fair bit, but ultimately, the pandemic ‘productivity bubble’ proved short-lived.
A misfiring growth model brings with it a range of adverse effects:
- Lower labour productivity growth implies lower wage growth, all else equal.
- A mediocre supply side has lowered the economy’s speed limit, to the extent that the RBA now thinks we cannot manage much more than 2% real GDP growth before running into inflationary trouble and requiring the application of monetary policy brakes.
- Slower growth makes balancing fiscal sustainability against rising demands for public spending a more challenging task.
Even more fundamentally, as Benjamin Friedman argues in The moral consequences of economic growth, it seems likely that rising (as opposed to high) incomes play a vital role in sustaining open and democratic societies.
One notable side-effect of the slowdown in Australia’s per capita growth story has been the impact of slower GDP growth on voters’ views on the role of net overseas migration to sustain overall population growth. A growth model that – as it did in the past – combines high rates of migration-driven population growth with decent rates of growth in GDP per capita is, it turns out, a different political proposition to one where population growth has at times been accompanied by stagnating per capita growth.
Wages have failed to keep pace with the cost of living
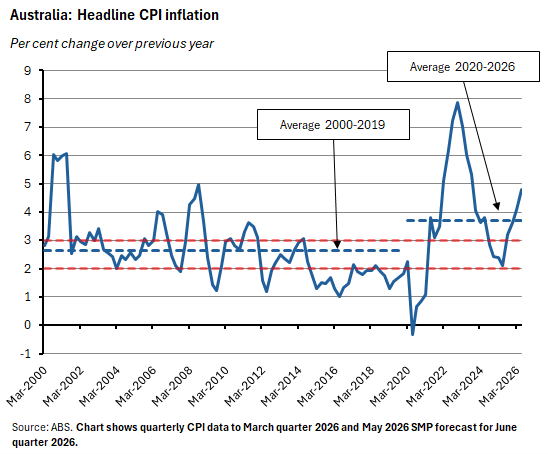
Australia is also suffering from a cost-of-living problem. Before the COVID-19 pandemic, Australia’s central bank was largely successful in keeping the headline rate of consumer price index (CPI) inflation within the target band of 2% to 3%. Between the March quarter 2000 and the December quarter 2019, for example, that measure of inflation averaged 2.6%, just above the band’s mid-point (although the RBA experienced some difficulty in meeting its inflation target from below between 2015 and 2019).
In contrast, since the March quarter 2020, headline inflation has averaged around 3.7%, partly due to a sequence of major adverse external shocks, and partly due to the economy’s struggling supply side.
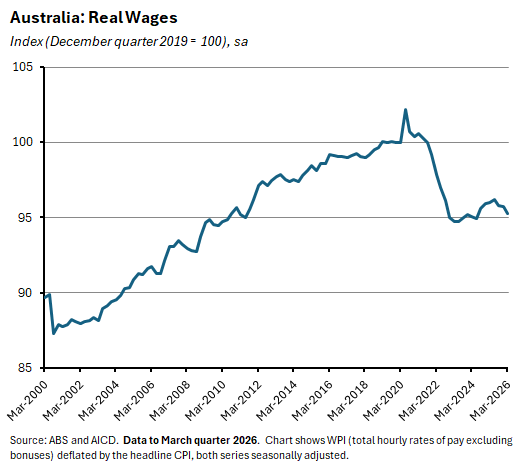
Nominal wage growth as measured by the ABS Wage Price Index (WPI) has struggled to keep pace with this higher inflation. As a result, by the March quarter of this year, wages in real terms were back at 2011 levels.
The cumulative growth in the WPI has failed to keep pace with the corresponding cost increases in a wide range of important items, from house prices and mortgage payments to insurance and medical and dental services, utility bills, and food and beverages. In many cases, the gap has been large.
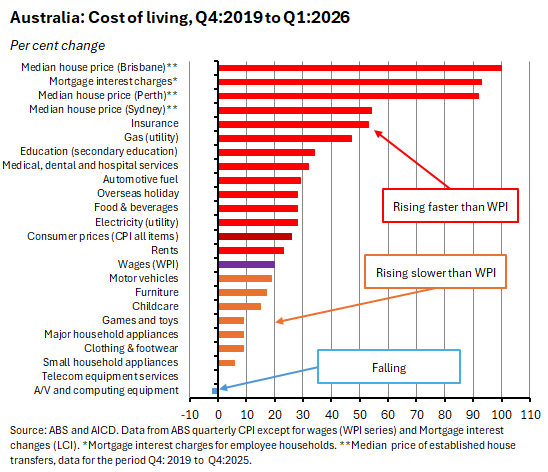
Granted, wage increases have kept ahead of price increases for a smaller subset of items, including household appliances, clothing and footwear, and furniture. Even so, this gain has not been large enough to offset the overall cost-of-living squeeze on households.
That said, do note that there are some important limitations in using the WPI to make these kinds of comparisons. By design, the index does not measure wage increases that workers achieve by securing a promotion or changing jobs, for example. So, in practice, Australians will have done a bit better than the WPI numbers imply.
What has happened to household incomes?
A look at the HILDA data on real household disposable incomes tells a broadly consistent story with the previous data: after growing strongly during the first decade of the current century (particularly between 2003 and 2009), income growth then stagnated for much of the next decade.
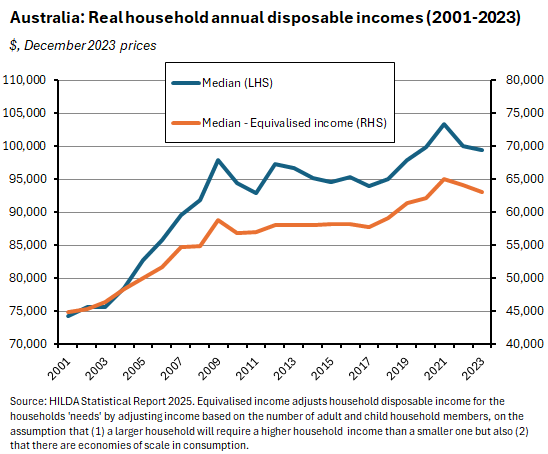
Household incomes did pick up briefly in the years immediately preceding the arrival of COVID-19 and were then given a further boost via increased government support payments that arrived in response to the pandemic. But they then fell back again.
Do shifts in income inequality change this picture? Not by much. Using the Gini coefficient – a measure of inequality that ranges from 0 (everyone has the same income) to 1 (one person has all the income) – shows that on this basis, measured inequality was relatively stable between 2001 and 2019.
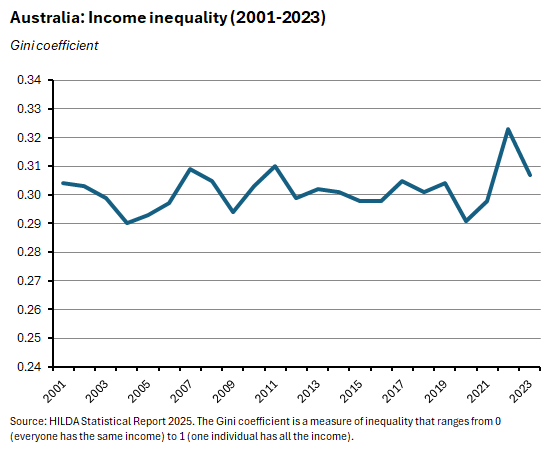
Once again, the pandemic does change things, with the onset of COVID-19 leading to a sharp drop in inequality. Once again, temporary government support payments were key, by boosting the incomes of low-income households. Then, as those support payments were withdrawn and the recovery saw faster growth in the income of high-income households, inequality rose again, climbing to the highest level in the history of the survey in 2022 before a partial retreat in 2023. (As best as we can tell, wealth inequality seems to have fallen over the initial COVID-19 period: once again, government support payments allowed poorer households to increase savings and pay down debts, while house price gains tended to be relatively greater in areas where price had been lower – in smaller cities and regional areas).
The role of unemployment is less important in explaining the current malaise
Before considering the political and policy implications of these changes, it is worth checking in on another key economic variable that we might expect to drive household sentiment – the unemployment rate.
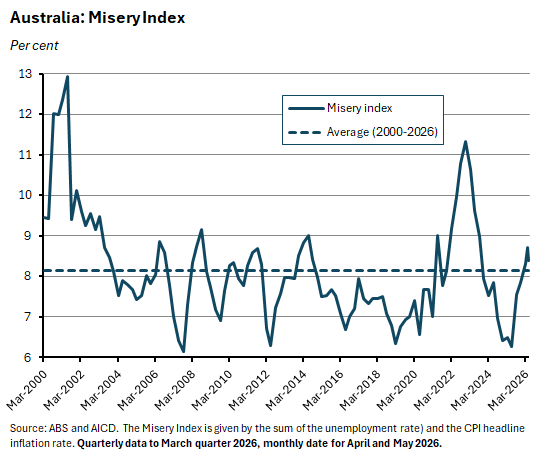
One longstanding measure of economic unhappiness is the so-called misery index which combines inflation and unemployment (and in some more recent versions also includes a measure of interest rates). Here, the data show that a simple version of the misery index has averaged a little above 8% since 2000. It is currently around 8.4% (a 4% inflation rate plus a 4.4% unemployment rate as of May 2026) which is above average, but when compared to the spikes in the early 2000s or around the pandemic, not dramatically elevated.
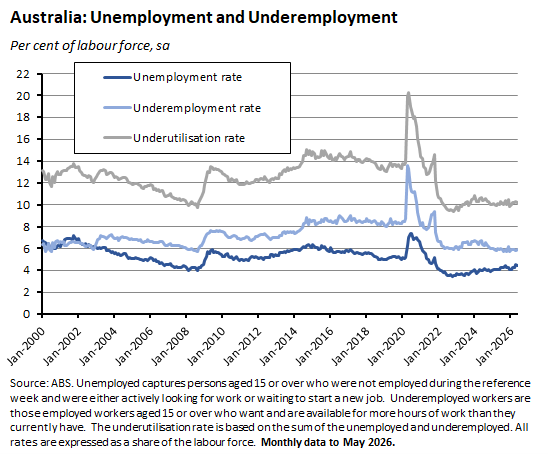
More specifically, the rate of joblessness does not look like an important driver of current aggregate unhappiness. Granted, the unemployment rate is currently a full percentage point higher than its October 2022 low of 3.4%. But even after that increase it remains subdued relative to pre-pandemic levels. And looking at the underemployment rate or combined underutilisation rate does not change the story much, either.
To be fair, it is possible that fears about future unemployment may be much higher than indicated by the current unemployment rate. Workers could be worried about AI-driven job losses in the years ahead, for example (according to that same Lowy survey cited above, many Australians – some 64% – now think that the potential risks of AI outweigh the potential benefits to society). And such fears could be weighing on sentiment.
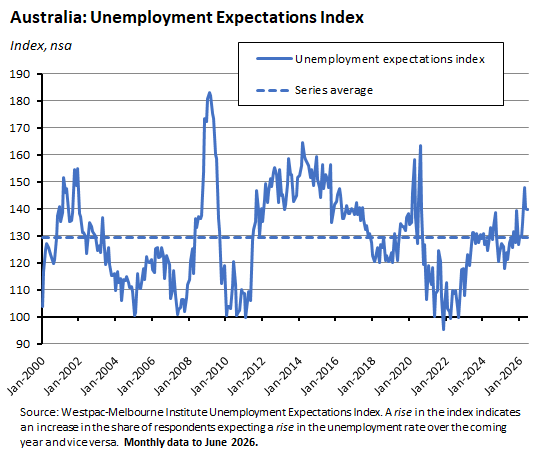
In this context, it is worth noting that the latest Westpac-Melbourne Institute Unemployment Expectations Index (for June this year) is above the series’ long-run average, indicating that workers are worried about a future rise in the unemployment rate. But the Index is still below where it was for a significant part of the pre-pandemic decade.
For now, at least, sub-par growth and elevated living costs seem to be more important than unemployment in explaining unhappiness with current economic conditions, with a crucial supporting role for the volatile global environment.
The political status quo looks vulnerable
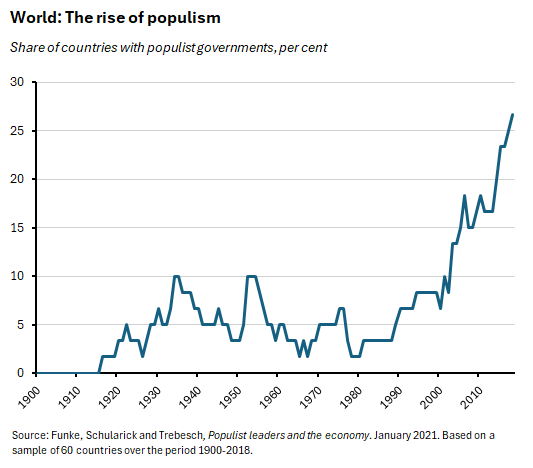
Rising economic discontent typically has political implications, and those in turn could have significant consequences for the nature of future economic policies. This is more likely to be the case given the possibility of cross-border contagion from an international environment already characterised by rising populism.
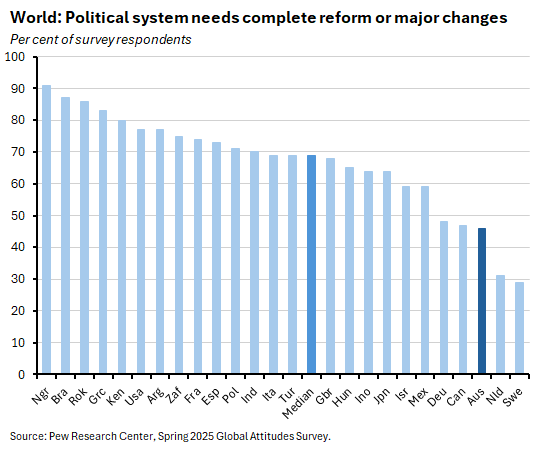
Until recently, the conventional wisdom was that Australia’s compulsory, preferential voting system would help shield us from this global trend. No doubt, there is some truth to that argument. Australian voters do seem less disenchanted with their political system than other electorates: according to one set of polling, the share of Australians suggesting that the political system needs either complete reform or major changes is lower than in many other countries.
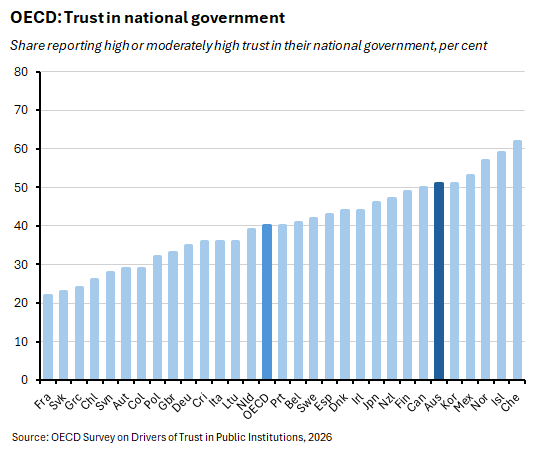
Likewise, according to the latest OECD Survey on Drivers of Trust in Public Institutions, the share of Australians reporting trust in the national government (51%) is well above the OECD average (40%).
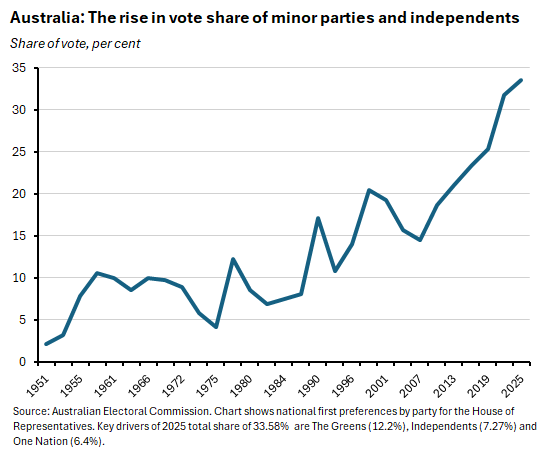
Still, some other indicators argue against complacency on the risks of political fallout. The share of Australians opting not to vote for one of the major political parties has been rising, for example.
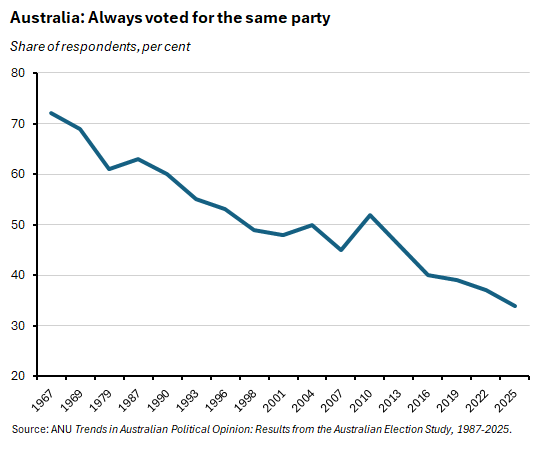
Likewise, the share of ‘rusted on’ voters has been in decline.
A more volatile and less ‘loyal’ voter base, a malfunctioning economic model, and sustained pressure on living costs create at least the potential for tectonic shifts in the political landscape.
One final thought. Populist parties do not necessarily need to secure an outright electoral victory to have a considerable influence on policy settings. For example, established parties might feel the need to respond to pressure on their left or right flanks from populist challengers by adjusting their own policies accordingly. Alternatively, greater political uncertainty or the risk of radical policy shifts in the future can unsettle business confidence or lift investors’ risk premia.
Since the evidence suggests that populist politics frequently impose economic costs, if policymakers prove unable to address Australia’s growth and cost-of-living challenges, the risk is that they will trigger political shifts and policy interventions that could serve to further exacerbate our existing problems.
Latest news
Already a member?
Login to view this content