
The Flash Australia Composite PMI fell for a second successive month in June, pulled down by COVID-19 restrictions in Victoria and supply-side strains. Even so, private sector activity continues to expand at a decent clip. Payroll jobs numbers fell 0.9 per cent over the fortnight to 5 June 2021 and were down 0.6 per cent over the past month.
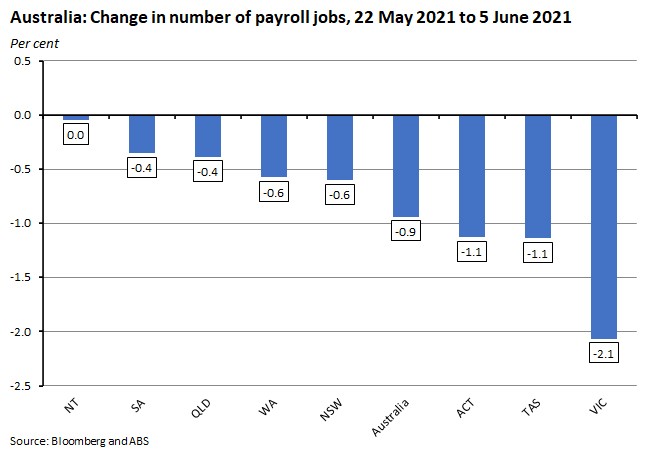
Victoria led the decline with a 2.1 per cent drop in job numbers over the past fortnight, reflecting the impact of the state lockdown, but there were decreases in every other state and territory except for the Northern Territory, where numbers were flat. The ABS said that preliminary retail turnover in May 2021 rose 0.1 per cent over the month to be up 7.4 per cent over the year, although once again there was some fallout from Victoria’s lockdown evident in the data. Preliminary estimates for merchandise trade for the same month showed Australia’s goods trade surplus and goods exports hitting new record highs, propelled by iron ore exports to China.
The ANZ Roy Morgan weekly index of Consumer Confidence rose 1.3 per cent to an index level of 112.4 for the week ending 19-20 June. The June 2021 Bloomberg survey of economists reported that the median forecast for Australian GDP growth this year has risen to five per cent, up from 4.5 per cent in the previous month’s survey. Australian Household wealth increased 4.3 per cent ($518 billion) over the March quarter of this year to a record $12,664.5 billion, with rising property prices driving much of the gain. Preliminary data for 2019-20 show how the early phase of the pandemic and the policy response have reshaped patterns of income, consumption and savings across Australia’s income distribution. New ABS statistics on tourism jobs indicate that although employment has recovered from the trough of the June quarter 2020, as of the March quarter this year the number of tourism filled jobs was still more than 80,000 down from its pre-COVID peak. More than 2.71 billion COVID-19 vaccinations have now been administered across 180 countries. At the current average daily rate, it will take another seven months to cover 75 per cent of the world’s population.
This week’s readings include June survey data on labour and skill shortages, a new national land account from the ABS, the RBA’s Luci Ellis on lessons and lasting effects of the pandemic, CBA economists predict the central bank will hike next year, possible economic consequences for Australia of a US-China clash over Taiwan, implications of the global vaccine gap, debt complacency, capitalism after COVID, the power of luck in business and more on the meritocracy debate.
Finally, stay up to date on the economic front with our AICD Dismal Science podcast.
What I’ve been following in Australia . . .
What happened:
The IHS Markit Flash Australia Composite PMI (pdf) slipped to 56.3 in June from 58 in May.
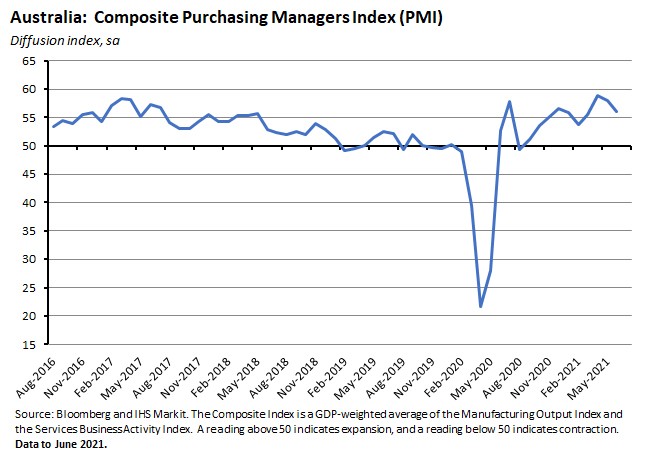
The composite index showed private sector output continuing to expand alongside new orders, with the slowdown in the pace of growth this month mainly reflecting heightened COVID-19 restrictions in Victoria and supply bottlenecks. The survey reported that demand growth slowed across both the manufacturing and service sectors, and for manufacturing export orders, although foreign demand for Australian services rose to its highest rate since April 2018.
According to the PMI, private sector employment continued to increase at a sharp rate in June, down only slightly from May’s record result, with respondents again reporting difficulties in securing skilled labour.
The survey also reported that input prices continue to rise rapidly, propelled by higher raw material and freight costs, albeit down from the record pace achieved in May. Growth in output prices likewise fell back slightly relative to the previous month, but also remained strong.
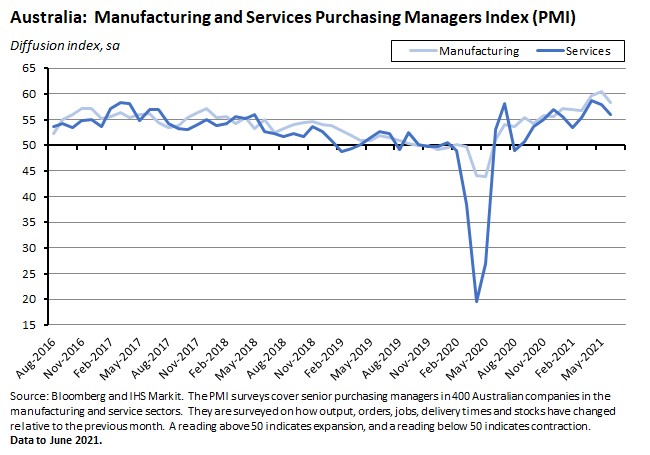
The IHS Markit Flash Services Business Activity Index fell to 56 in June, from a final reading of 58 in May while the IHS Markit Flash Manufacturing PMI fell to 58.4 in June from the survey record of 60.4 in May.
Why it matters:
There are three important takeaways from the June PMI readings.
First, despite some moderate easing in the reported pace of activity, the private sector continues to enjoy a strong performance overall. Although the Composite PMI has now dropped to a three-month low since hitting a high back in April this year, the index remains comfortably in expansionary territory, has been so for ten consecutive months, and at its current level is above the series average.
Second, survey respondents reported that Victoria’s COVID-19 restrictions had affected economic conditions and demand and had helped pull down the headline index.
Third, the PMI results continues to reflect problems on the supply side of the economy with reports of an increasing backlog of work, supply delays, and labour shortages (see also the latest ABS business survey discussed in the readings below, which provides more information on labour shortages). Likewise, although input and output price pressures both eased relative to last month, the rate of price increase remains elevated.
What happened:
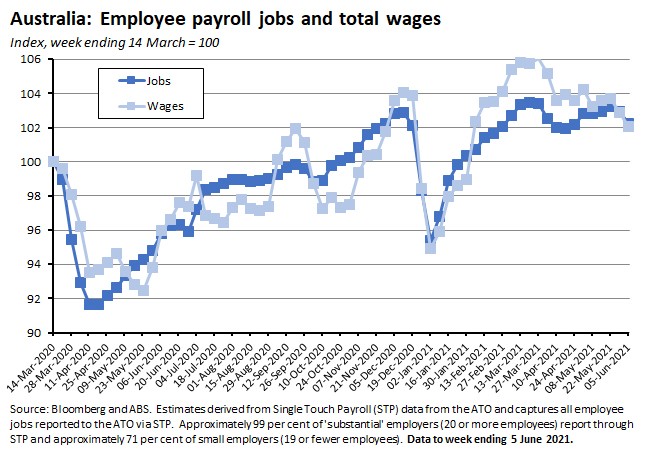
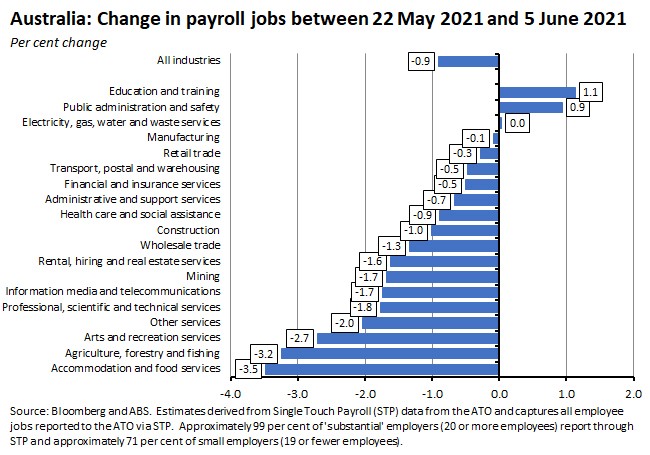
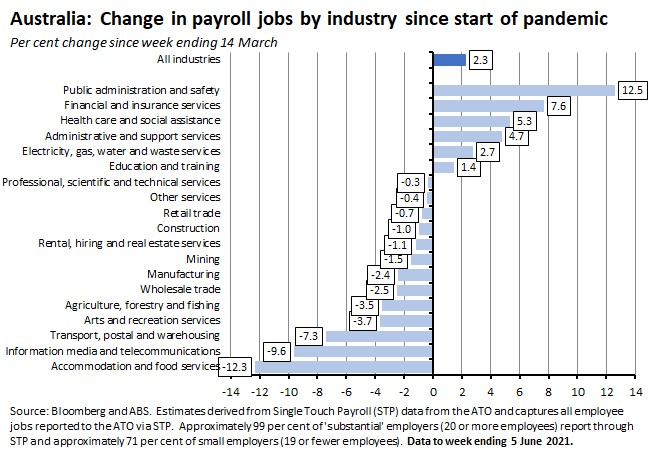
According to the ABS, between the weeks ending 22 May 2021 and 5 June 2021 the number of payroll jobs decreased by 0.9 per cent while total wages paid fell 1.6 per cent. Over the previous fortnight, job numbers and wages paid had both risen by 0.4 per cent. In the period since the start of the pandemic (the week ending 14 March 2020), the number of payroll jobs has increased by 2.3 per cent.
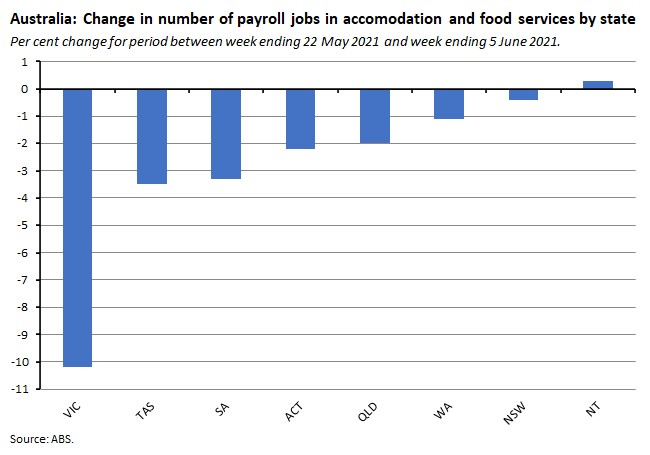
By state, over the past fortnight job numbers fell in every geography with the exception of the Northern Territory, where they were flat. The largest falls were in Victoria (down 2.1 per cent) and in Tasmania and the ACT (both down 1.1 per cent).
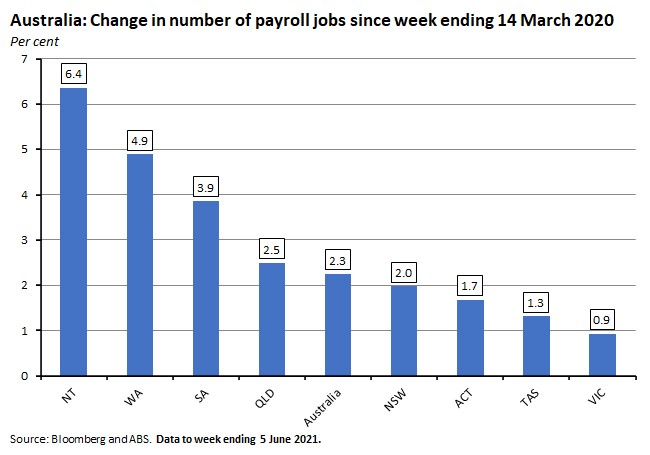
Since the start of the pandemic, all states have gained payroll jobs, with the increases ranging from a low of 0.9 per cent in Victoria to a high of 6.4 per cent in the Northern Territory.
By industry, job number fell in 16 out of 19 industries over the past fortnight, with the largest declines in accommodation and food services (down 3.5 per cent), agriculture, forestry and fishing (down 3.2 per cent – likely reflecting seasonal effects), arts and recreation services (down 2.7 per cent) and other services (down two per cent).
Since the start of the pandemic, payroll job numbers remain significantly down in accommodation and food services (12.3 per cent below their pre-pandemic level), information, media and telecommunications (down 9.6 per cent) and transport, postal and warehousing (down 7.3 per cent). The biggest job increases over the same period have been in public administration and safety services (where jobs numbers are up more than 12 per cent), financial and insurance services, and health care and social assistance services.
By demographics, the number of jobs worked by males has now fallen back below pre-pandemic levels, while the number of jobs worked by females is up 1.8 per cent.
Why it matters:Payroll job numbers have fallen by 0.6 per cent over the month since 8 May 2021 and are down 0.9 per cent over the past fortnight. The decline in job numbers was led by Victoria, with the latest fortnight of data partly overlapping with the first nine days of the state lockdown, and with the ABS noting that almost every industry in Victoria saw a fall in payroll jobs over the past two weeks. The largest falls were seen in accommodation and food services (down more than ten per cent), and in arts and recreation services (down eight per cent).The Bureau also pointed out that each lockdown has tended to generate an outsized fall in accommodation and food services jobs, with that sector particularly vulnerable to public health restrictions, and that while the fall in jobs in this industry has typically been largest in the state directly impacted by the lockdown, there are also signs of spillover effects (perhaps via interstate travel and tourism) into the same industry in other states and territories.
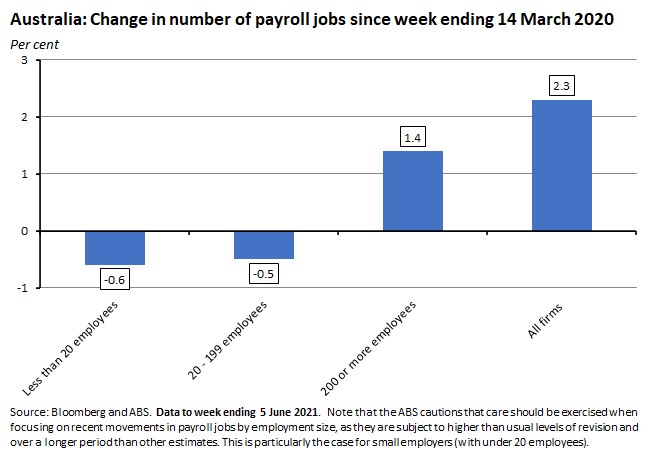
Finally, after the previous payroll jobs release, we noted that job numbers had returned to pre-pandemic levels not just at the aggregate level but also across all demographics and all firm sizes. As of this latest data release, that claim no longer holds, with job numbers now down again for male workers and for small and medium sized employers.
What happened:
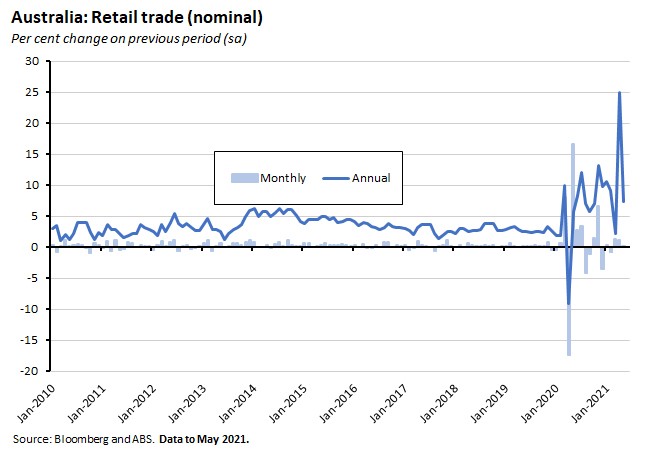
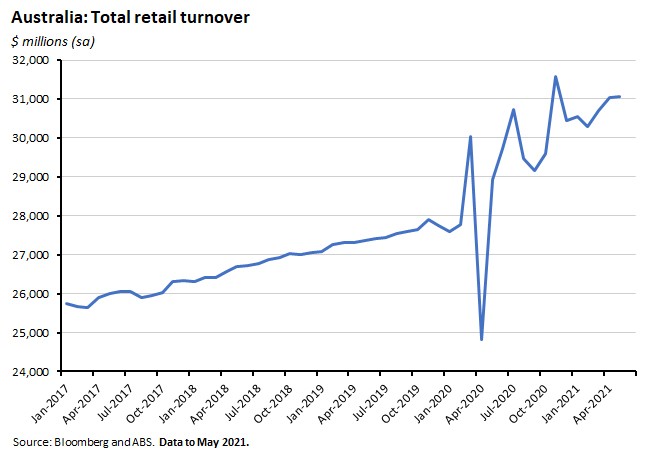
The ABS said that preliminary retail turnover in May 2021 rose 0.1 per cent over the month (seasonally adjusted) to be up 7.4 per cent over the year. (The preliminary estimate of retail turnover is based on data provided by businesses that make-up approximately 80 per cent of total retail turnover and is therefore subject to revision. The final monthly estimate will be published on 5 July 2021.)
At the industry level, the Bureau said that food retailing (up 1.5 per cent) led the rises over the month, but that this was offset by falls in household goods (down one per cent) and in clothing, footwear and personal accessory retailing (down 1.5 per cent).
By state, COVID-19 restrictions led to a fall of 1.5 per cent in retail turnover in Victora as well as declines in five of the six industries, with food retailing the only exception. In both Queensland and Western Australia turnover rose by 1.5 per cent.
Why it matters:
The market consensus had expected a 0.4 per cent monthly increase, so the May outcome came in weaker than anticipated, dragged down by the impact of Victoria’s fourth lockdown, which started on 28 May and which included restrictions on trade for physical stores. Even so, the impact on the national outcome was offset by growth elsewhere in the national economy. That allowed a modest rise in turnover across the month, albeit one that was well down on the 1.5 per cent month-on-month gain recorded in April.
What happened:
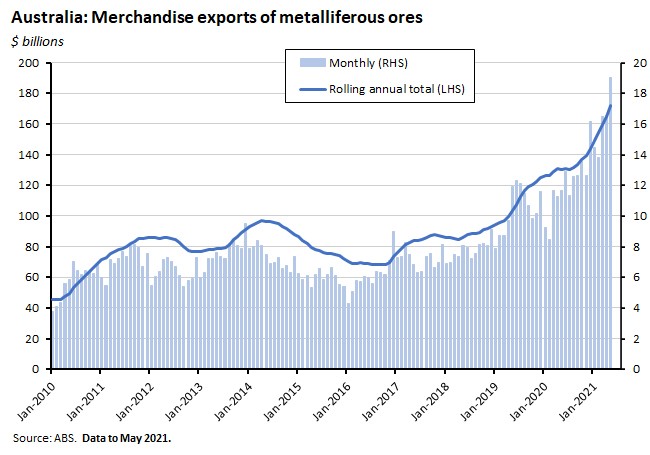
The ABS reported that preliminary estimates for merchandise trade in May 2021 showed exports of goods up 11 per cent or $3.8 billion over the month to $39.2 billion and goods imports up $0.1 billion to $25.9 billion. In annual terms, export growth was 34 per cent and import growth was 17 per cent. The merchandise trade surplus was $13.3 billion (original terms) last month.
The increase in goods exports last month was led by a 15 per cent ($2.5 billion) rise in exports of metalliferous ores.
On the import side of the trade account, the ABS noted that the value of imports of lithium-ion batteries exceeded $100 million for the first time last month while imports of electric vehicles also hit a new record high in May.
Why it matters:
Both goods exports and the merchandise trade surplus reached new record highs in May, as Australia’s trade performance continues to benefit from strong exports of metalliferous ores in general (a third consecutive monthly high) and exports of iron ore in particular (likewise a third consecutive monthly record). The latter rose by 18 per cent ($2.5 billion) last month and accounted for most of the overall increase in export values.
All of which also means that China continues to play a key role in our export story, despite the recent bout of bilateral trade tensions. Australian goods exports to China rose by 16 per cent ($2.3 billion) over May, largely reflecting a 20 per cent ($2.1 billion) jump in exports of iron ore to that market.
What happened:
The ANZ Roy Morgan weekly index of Consumer Confidence rose 1.3 per cent to an index level of 112.4 for the week ending 19-20 June.
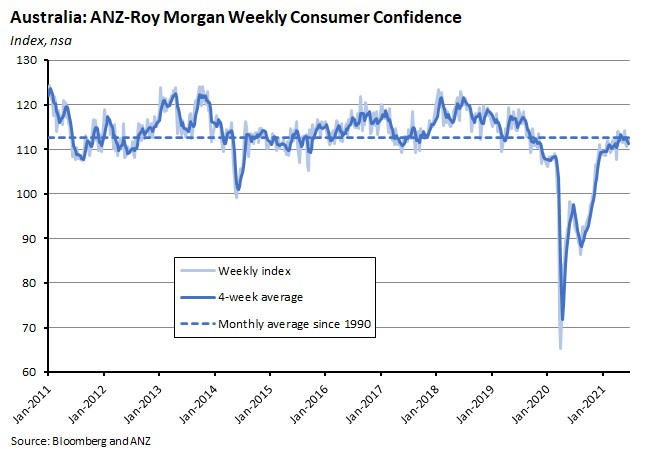
In terms of the subindices, ‘Current financial conditions’, ‘current economic conditions’ and ‘future economic conditions’ all increased over the week while there were declines for ‘future financial conditions’ and ‘time to buy a major household item.’
Why it matters:
As well as the easing of lockdown restrictions in Melbourne, ANZ Economics pointed to last week’s strong labour market result (which saw the unemployment rate return to a pre-pandemic 5.1 per cent) as likely the most important factors driving the increase in confidence over the week. For now, those positive developments have more than offset any drag from Sydney’s new COVID cluster, although the current index level remains a little below the long-run series average.
Also of note, the weekly inflation expectations index rose to 4.2 per cent, pushing the four-week moving average up to four per cent. This is the first time the average has hit four per cent since April 2020.
What happened:
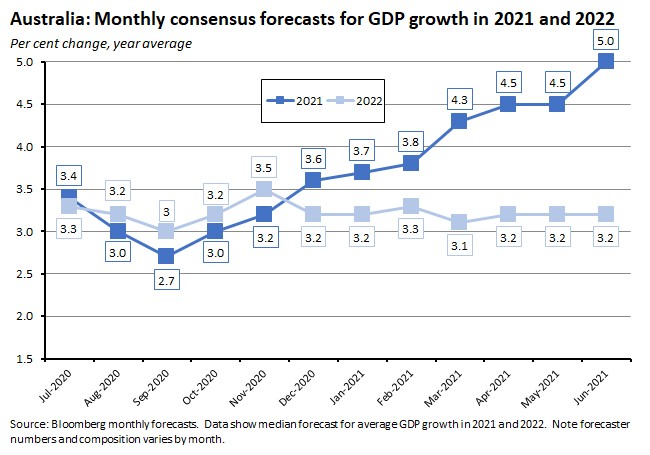
The June 2021 Bloomberg survey of economists reported that the median forecast for Australian GDP growth this year is now five per cent, up from the 4.5 per cent consensus view at the time of the May 2021 survey. The median growth forecast for GDP growth next year was unchanged at 3.2 per cent.
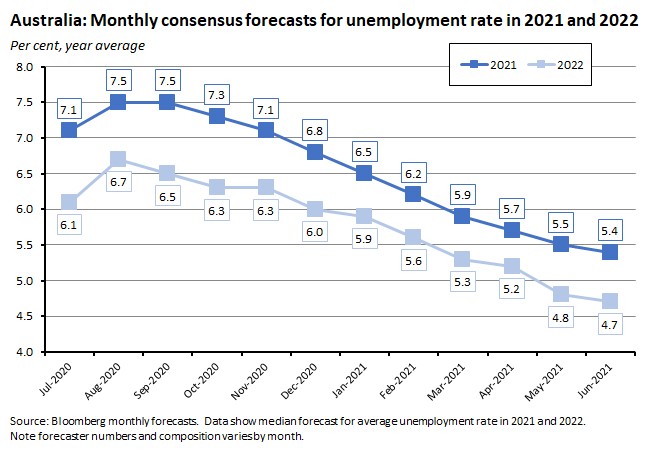
Economists have also continued to scale back their forecasts for the unemployment rate (which fell to 5.1 per cent last month). The median forecast for this year is now an average of 5.4 per cent, down from 5.5 per cent in May, and the unemployment rate is expected to drop to 4.9 per cent by the four quarter. Next year, the median forecast is for a 4.7 per cent unemployment rate.
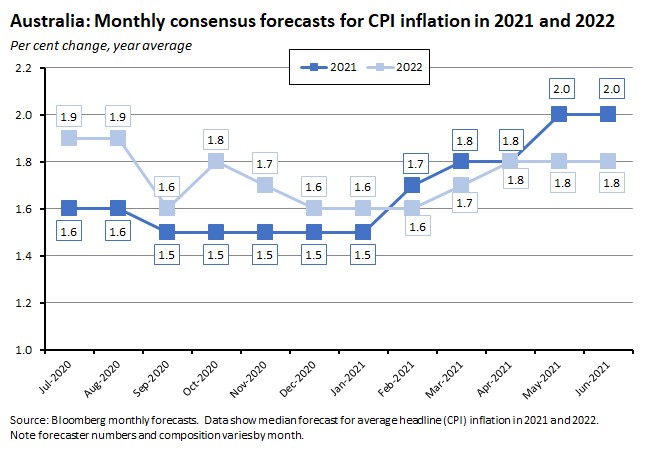
There were no changes to the median forecasts for inflation in 2021 and 2022 this month, with projections static at two per cent and 1.8 per cent, respectively.
Why it matters:
Forecasters have once again upgraded their views on the Australian economic outlook, with projections for GDP growth this year edging up relative to last month and projections for the unemployment rate edging down. There was no change to the median inflation forecast, however, despite the cost pressures recently reported by the PMI and NAB business surveys.
What happened:
The March quarter 2021 Australian National Accounts: Finance and Wealth showed Australian Household wealth rising 4.3 per cent ($518 billion) over the quarter and 15.3 per cent over the year to reach a record $12,664.5 billion. Wealth per capita also rose to a new record of $492,055 in Q1:2021.
The ABS said that non-financial assets owned by households increased 5.1 per cent ($434.9 billion), driven by a $434.6 billion rise in land and dwellings that was powered by rising property prices. At the same time, financial assets of households rose 1.8 per cent ($113.2 billion), reflecting a $75.6 billion rise in superannuation reserves and a $28.4 billion rise in shares and other equity. Overall, residential assets contributed 3.5 percentage points to the quarterly growth in household wealth in Q1:2021, followed by superannuation balances and directly held shares, with contributions of 0.6 and 0.2 percentage points, respectively. Property prices likewise accounted for 8.5 percentage points of the year-on-year growth rate, while superannuation balances contributed a further 4.1 percentage points.
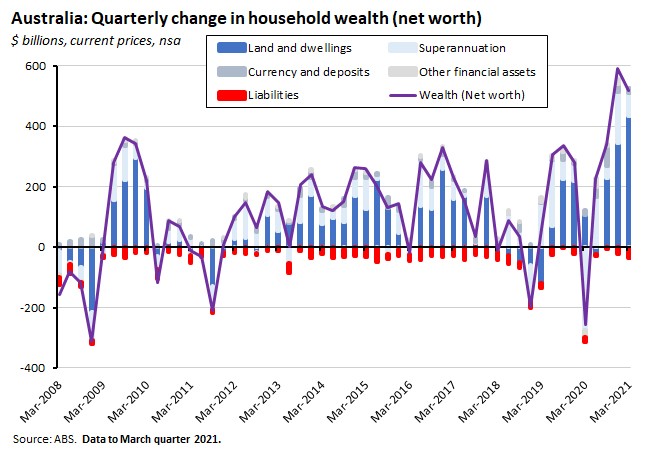
At the same time, household liabilities increased 1.2 per cent ($30 billion), driven by a $21.1 billion increase in housing loans, with owner-occupier loans up $20.7 billion.
Why it matters:
According to the ABS, household wealth grew more over the past year than it did over the three previous years combined, as rising residential property prices in particular continued to boost household balance sheets.
What happened:
Last Friday, the ABS released preliminary data on the distribution of household income, consumption and wealth in 2019-20.
Gross disposable income per household increased 3.5 per cent to $126,906 between 2017-18 and 2019-20 with the size of increase ranging from a high of 5.9 per cent for the lowest income quintile to a low of 1.4 per cent for the highest income quintile.
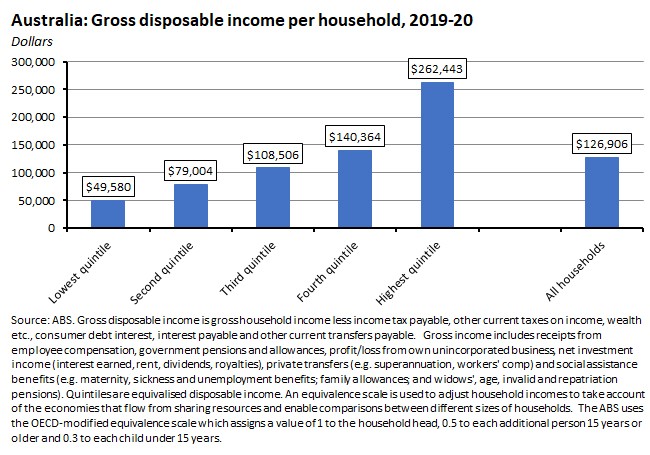
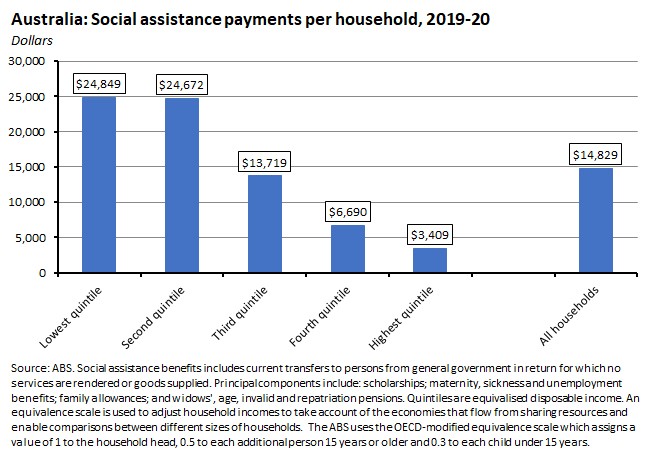
The data also provide a breakdown in distribution across households. In 2019-20, the lowest quintile of households received just 3.1 per cent of total compensation paid to employees, for example, but 34.9 per cent of all social assistance benefits. These households accounted for just 7.2 per cent of total gross income, 8.1 per cent of gross disposable income and 11.8 per cent of adjusted disposable income. At the opposite end of the income distribution, the top quintile received 45.8 per cent of employee compensation but also contributed 58.8 per cent of income tax payable and 51.6 per cent of total income payable. The top quintile’s share of gross income was 43.2 per cent, its share of gross disposable income was 40.8 per cent and its share of adjusted disposable income was 35.2 per cent.

The impact of redistribution in the form of government policies and non-profit institutions serving households (delivered in the form of income tax, social assistance benefits and social transfers in kind), boosted the share of gross disposable income by almost eight percentage points for the lowest quintile and by six percentage points for the second lowest quintile while reducing the share of the top income quintile by more than 12 percentage points.

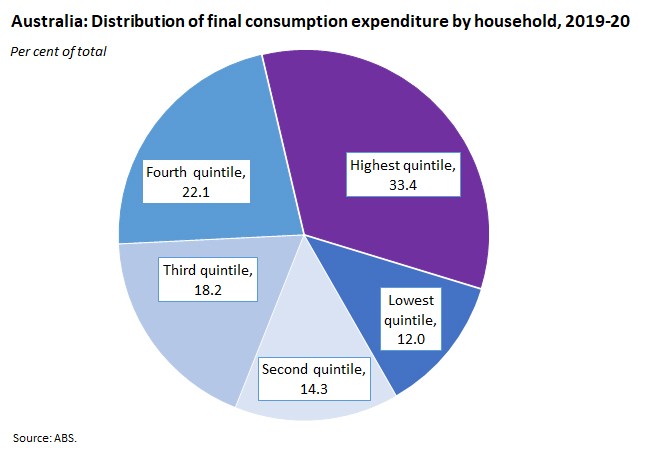
In 2019-20, final consumption expenditures (FCE) per household decreased 2.8 per cent to $100,396. The falls ranged from a 1.9 per cent decline in FCE for the lowest income quintile up to a 3.5 per cent drop for the highest income quintile. This was the first decrease in FCE per household in the history of the series.
At the same time, total FCE for all households rose by 2.3 per cent between 2017-18 and 2019-20, marking the smallest increase in the history of the series. After these changes, the top quintile still accounted for 33.4 per cent of total FCE, compared to a 12 per cent share for the bottom quintile.
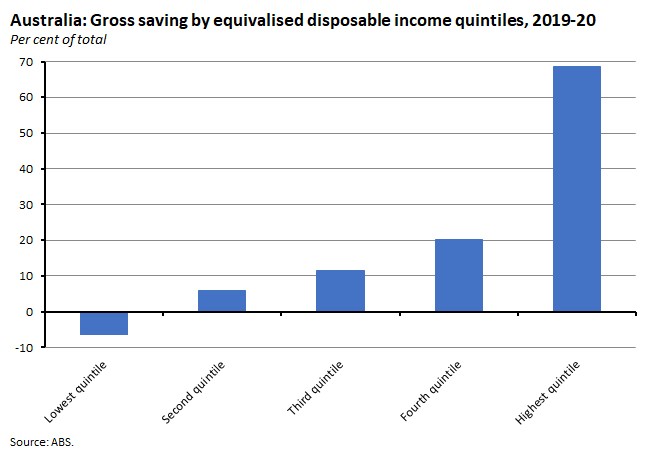
Finally, gross saving per household increased 37 per cent between 2017-18 and 2019-20. The biggest percentage increase here came in the second quintile, where savings jumped by more than 274 per cent. That was followed by a 95.6 per cent increase in savings for the third income quintile and a 47.7 per cent increase for the fourth quintile. Gains at the bottom (up 32.3 per cent) and at the top (up 12 per cent) were also significant, but smaller in percentage terms. The share of the highest quintile in gross savings across households was 68.6 per cent in 2019-20 while the lowest quintile remained in a dissaving position overall, despite the marked increase in savings.
Why it matters:
As well as providing a preliminary update on the distribution of income, consumption and savings across Australian households, the new ABS data offer some initial insights into how the pandemic – and in particular the subsequent policy response – have shaped those same variables over the first months of COVID-19.
Start, for example, with gross disposable income where the largest growth rates over the 2017-18 to 2019-20 period were enjoyed by the lowest income quintile, and where all three of the lowest quintiles enjoyed income growth in excess of five per cent. For the lowest and second lowest quintiles, that income growth was mainly the product of increased social assistance benefits, driven by the government’s COVID-19 support payments. The ABS noted that the majority of new benefit recipients and people eligible for the initial economic support payment (a one off $750 payment) and the coronavirus supplement (an additional $550 payment) were in households in the lowest, second or third income quintiles. Support payments also boosted disposable income for the third and fourth quintiles, although compensation of employees was the major driver of growth for the top three quintiles.
That shift in income performance also partially reversed the large gains previously enjoyed by the top quintile in terms of its share of disposable income. Over the period 2003-04 to 2017-18, the share of the lowest quintile in total gross disposable income edged up by 0.1 percentage points while the share of the top quintile jumped by 3.3 percentage points. The shares of the second (down 0.6 percentage points), third (down one percentage point) and fourth (down 1.6 percentage points) quintiles all declined over the same period. But between 2017-18 and 2019-20, the impact of government policies in response to the pandemic boosted the share of the bottom quintile by another 0.1 percentage points, the second quintile by 0.2 percentage points and the third quintile by 0.3 percentage points. There was no change in the share of the fourth quintile, while the highest quintile’s share of gross disposable income fell by 0.8 percentage points.

The impact of the pandemic is also apparent in FCE, where consumption spending per household fell across all quintiles. Although consumption fell across goods and services, the largest declines in spending were on services, and driven in particular by drops in spending on hotels, cafes and restaurants, transport services, and recreation and culture. Spending on these categories is relatively more skewed by income distribution: the top quintile of households accounts for 38.3 per cent spending on hotels, cafes and restaurants, 33.1 per cent of spending on transport and 34.2 per cent of spending on recreation and culture, for example, while the corresponding shares for the bottom quintile are 8.2 per cent, 11.6 per cent and 9.6 per cent, respectively. (In contrast, in the case of food the top quintile accounts for 25 per cent of expenditure vs 16 per cent for the bottom quintile). The combined impact of income developments and shifts in spending patterns mean that between 2017-18 and 2019-20, the share of total FCE for the fourth and highest quintiles declined while there was a rise in share for the lowest, second, and third quintiles.
Finally, in the case of saving, the aggregate increase in savings across all households (up a little more than 44 per cent between 2017-18 and 2019-20) reflected the fall in household spending due to COVID-19 restrictions combined with moderate growth in gross disposable income. For households in the lowest and second lowest income quintiles, again it was the increase in social assistance benefits due to government COVID-19 support payments that mainly drove household income growth, and that also contributed to growth for the third quintile. That allowed big increases in savings across the lower quintiles which saw the share of total gross saving for the highest quintile declined to its lowest share in history of the series in 2019-20. Even so, the highest quintile remained the biggest saver and the most important contributor (15 percentage points) to the growth in total household gross saving.
What happened:
Last Friday, the ABS also published the Q1:2021 Tourism Satellite Accounts quarterly tourism labour statistics.
For the March quarter of this year, the ABS estimated that there were 662,700 tourism jobs, which was equivalent to 4.7 per cent of all filled jobs in the economy. That was up 0.5 per cent (3,100 jobs) from Q4:2020 but still down 5.1 per cent (35,500 jobs) from Q1:2020. The number of tourism jobs had peaked at 745,200 in December 2019 before falling to just 606,500 in June 2020, the lowest level since June 2013.
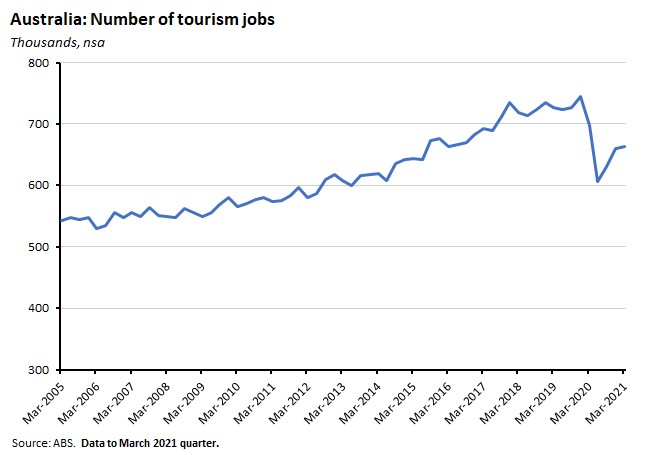
The current quarterly total is down 11.1 per cent (or down 82,500 jobs) from that Q4:2019 peak, which means that there has been a 40.5 per cent recovery of total tourism jobs lost between the peak and the trough.
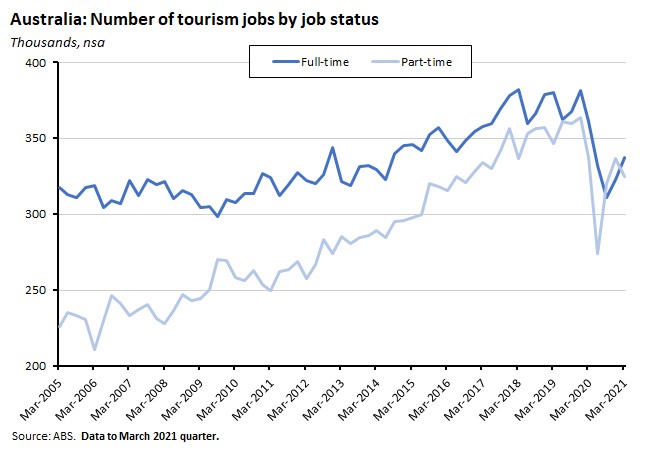
The ABS also noted that developments in the number of full-time and part-time tourism jobs has shifted across the course of the pandemic. In the initial phase of COVID-19 restrictions, part-time tourism jobs bore the brunt of the losses but these rebounded across the second half of 2020 as domestic travel resumed before falling away again in early 2021 as full-time jobs continued to return.
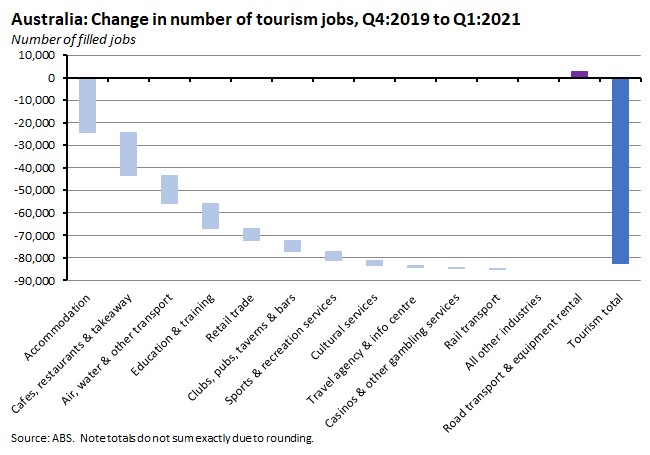
By industry, the biggest job losses over the entire period (Q4:2019 to Q1:2021) in absolute terms have been in accommodation (down 24,400 jobs), cafes, restaurants and takeaway food services (down 18,900), air, water and other transport (down 12,400) and education and training (down 11,100).
Why it matters:
Last week’s labour market report showed the unemployment rate back down to a pre-pandemic rate of 5.1 per cent and the number of employed up at more than 13.1 million persons, reinforcing the message of a V-shaped labour market recovery. The tourism data serve as a reminder that – while impressive that recovery has not been even across sectors, and that in areas that remain exposed to the impact of the pandemic, job losses remain substantial: the number of tourism jobs is still more than 80,000 down from its pre-COVID peak.
. . . and what I’ve been following in the global economy.
What happened:
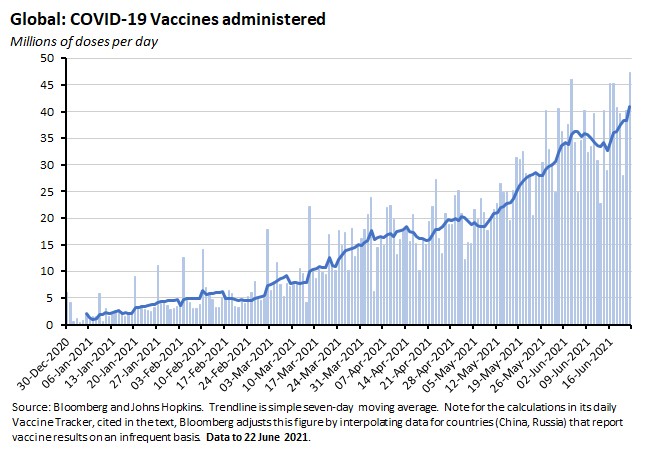
According to the Bloomberg Global Vaccine Tracker, more than 2.71 billion COVID-19 vaccinations have now been given across 180 countries. That puts the daily average global vaccination rate at a bit above 41,718,000 doses. At this pace, it would take roughly another seven months to cover 75 per cent of the world’s population.
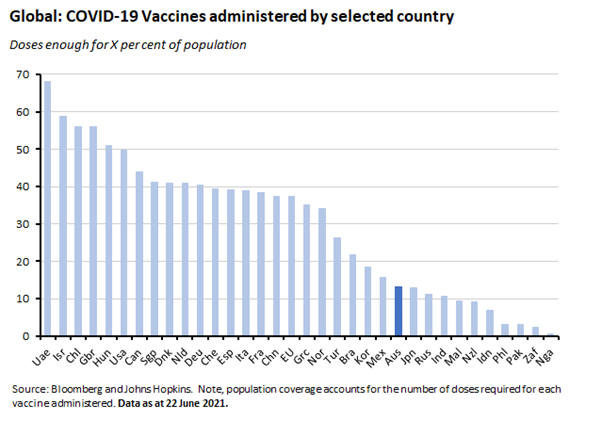
Country vaccine coverage continues to diverge quite significantly.
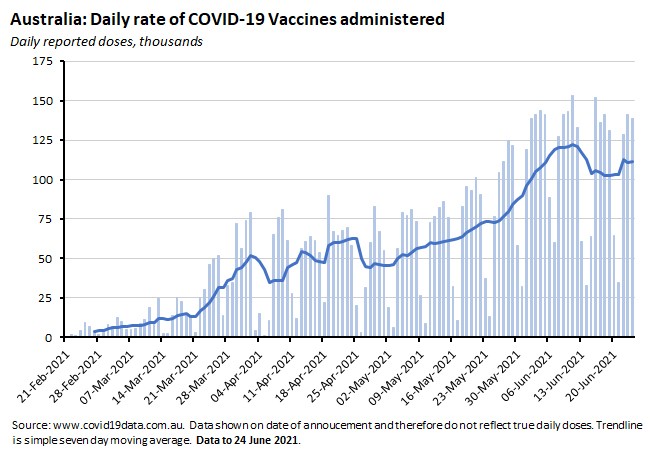
Here in Australia, vaccine trackers put total administered vaccinations at around seven million and the seven-day rolling average at more than 111,000 doses per day, implying a time to vaccinate of a bit less than ten months (for 40 million doses) or a bit more than 11 months (for 45 million doses).
Why it matters:
A successful global rollout of COVID-19 vaccinations continues to underpin forecasts of a sustained global economic recovery, and the pace of that vaccine rollout continues to accelerate. By way of comparison, at the end of May the average daily vaccination rate was 29.8 million doses with an estimated time to 75 per cent vaccination coverage of 11 months.
Enough vaccines have now been deployed to fully vaccinate almost 18 per cent of the global population, although as noted above, in practice the distribution of coverage remains highly uneven across countries, with Bloomberg estimating that countries and regions with the highest incomes are currently getting vaccinated more than 30 times faster than those with the lowest. See this week’s readings (below) for more on the economic implications of the global vaccination gap.
What I’ve been reading . . .
The final ABS Business Conditions and Sentiment Survey provides some interesting data on staff shortages. According to the survey, 19 per cent of businesses reported that they did not have enough staff based on current operations, up from 12 per cent in March this year and 15 per cent last December. Businesses in construction (29 per cent) and retail (27 per cent) were the most impacted. Of the 19 per of businesses with an insufficient number of employees, the most common constraints cited included an inability to find suitable staff (57 per cent), the affordability of additional staff (48 per cent), uncertainty due to COVID-19 (42 per cent), the availability of existing employees to work (34 per cent), domestic border closures (19 per cent), difficulty retaining staff (19 per cent), and international border closures (18 per cent). The same survey also found that 27 per cent of all employing businesses reported that they were having difficulty finding suitable staff to fill jobs. Businesses in accommodation and food services (38 per cent) were the most likely to report they were having difficulty finding suitable staff, followed by businesses in the utilities sector (37 per cent), other services (36 per cent) and manufacturing (35 per cent). Key factors according to respondents included a lack of applicants (74 per cent), a lack of required skills or qualifications (66 per cent), international border closures (32 per cent) and job location (29 per cent).
The ABS also released the first edition of the National Land Account, which provides preliminary data on land cover, land use, land tenure and monetary land assets. For example, the Bureau estimates that the value of land increased 32.6 per cent to $5,124 billion dollars between 2010-11 and 2015-16. As of 30 June 2016, that land value comprised $4,169.6 billion (81.4 per cent) in residential land, $430.0 billion (8.4 per cent) in commercial, $270.8 billion (5.3 per cent) in rural, and $253.7 billion (five per cent) in government. NSW accounted for 39.1 per cent of the total land value for Australia but only 10.4 per cent of the land area.
And one more from the Bureau, a new chart pack on casual employment.
RBA Assistant Governor (Economic) Luci Ellis spoke on lessons and lasting effects of the pandemic. She highlighted three lessons and several lasting effects. Starting with the lessons:
- First, following a big shift, people adapt.In the context of the pandemic, one important implication has been that successive lockdowns have been less economically damaging as firms and workers have adjusted.Another example has been the shift in spending from services to goods which has supported activity (including goods trade) albeit at the cost of some supply bottlenecks.
- Second, post-crisis, people bounce back.Once the public health situation allows, people have generally been quick to return to activities that were previously subject to restrictions.That has allowed for a relatively rapid recovery.
- Third, people respond to policy support.Governments have provided considerably more policy support than was typically the case in previous downturns, such that Australian household disposable income actually rose during the COVID crisis.
- Finally, Ellis pointed to potentially lasting effects in terms of where we work (more remote work), how we work (more online work) and – as a consequence – where we live.
CBA Economists think that the RBA will start hiking the cash rate late next year.
David Uren on the economic consequences for Australia of a US-China conflict over Taiwan. Note that Uren also discusses the differences between his analysis and the recent Productivity Commission report on vulnerable supply chains which reached relatively sanguine conclusions about Australia’s exposure to a disruption in international trade (albeit in a different context).
The Department of Industry has published a report on the outlook for selected critical minerals, covering rare earth elements, cobalt, graphite and vanadium. The report highlights that ‘a rapidly transitioning EV [electric vehicle] and battery storage sector is expected to see consumption outpace production’ and that Australia ‘is well placed to provide raw materials, and potentially refined, product to the world, given appropriate market conditions.’
Adam Triggs on fighting carbon with finance. Can regulators and investors combine to direct more money to ‘green’ loans and away from ‘brown’ ones?
A new working paper on the political economy of taxation. The starting point is that despite a relatively broad consensus among tax experts on the issues (‘an over-reliance on personal income taxes for revenue raising, unsustainable corporate tax settings, ineffective Goods and Services Tax…and underutilised state taxes’) plus multiple taxation reviews, un-Acted Bills and repealed legislation, actual progress on most of these issues has been very limited. That suggests the key challenge is not so much around the detail of reform, but rather understanding the political economy obstacles.
The Economist on economic implications of the global vaccine gap.
The June 2021 Edition of the IMF’s Finance & Development magazine includes Jim O’Neill looking back at 20 years of the BRICs, will the next oil supercycle be the last?, central banks and the distributional effects of monetary policy, and a primer on the search for yield.
Are policymakers too complacent about the risks of government debt?
Two columns from VoxEU. The first introduces a new e-book which offers the thoughts of 21 leading economists (including Atif Mian, Darron Acemoglu, Dani Rodrik and Philippe Aghion) on a post-pandemic world. The e-book itself, Capitalism after COVID, is available for free download. Second, three IMF analysts look at the potential for ESG investing to shift production incentives within a small set of ‘climate crucial firms’ (noting that just 96 firms located upstream in production chains reliant on carbon emissions (largely fossil fuel producers) have accounted for 70 per cent of global carbon emissions since 1850). Unfortunately, they argue that ‘ESG scores do not appear to capture differences in emissions growth across large emitters’ and that even based on their largest estimates, ‘the reduction in emissions associated with a hypothetical large collective improvement in ESG scores would do little to meaningfully help mitigate climate change.’
The World Bank’s June 2021 Global Economic Prospects. It includes special chapters on high trade costs and emerging inflation pressures.
In the FT, Gideon Rachman wonders whether China has broken the East Asian growth model.
The new SIPRI yearbook is out. Summary is here (pdf). Points of note include: Active armed conflicts occurred in at least 39 states in 2020; the estimated number of conflict-related fatalities in 2020 was approximately 120,000, a 30 per cent reduction since 2018; The impact of the pandemic on armed conflicts in 2020 was mixed: there were some temporary declines in armed violence, but the intensity of violence generally stayed at the same level and in some cases increased; World military expenditure is estimated at US$1,981 billion in 2020, 2.6 per cent higher than in 2019 and 9.3 per cent higher than in 2011. World military expenditure as a share of world GDP rose by 0.2 percentage points in 2020, to 2.4 per cent. This was the biggest increase since the 2009 GFC; The United States remains the world’s biggest spender on the military, spending US$778 billion in 2020 or more than the next seven great powers combined; China was the second largest spender at US$242 billion. Chinese spending has now risen for 26 consecutive years; At the start of 2021, nine states (the United States, Russia, UK, France, China, India, Pakistan, Israel and North Korea) together possessed approximately 13,080 nuclear weapons. Approximately 2000 of these are kept in a state of high operational alert.
Two longer pieces from the WSJ. The first looks at the increasingly important role played by retail investors in the US stock market. Individual investors’ share of US trading volumes hit 20 per cent last year, roughly double the share of a decade ago, and it has continued to rise into this year. The second examines the way in which a tight US labour market is altering the balance of power between workers and employers, leading to rapid growth in wages for the lower paid.
The Harvard Business Review on the power of luck in business.
Last time’s podcast linkage included Adrian Wooldridge on meritocracy. Wooldridge is a defender of the principle and has pushed back against some of the recent criticism. One prominent exponent of the latter has been Michael Sandel, recently a guest on the Jolly Swagman podcast.
Latest news
Already a member?
Login to view this content