
After disappointing (almost) everyone last month by voting to leave policy unchanged in a split decision, this week saw the RBA’s Monetary Policy Board (MPB) deliver a 25bp cut in the cash rate target to 3.6 per cent.
This time, the decision was unanimous. Cumulative monetary policy easing to date now stands at 75bp for the current cycle and the cash rate is back to H1:2023 levels. Based on revised forecasts in the August 2025 Statement on Monetary Policy (SMP), there should be some more modest easing to come, although Martin Place is likely to persist with its current cautious, gradual pace of adjustment.
In an interesting sign of the times and an indication of where current economic policy debate stands, a fair chunk of this week’s press conference was spent quizzing the Governor. Not on the rate cut itself, but rather on a decision to trim the central bank’s estimate of trend productivity growth, discussed in detail in the SMP. At one level, this change could be interpreted mainly as a technical decision by central bank staff to rectify a puzzle in the data and a discrepancy in their forecasts. This was pretty much the Governor’s take in her response to questions. But for many in her audience, it seemed to be a telling confirmation that even the RBA’s longstanding optimism on recovery in Australian productivity performance has now run out.
One issue that continues to exercise minds at Martin Place is the degree of spare capacity in the Australian labour market. In the days following the MPB decision, the ABS delivered two relevant updates. The first reported that the annual rate of wage growth (as measured by the Wage Price Index) was unchanged at 3.4 per cent in the June quarter of this year. That result was consistent with little change in the degree of labour market slack over the first half of this year. The July labour force report, which showed the unemployment rate falling back to 4.2 per cent from June’s 4.3 per cent outcome, delivered a similar message. Both results are likely to reinforce the central bank’s ongoing caution.
A couple of weeks back, we discussed the possibility of fiscal dominance. So it is worth noting that, since then, the nomination of Stephen Miran to fill an unexpected vacancy at the Federal Reserve has prompted a new bout of speculation about the implications for Fed independence.
Below we review the MPB’s decision, dig into accompanying SMP updated forecasts and analyse this week’s labour market numbers, along with a roundup of the rest of the week’s data releases, plus our usual linkage collection. This week, the latter is heavy on productivity and reform proposals in advance of next week’s Economic Reform Roundtable. As usual, if you’d like to see charts that accompany the analysis, please click through to read the web site version.
Finally, many thanks to all those Members who attended one of the recent roundtables and presentations during my visit to Perth last week. It was lovely to see so many of you in person.
RBA Monetary Policy Board (MPB) cuts cash rate target by 25bp
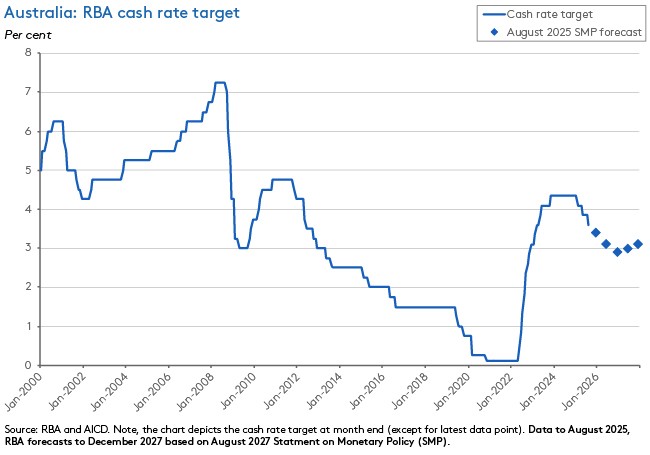
In a unanimous decision and as widely expected following the June quarter’s benign quarterly CPI reading, the MPB decided to cut the cash rate target by 25bp at the conclusion of its 11-12 August meeting this week. That took the cash rate target down to 3.6 per cent. It was last at that level in early 2023, before the RBA increased the policy rate from 3.6 per cent to 3.85 per cent at its 3 May meeting.
According to the accompanying statement, collectively members of the MPB are now feeling more comfortable about the state of the labour market and prospects for inflation than they were last month. According to the statement, MPB members noted the progress of underlying inflation towards the middle of the RBA’s two-to-three per cent target band, larger falls in the headline rate of inflation (albeit flattered by lower fuel prices and the temporary electricity rebates), and a slight easing in labour market conditions, taking the economy closer to what the RBA judges to be ‘full employment’.
‘With underlying inflation continuing to decline back towards the midpoint of the 2–3 per cent range and labour market conditions easing slightly, as expected, the Board judged that a further easing of monetary policy was appropriate.’
The messaging also sounded cautiously optimistic about the possibility for further rate cuts, noting (in the context of the RBA’s new forecasts discussed below) that:
‘Updated staff forecasts for the August meeting suggest that underlying inflation will continue to moderate to around the midpoint of the 2–3 per cent range, with the cash rate assumed to follow a gradual easing path.’
‘Cautiously’ remains an appropriate modifier for that optimism, with the statement highlighting familiar uncertainties around domestic and international developments, lags in the effects of monetary policy easing, firms’ pricing decisions, labour market conditions and weak productivity outcomes.
RBA new forecasts mainly show only modest changes
The August 2025 edition of the RBA’s Statement on Monetary Policy (SMP) updates central bank forecasts that were presented in May. Several months on and changes to the Australian economic outlook are mostly modest, although the RBA now expects the pace of recovery in activity to be somewhat weaker:
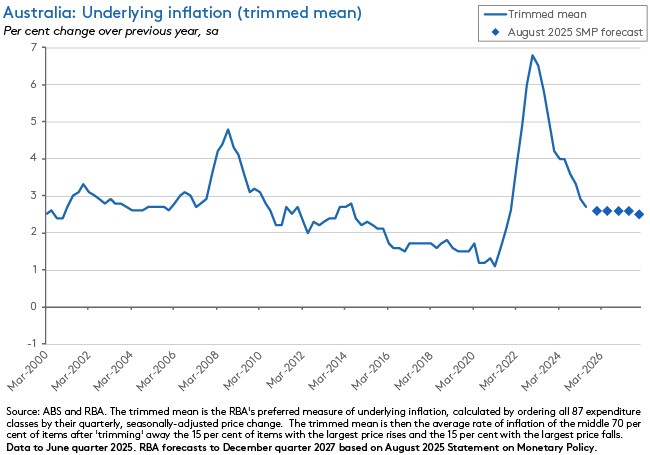
- The forecast for underlying (that is, trimmed mean) inflation is unchanged. The RBA still thinks it will run at a near-middle-of-the-target-band of 2.6 per cent through until almost the end of the forecast period, when it projects it to dip to 2.5 per cent. Likewise, the August SMP sees headline inflation broadly following the same trajectory as the May SMP, with a short-term bump upwards, due to the unwinding of temporary electricity rebates.
- Similarly, the outlook for the labour market is consistent with the RBA’s previous forecasts, with the unemployment rate expected to remain at 4.3 per cent over the forecast horizon.
- The outlook for real GDP is now a little softer than the RBA had expected in the May SMP, with the new forecasts anticipating a more gradual recovery, mainly due to weaker-than-expected public demand growth earlier this year. GDP growth in calendar year 2025 is now projected to be 1.6 per cent, down from 1.9 per cent in the May SMP. The RBA anticipates growth in 2026 to be slightly slower, at 2.1 per cent instead of 2.2 per cent.
- Underpinning these forecasts is the assumption of a gradual reduction in the cash rate target, to around 3.4 per cent by the December quarter, to 3.1 per cent by the June quarter of next year, and then down to a low of 2.9 per cent by the December quarter 2026 before returning to around three per cent. That trajectory is very slightly lower than the one presented in the May SMP, which had the cash rate bottoming out at around 3.2 per cent by the June quarter of next year.
One implication of this set of projections is that the cash rate is likely to decline further from here, albeit only gradually. A ‘terminal’ rate of around three per cent is still a decent central case, assuming no significant shocks or deviations from the RBA’s own baseline scenario. Or in the words of the SMP itself:
‘The cash rate path assumed in the forecasts settles at around three per cent and the forecasts suggest that this path is consistent with sustaining balance in the economy, although this assessment is uncertain.’
As is now usual in the SMP, the RBA highlights key judgements that underpin its projections and key risks. The August 2025 SMP highlights four key judgements:
- Australia’s trading partner growth will slow modestlythis year and then recover in the second half of next year, in line with a waning drag from higher tariffs and elevated uncertainty. In particular, the forecasts assume that the Chinese economy remains relatively resilient, growing at close to the official target of five per cent this year (4.9 per cent) and then slowing only slightly in 2026 and 2027.
- Global trade developments will be mildly disinflationary for Australia, with weaker growth created by higher tariffs exerting slight downward pressure on the price of imported goods and services.
- The economy will remain close to full employment over the forecast period, although there are some signs that labour market conditions remain tight (see also the review of this week’s labour market releases, below).
- The RBA’s downward revision to productivity growth (discussed in more detail below) implies a reduction in potential output growth but has no implications for the inflation outlook.
Then there are three key risks:
- Global growth could be weaker than forecast, for example if the adverse effects of tariffs and uncertainty on the world economy turn out to be larger than expected.
- There are two-sided risks to Australian economic activity: The forecast recovery could be either weaker or stronger than anticipated.
- There may be more excess demand in the domestic economy than the RBA expects – in particular if labour market conditions are tighter than implied by the SMP’s forecasts.
RBA downgrade to forecast productivity growth
As noted in the introduction, the issue that dominated many of the questions in the media conference that followed the cash rate announcement was not the interest rate decision itself, but rather chapter four in the SMP. This discussed drivers and implications of the RBA’s decision to cut its assumption about medium-term trend productivity growth (that is, the average rate of productivity growth that the RBA assumes the economy will return to by the end of the SMP’s two-year forecast horizon).
In the August SMP, the RBA has finally decided to throw in the towel on its hitherto optimistic productivity projections and downgrade its numbers. It now assumes that trend productivity growth (in this context, non-farm GDP per hour worked) will return to an annual rate of 0.7 per cent. That is a 30 per cent reduction from its previous projection of a return to one per cent productivity growth. The new assumption is equal to the 20-year average growth rate for non-farm labour productivity.
The previous forecast assumed that nearly all the current weakness in productivity growth could be explained by temporary factors and that therefore once those faded, the economy would return to something like its historical trend. The new forecasts instead assume that some of the current slowdown is permanent, with potential explanatory factors including declining business and labour market dynamism, slower technological diffusion, declining competition, and regulatory barriers.
There are several things worth noting here.
First, the RBA sees this downgrade as solving a forecasting puzzle, whereby its projections for unemployment and inflation have been broadly accurate even as GDP growth has been weaker than expected. Slower-than-forecast productivity growth explains this discrepancy.
Second, the RBA assumes that slower productivity growth will have offsetting effects on the supply and demand sides of the economy. That is, while a lower rate of productivity growth implies a lower rate of potential growth (the RBA has cut its assumption for the potential growth rate to around two per cent from 2.25 per cent), it reckons this will lead to an equivalent reduction in growth in revenues and household incomes (including wages), leaving the balance of supply and demand unchanged and therefore with no implications for inflation. Based on its new productivity assumptions, the RBA thinks the rate of long-term wage growth consistent with inflation at target and full employment is now 3.2 per cent instead of 3.5 per cent (based on Average Earnings in the National Accounts or AENA) or 2.9 per cent instead of three per cent (based on the WPI).
Third, the RBA still reckons that a share of the slowdown is temporary, and therefore it still expects productivity growth to pick up from its current performance. More specifically, it continues to judge that recent falls in mining sector productivity will come to an end, that the recent rapid rate of output growth in the non-market sector will return to close to its historic average, and that there will be some general recovery in market sector productivity performance.
One last productivity-related point. The Box in the SMP covering Insights from Liaison includes an interesting section on firms’ experience with productivity performance. Survey findings indicate that regulation and labour availability have been key barriers over the past five years. Many firms also told the central bank that ‘the ongoing fast pace of growth in software prices’ was a challenge to securing a productivity payoff from technology investments, as was the need for more staff to facilitate adoption (although most respondents judged that over time, AI technologies would be labour-saving in nature).
Wages up 3.4 per cent over year to June quarter 2025
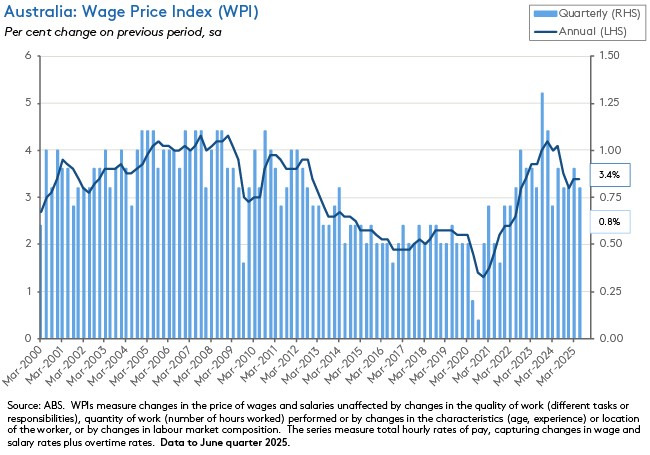
The ABS said the Wage Price Index (WPI) rose 0.8 per cent over the June quarter 2025 (seasonally adjusted) to be up 3.4 per cent over the year. The quarterly rate of increase was in line with the market consensus forecast, while the annual rate was slightly higher than the median prediction for a 3.3 per cent print. Annual growth in the WPI was unchanged from the March quarter, while the quarterly increase was slightly down from the previous quarter’s 0.9 per cent rise. In the June quarter last year, annual wage growth was running at 4.1 per cent.
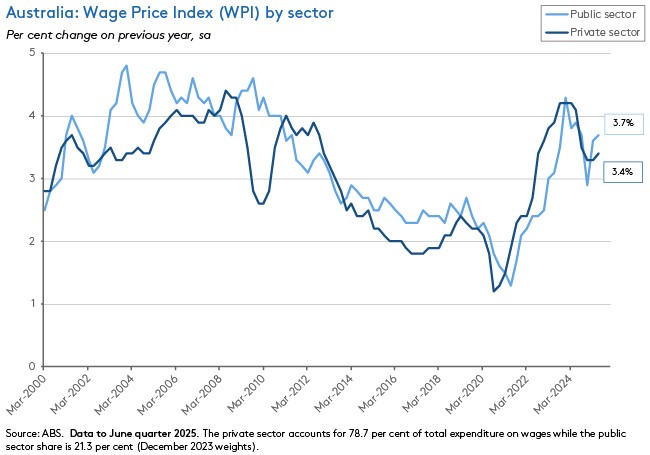
According to the Bureau, private sector wages rose 0.8 per cent over the quarter and 3.4 per cent over the year, while public sector wages growth was one per cent in quarterly terms and 3.7 per cent on an annual basis. In both cases, the annual rate of growth was marginally higher than in the March quarter (when it was 3.3 per cent and 3.6 per cent, respectively). The ABS said the quarterly increase in public sector wage growth reflected backdated pay rises from recently approved state-based enterprise agreements coming into force as well as regular scheduled pay rises.
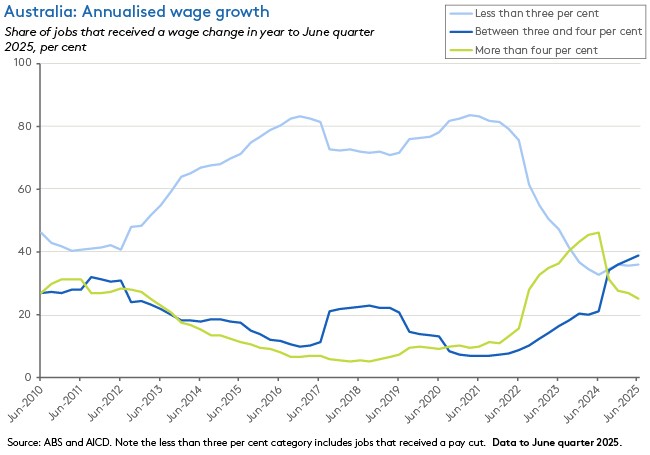
The average hourly wage change for those jobs in the private sector that recorded a change was 3.9 per cent, down from 4.3 per cent in the March quarter 2025.
Of those workers who received a wage increase over the year, the share of those receiving a rise of four per cent or more fell to 25.1 per cent, the lowest proportion since the June quarter 2022, while the share of those receiving an increase of between three and four per cent rose to 38.8 per cent – the highest in well over a decade.
By wage setting method, jobs covered by individual arrangements made the largest contribution (55 per cent) to quarterly wage growth, ahead of Awards and Enterprise agreements.
By industry, the Professional, scientific, and technical services sector was the main contributor to quarterly growth, followed by Public administration and safety, Construction, and Health care and social assistance. In terms of growth rates, the mining and utilities industries recorded the highest quarterly increases (1.3 per cent) while utilities saw the highest rate of annual growth (five per cent).
Finally, in the latest SMP discussed above, the RBA said one implication of its cut to projected productivity growth is a parallel reduction in the rate of wage growth it thinks is consistent with inflation at target in the long run (an important qualifier). Martin Place now puts this rate at around 2.9 per cent for wage growth on a WPI basis.
Australia’s labour market tightens in July
According to the ABS, the Australian economy grew employment by 24,600 in July 2025, as a 60,500 increase infull time employment was more than sufficient to offset a 35,900 drop in part-time employment (all numbers on a seasonally adjusted basis). That outcome was pretty much in line with the consensus forecast for a 25,000 gain.
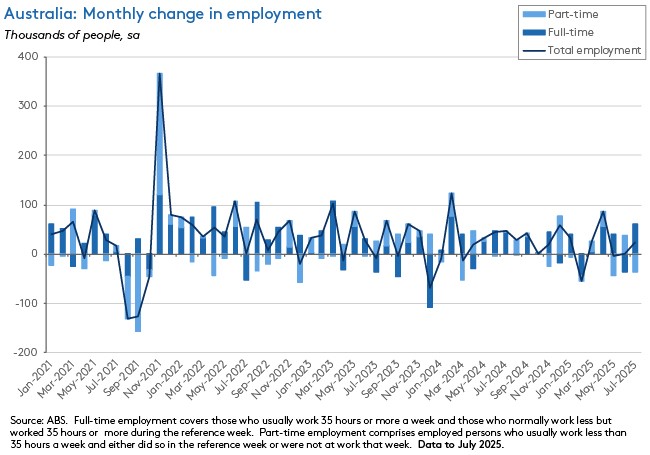
Monthly hours worked rose by six million last month, an increase of 0.3 per cent over the month that translated into a 2.1 per cent gain in annual terms.
The employment-to-population ratio rose to 64.2 per cent, while the participation rate was steady at 67 per cent. The Bureau noted that the female employment-to-population ratio (60.9 per cent) and participation rate (63.5 per cent) both reached new historical highs in July.
The number of unemployed people fell by 10,200 and the unemployment rate eased to 4.2 per cent from 4.3 per cent in June, again in line with the consensus forecast. The underemployment rate also fell by 0.1 percentage points, easing to 5.9 per cent. As a result, the overall underutilisation rate dropped to 10.1 per cent from 10.3 per cent.
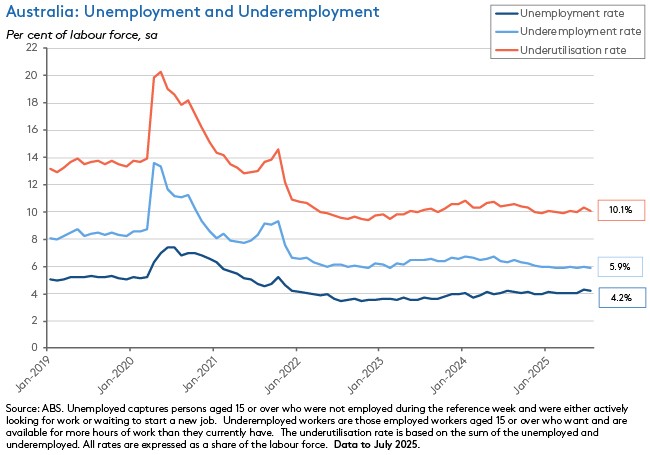
The fall in unemployment and underemployment, the robust growth in full-time employment, and the rise in the employment-to-population ratio all point to a modest degree of labour market tightening in July, reversing softening in labour market conditions present in the previous monthly labour force results. As well as being a reminder of the presence of some volatility in the month-to-month readings, when combined with this week’s WPI readings, the July labour force results are likely to tell the RBA that its cautious and gradual approach to monetary policy easing remains appropriate.
What else happened on the Australian data front this week (and last)?
Average weekly ordinary time earnings for full-time adults rose by 4.5 per cent over the year to $2,010.00 in May 2025. According to the ABS, this marks the first time that this measure of wages has exceeded $2,000. Growth in private sector earnings (at 4.6 per cent) outpaced growth in the public sector (3.6 per cent) over this period. Workers in the Mining industry are still the highest paid on average, earning $3,174.50 a week for full-time employees. Second place goes to Information media and telecommunications ($2,560.70). The lowest paid full time worker averages are in the Accommodation and food services ($1,459.70) and Retail trade ($1,504.40) industries.
The ABS said the total number of new loan commitments for dwellings rose 1.9 per cent to 129,994 in the June quarter of this year. That was up 0.2 per cent relative to the same quarter last year. New loan commitments for owner occupiers were up 0.9 per cent over the quarter to 80,929, which was 0.2 per cent less than in the corresponding period in 2024. Commitments to investors were up 3.5 per cent over the quarter and 0.8 per cent higher over the year, at 49,065.
New ABS data on barriers and incentives to labour force participation show that in the March quarter of this year, of the 19 million people aged 18 – 75 years, 14 million (73 per cent) were employed or had a job to start or return to; 1.9 million (10 per cent) were retired or permanently unable to work; and 3.3 million (17 per cent) did not have a paid job. Of that last group, 2.1 million did not want a job (with the main reason being studying or returning to studies) and 1.2 million people wanted one. Of that final group, 1.1 million (89 per cent) were available to start work within four weeks. The most common reason men seeking a job were unable to start within four weeks was ‘short term illness or injury’ (40 per cent) while for women it was ‘caring for children’ (42 per cent).
The ANZ-Roy Morgan Australian Consumer Confidence Index fell 1.3 points to an index reading of 89.3 for the week ending 10 August 2025. Four of the five subindices declined last week, led by a three-point fall in ‘time to buy a major household item’ and a 2.9-point fall in ‘medium-term economic confidence.’ The exception was a two-point gain in ‘short-term economic confidence.’ ANZ noted that despite the weekly decline, on a four-week moving average basis the confidence index is currently at its highest level in more than three years, reflecting lifts in household sentiment regarding both the economic outlook and household finances. Confidence is also more than five points above the level recorded at the same time last year. Meanwhile, weekly inflation expectations fell 0.2 percentage points to five per cent.
Last week, the ABS published updated Selected Living Cost Indexes (LCIs) for the June quarter 2025. The five LCIs recorded quarterly increases of between 0.4 per cent and one per cent while the annual rates of growth ranged between 1.7 per cent and 3.1 per cent. By way of comparison, the headline Consumer Price Index (CPI) rose 0.7 per cent over the quarter and 2.1 per cent over the year for the same period. The employee LCI rose 0.4 per cent quarter-on-quarter and 2.6 per cent year-on-year. After peaking at 9.6 per cent in the march and June quarters of 2023, the annual rate of increase in the employee LCI has now fallen to its lowest rate since the December quarter 2021 (which was the last time the annual growth rate had a ‘two’ in front of it). After an extended period of pain, employee households are now benefiting from falling mortgage interest rate charges, which fell 1.4 per cent over the quarter. Likewise, annual growth in mortgage interest charges slowed to 4.5 per cent in the June quarter of this year, down from 8.8 per cent in the previous quarter.
Also last week, the ABS released new data on household spending and business turnover for June 2025. The ABS Monthly Household Spending Indicator rose 0.5 per cent over the month (seasonally adjusted) to be up 4.8 per cent over the year. According to the Bureau, household spending on goods (food, new vehicles, clothing and footwear, and electronics) drove the monthly increase, as spending on services declined. In volume terms, household spending rose 0.7 per cent over the June quarter 2025 to be 2.4 per cent higher in annual terms. Discretionary spending drove the quarterly increase, powered by Recreation and culture and by Hotels, cafes and restaurants. Meanwhile, the ABS Monthly Business Turnover Indicator (13-industry aggregate) rose 0.1 per cent over the month and 2.9 per cent over the year in June. The Bureau highlighted notable monthly increases for the Arts and recreation services industry and for Mining, along with declines for Other services and for Professional, scientific, and technical services.
Other things to note . . .
- The RBA’s August 2025 chart pack.
- Also from the RBA, a new Research Discussion Paper asks, How costly are Mark-ups in Australia?* According to the authors’ estimates, if the degree of competition in the Australian economy had not declined from mid-2000s levels, productivity and output would have been one to three per cent higher, equating at the upper end to around $3,000 per person in today’s dollars. *Mark-ups are the ratio of price to marginal cost and economists use them as a measure of market power.
- The Productivity Commission has been delivering the Interim Reports accompanying its Five Pillars of productivity inquiries. To date, there have been contributions on creating a more resilient economy (which includes proposals for corporate tax reform and an improved approach to regulation), investing in cheaper, cleaner energy and the net zero transformation (including recommendations to focus on reducing emissions in the electricity sector beyond 2030, expand the Safeguard Mechanism to cover more industrial facilities, introduce new incentives to cover heavy vehicles and speed up approvals for new energy infrastructure via reform of national environment laws), harnessing data and digital technology (including proposals to treat AI specific regulation as a ‘last resort,’ to pause steps to implement mandatory guardrails for high-risk AI, and to provide an alternative compliance pathway for privacy), and building a skilled and adaptable workforce (including recommendations to move towards a national system of credit transfer and recognition of prior learning, to remove ‘excessive’ occupational entry regulations, and to expand entry pathways and streamline qualification requirements for occupations). This week brought the fifth interim report, on delivering quality care more efficiently, which recommends the pursuit of greater alignment in quality and safety regulations to improve efficiency and outcomes, collaborative commissioning to increase the integration of care services, and the establishment of a National Prevention Investment Framework.
- Ahead of the 19-23 August Economic Reform Roundtable, Treasury has produced background papers on Economic resilience, Productivity and Budget sustainability and tax reform. There is also an agenda (all pdfs).
- Related, the ABC on leaked Treasury advice ahead of the Roundtable.
- Making the case for fiscal rules and a stronger Parliamentary Budget Office.
- Some new estimates of tax (in)efficiency. State taxes – stamp duty and insurance taxes – are still the biggest offenders.
- Grattan’s Alison Reeves says Australia needs to talk about carbon pricing.
- The e61 Institute suggests policy priorities for August’s Economic Reform Roundtable.
- In the AFR, Adrian Blundell-Wignall makes the case for a significant resource rent tax. Key line: ‘Just as China has overinvested in steel, manufacturing, housing, electric cars, solar panels and much more, Australia has become its mirror image. We have been sucked into the China vortex with our own massive overinvestment in resources.’
- On public trust in the ABS and its statistics. According to the Bureau’s latest Community Trust in ABS Statistics Survey (CTASS), 90 per cent of respondents said they trusted the ABS as an organisation (up from 87 per cent in 2020) and 89 per cent said they trusted ABS statistics (up from 85 per cent in 2020).
- Also from the ABS, nine new facts on travel to and from Australia.
- A new report from the OECD on digital government in Australia.
- Also from the OECD, new research on the macroeconomic implications of extreme weather events.
- Recent columns from VoxEU on international trade: risks in the new trade landscape, the China shock hits Germany, and why globalisation needs a hegemon.
- Related, a BIS Bulletin on the macroeconomic impact of tariffs and policy uncertainty.
- The WSJ on what could be the world’s most expensive infrastructure project - China’s US$167 billion hydropower project on the edge of the Tibetan plateau.
- Also from the WSJ, Grep Ip reckons that the United States is headed for State capitalism with American characteristics.
- Two interesting sets of country reports from the IMF. First, a look at Argentina’s progress under its IMF program. And second, the 2025 Article IV Staff report on the UK and the accompanying Selected Issues paper which considers the UK-US productivity gap and industrial policy in the UK.
- McKinsey’s technology trends outlook 2025.
- The World Bank investigates which firms create more and better jobs in emerging economies.
- Christoper Clark contemplates the end of modernity.
- Two more from the FT’s frequently excellent Big Read series: the story behind Spain’s solar power meltdown (the country has built so much solar capacity that at certain times of day it produces a vast excess of electricity: as result, over the past year ‘day ahead’ wholesale electricity prices have been zero or negative 10 per cent of the time and profits have slumped) and why struggling businesses are investing in crypto (it’s a way to grab investor attention and boost their share price).
- Branko Milanovic has a three-part series on what he calls the new capitalism: New capitalism in America, Compositional vs income inequality, and Capital. By the way, if you find Milanovic’s approach interesting (and YMMV), I can recommend his Capitalism, Alone book.
- Some thinking about the coming wave of African urbanisation.
- On the rewards of ruin.
- From the Economist magazine, an economist’s guide to big life decisions.
- The Odd Lots podcast digs into the implications of the recent firing of the head of the US Bureau of Labour Statistics.
- The FT’s Gideon Rachman in conversation with Ray Dalio on the risk of a US debt crisis.
- The Economy, Stupid podcast on the biggest superannuation scandal in Australian history.
- Interesting history of the idea of ‘unemployment’ and its interaction with politics (from a British perspective) from the Past, Present, Future podcast.
- The UnHerd podcast in conversation with Patrick McGee, author of Apple in China. (I haven’t read it, but several members have now recommended it as a great read, so I have added it to my ever-growing wish list).
Latest news
Already a member?
Login to view this content