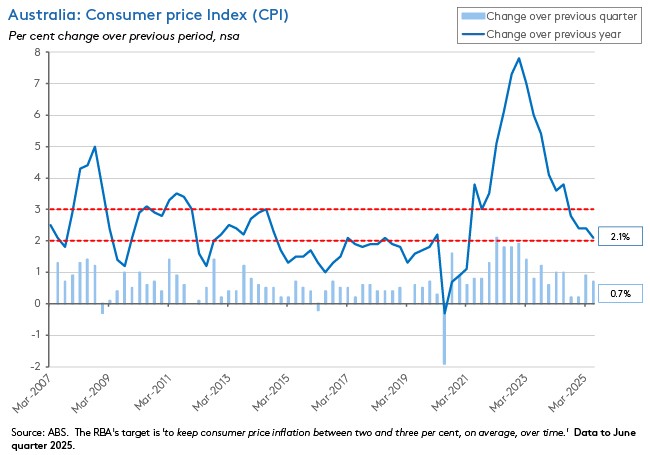
The main economic news this month was the eagerly awaited June quarter 2025 inflation reading. According to the ABS, the annual rate of increase in the Consumer Price Index (CPI) was just 2.1 per cent last quarter, while the annual rate of underlying inflation slowed to 2.7 per cent.
Those results were slightly softer than market expectations in terms of the quarterly rates and broadly in line with the median forecast for the annual rates for both headline and underlying inflation. The headline rate was also consistent with the RBA’s projections in the central bank’s May 2025 Statement on Monetary Policy (SMP). Underlying inflation, on the other hand, came in marginally higher than the SMP’s forecast for a 2.6 per cent result. Even so, headline inflation has now been within the RBA’s target band for four consecutive quarters and underlying inflation for the past two. Both are also running at their lowest annual rates since 2021. Combine those results with a weaker than expected June labour market outcome and even with a slight overshoot on the trimmed mean annual rate, the cautious majority on the Monetary Policy Board should nevertheless be comfortable enough with recent developments to deliver a rate cut at the upcoming meeting on 11-12 August.
Elsewhere this week, the IMF released its mid-year update for the World Economic Outlook. Relative to numbers in the April 2025 edition of the WEO, the IMF has upgraded its forecasts for global growth this year (by 0.2 percentage points to three per cent) and next (by 0.1 percentage points to 3.1 per cent). The Fund has likewise increased its forecasts for Australian growth in 2025 (up by 0.2 percentage points to 1.8 per cent) and 2026 (up by 0.1 percentage points to 2.2 per cent). According to the Fund, the improved outlook for global growth reflects several factors, including stronger-than-forecast frontloading in trade and business investment in the first quarter of this year in response to tariff concerns; lower average effective US and global tariff rates than at the time of the April WEO; a loosening in global financial conditions due to a weaker US dollar and rebounding global share markets and increased fiscal spending, particularly in the United States.
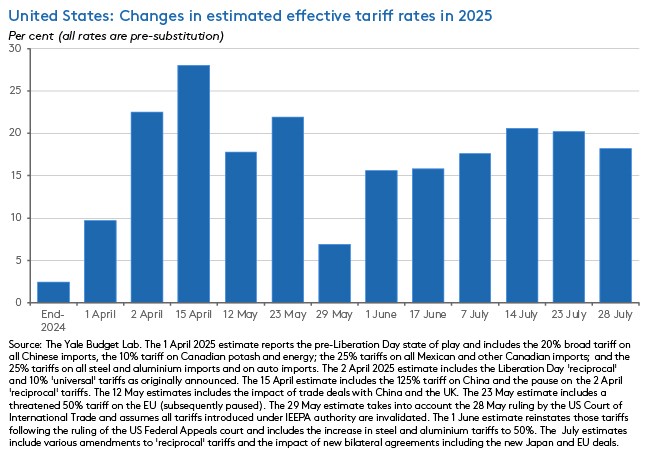
The new IMF projections arrived as the Trump administration completed trade negotiations with several major trading partners including the EU, with Brussels acquiescing to a deal that will see most European imports hit with a 15 per cent tariff, while promising to spend hundreds of billions of euros on US energy and defence equipment. A modern version of Danegeld, perhaps? As a result of the latest negotiations, the estimated US effective tariff rate rose to around 18 per cent, the highest since 1934 (or to around 17 per cent after assuming shifts in US consumption patterns, the highest since 1935). While that leaves the US tariff rate down quite significantly from a peak of around 28 per cent in April this year, it remains far higher than the 2.4 per cent rate that prevailed at the end of 2024. It could be that 15 per cent will be the ‘new normal’ for baseline US tariffs, although at this point yet more tariffs changes are pending.
We dig into Australia’s inflation numbers and the latest IMF forecasts in more detail below. We also review the latest numbers on Australian labour mobility and provide a summary of other domestic data releases this week. Plus, our regular linkage roundup which this time includes several different takes on Australia’s productivity and reform challenges. As usual, if you’d like to see the charts that accompany the analysis, please click through to read the web site version.
Finally, I am on the road next week, so there will be no weekly update. Normal service will resume the following week.
Inflation eases again in June quarter 2025
The ABS said Australia’s Consumer Price Index (CPI) rose 0.7 per cent over the June quarter of this year to be up just 2.1 per cent on an annual basis, down from 2.4 per cent in the March quarter 2025. The quarterly outcome was slightly softer than the market consensus (0.8 per cent) while the year-on-year result was in line with market expectations and also matched the forecast in the RBA’s May 2025 Statement on Monetary Policy (SMP). Headline inflation is now at its lowest rate since the March quarter 2021.
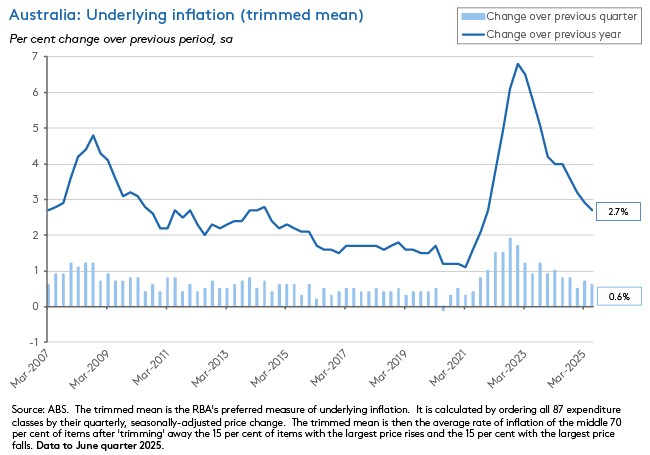
Underlying inflation (as measured by the trimmed mean) rose 0.6 per cent over the quarter to be up 2.7 per cent on an annual basis, down from 2.9 per cent in the March quarter. That was a slightly softer quarterly outcome than the one anticipated by the market consensus forecast, which had pencilled in a 0.7 per cent print, although once again it was line with median forecasts for the annual rate of change. Underlying inflation was slightly stronger than the RBA’s May 2025 SMP projections, which had anticipated a 2.6 per cent rate. Underlying inflation remains at its lowest annual rate since the December quarter 2021.
In terms of the key drivers of inflation over the quarter, the ABS highlighted Housing (up 1.2 per cent, driven by an 8.1 per cent rise in Electricity as households used up Commonwealth and State government rebates), Food and non-alcoholic beverages (up one per cent due to higher fruit and vegetable prices in response to lower supply) and Health groups (up 1.5 per cent following the annual increase in private health insurance premiums on 1 April) with an offsetting fall in the Transport group (down 0.7 per cent as a result of a 3.4 per cent drop in automotive fuel prices due to lower global oil prices).
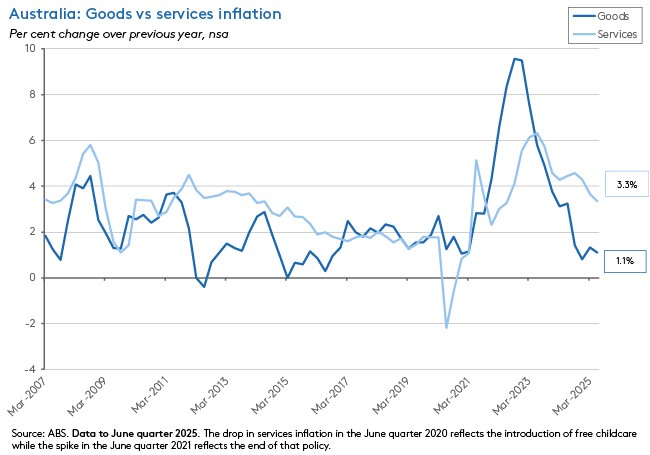
By broad analytical category, the annual rate of goods inflation eased from 1.3 per cent in the March quarter to 1.1 per cent in the June quarter, while the annual rate of services inflation slowed from 3.7 per cent to 3.3 per cent over the same period. The headline rate of services inflation is now at is lowest rate since the June quarter 2022, helped down by a slower rate of annual increase for rents (at 4.5 per cent, the softest result for this series since the December quarter 2022) and insurance. The decline in goods inflation reflected a 10 per cent fall over the year in automotive fuel prices and a slowdown in the annual rate of inflation for new dwellings to just 0.7 per cent.
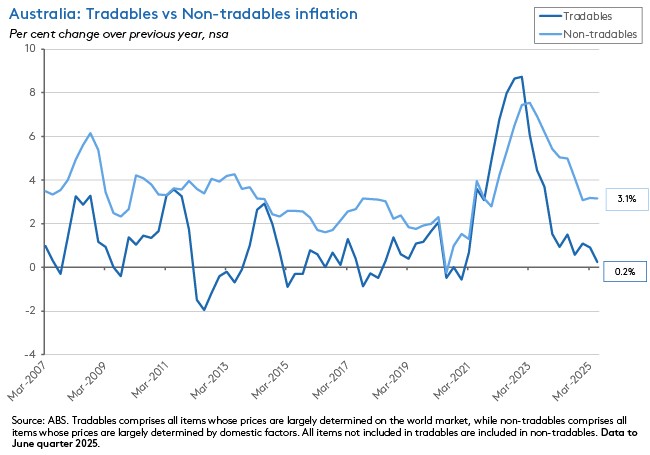
Broadly consistent with the goods-services split, the annual rate of tradables inflation eased from 0.9 per cent in the March quarter to just 0.2 per cent in the June quarter. Non-tradables inflation edged down from 3.2 per cent to 3.1 per cent over the same period.
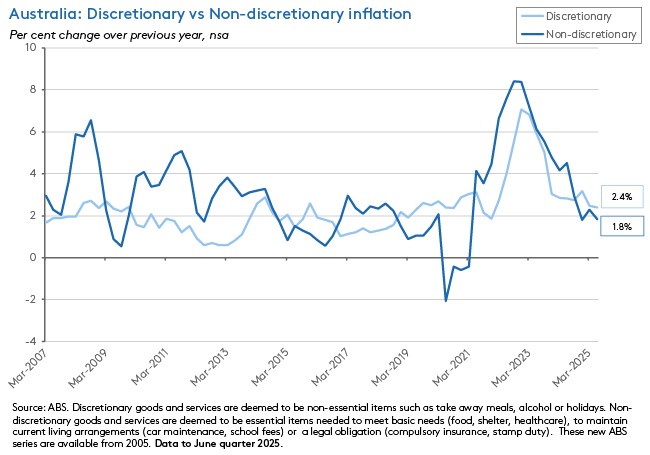
The annual rate of non-discretionary inflation (1.8 per cent) was below the discretionary rate (2.4 per cent) for a third consecutive quarter.
Finally, a reminder that the ABS will start publishing a full monthly CPI from November this year, marking the transition from a quarterly to monthly inflation report. (Recall that the current Monthly CPI Indicator – which printed at an annual rate of 1.9 per cent in June, the lowest reading since March 2021 – is only a partial measure and will be replaced by the new monthly series.)
IMF upgrades forecasts for global growth in 2025 and 2026
The IMF’s July 2025 World Economic Outlook (WEO) Update has tweaked expectations for global growth this year and next. It now thinks the world economy will grow by three per cent in 2025 and by 3.1 per cent in 2026. Those new forecasts represent upgrades of 0.2 and 0.1 percentage points respectively, relative to the Fund’s forecasts as presented in the April 2025 WEO.
In summary, several developments drove the forecast revisions:
- The IMF was surprised by the strength of the frontloading of trade and investment in the first quarter of this year, as firms and households rushed to get ahead of incoming tariff increases. For example, there was a dramatic increase in Irish pharmaceutical exports to the United States which was large enough to boost eurozone-wide GDP. As a result, first quarter global GDP growth was 0.3 percentage points higher than the Fund had expected back in April. The WEO update does note that this upside surprise comes with downside risks attached: A possible inventory overhang could depress new orders and/or firms could be burdened with increased holding costs, for example.
- Ongoing trade negotiations means that US and global effective tariffs have fallen since the April 2025 WEO. The July WEO Update assumes a US effective tariff rate of 17.3 per cent vs 24.4 per cent in April and a corresponding effective tariff rate for the rest of the world of 3.5 per cent vs 4.1 per cent in April. Note that following recent agreements with the EU and others, the US effective rate is currently higher than the Fund’s assumption, at a little above 18 per cent.
- Global financial conditions have eased since April. In part this reflects a rebound in US and to a lesser extent global equity markets, which seem to have decided that the downside risks to tariffs will turn out to be modest. It also reflects continued progress with disinflation at the level of the global economy (although the WEO reckons that in the United States, inflation will remain above target through next year) along with a fall in the US dollar, where the latter has been particularly helpful for emerging and developing economies (by increasing the available monetary policy space). The Fund sounds agnostic on the drivers of a weaker greenback, noting that although one possibility is that foreign investors are shifting away from US securities, so far there is little evidence in the data of a broad-based pullback. Meanwhile, increased hedging against dollar weakness is of uncertain longevity.
- Fiscal expansion also underpins some projected growth increases. In the case of the United States, for example, the IMF reckons the One Big Beautiful Bill Act (OBBBA) will increase the US fiscal deficit by about 1.5 percentage points of GDP next year, with roughly half of this offset by higher tariff revenues. The Fund thinks the OBBBA could lift US output by about 0.5 per cent on average through to 2030, although this comes at the cost of larger deficits. In this context, the WEO Update also cautions that with several economies including the US, France and Brazil now expected to run large fiscal deficits against a backdrop of historically high levels of public debt, fiscal vulnerabilities could become more salient (see also last week’s note on the rising risks of fiscal dominance).
Despite the upgrades, the Fund judges that, taken overall, risks remain tilted to the downside. Along with those already noted above, the WEO Update flags the possibility of further tariff increases, the ongoing headwinds from elevated levels of (trade) policy uncertainty and the fragile geopolitical environment.
Job mobility in Australia continues to slide
The ABS released new data on labour market participation, job search and mobility this week. According to the Bureau, as of February this year, the job mobility rate had fallen to 7.7 per cent from eight per cent in February 2024. The job mobility rate is the number of people who changed jobs during the year as a proportion of people who were employed at the end of the year. Prior to the pandemic, Australia’s mobility had been trending downwards since the 1990s, with the rate dropping to 8.4 per cent in February 2019.
Pre-pandemic, policymakers and economists had worried that this indicator (along with other measures such as low firm entry and exit rates) pointed to a lack of dynamism and competition in the Australian economy.
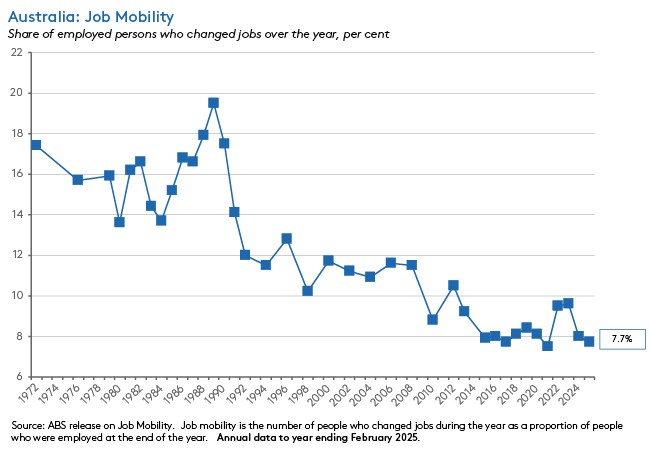
The pandemic produced what now looks to have been a short-lived break in this trend. After an initial drop to 7.5 per cent in 2021, mobility increased to more than nine per cent in 2022 and 2023, peaking at 9.6 per cent in February 2023, the highest rate since 2012. But the mobility rate fell last year and has now dropped again, returning to its 2017 level.
As well as offering an insight into structural factors such as economic dynamism, the job mobility rate also reflects cyclical factors, especially the degree of labour market slack (since in a tighter labour market, workers will find it easier to find new jobs). So, the latest decline in mobility is also consistent with some modest easing in labour market conditions.
An increase in the annual retrenchment rate (measured as the number ofpeople retrenched in a year as a proportion of those who were employed at the start of that year) supports that interpretation. The ABS said that in the year ending February 2025 the retrenchment rate rose slightly, edging up to 1.9 per cent from 1.7 per cent in the year to February 2024. That leaves the rate meaningfully higher than its recent low of 1.3 per cent in 2023 but still below a pre-pandemic rate of 2.1 per cent that prevailed in 2018 and 2019. Again, we would expect changes in the retrenchment rate to reflect a mix of structural and cyclical factors.

What else happened on the Australian data front this week?
The ABS said retail trade jumped 1.2 per cent over the month (seasonally adjusted) to be up 4.9 per cent over the year in June 2025. The Market consensus was for a more modest 0.4 per cent increase, so the second quarter of this year has ended on a stronger than expected note. According to the Bureau, discounts linked to mid-year sales events which boosted spending on discretionary items including furniture, electrical goods and clothing items drove the jump in June retail spending. New product releases, including the launch of the Nintendo Switch 2, which enjoyed record sales, also played a role. At the same time, retail sales volumes rose 0.3 per cent over the June quarter. On a per capita basis, sales volumes fell 0.1 per cent over the quarter, with the rate of decline easing from the March quarter’s 0.4 per cent per capita decline. Note this was the final publication of the retail trade series, which will now be replaced by the ABS’ Monthly Household Spending Indicator.
In June 2025, total dwellings approved rose by a strong 11.9 per cent over the month (seasonally adjusted) and by 27.4 per cent over the year to stand at 17,076. That marked the highest level of approvals since August 2022. The ABS said approvals for private sector houses were down two per cent over the month and little changed over the year at 9,142, but approvals for private sector dwellings excluding houses soared by 33.1 per cent in monthly terms and by 87.1 per cent over the year, to stand at 7,594.
The ANZ-Roy Morgan Consumer Confidence measure was little changed for a third consecutive week, with the index up 0.4 points to 86.7 for the week ending 27 July 2025. Weekly inflation expectations rose 0.2 percentage points to 4.9 per cent.
Other things to note . . .
- The Productivity Commission (PC) gave an update on its Five Pillars of productivity inquiries, including a timetable for the release of associated interim reports. The PC also published a new overview - Growth mindset: how to boost Australia’s productivity (pdf).
- McKinsey suggests five big tests for Australia’s productivity agenda.
- New outfit Inflection Points says it wants to bring ‘a rigorous, unapologetically pro-growth perspective to Australian policy.’ Editorial on the spirit of progress. And an essay on the problem with urban planning.
- The Grattan Institute’s productivity agenda for Australia.
- Meanwhile, the Australia Institute reckons ‘claims that Australia faces a productivity crisis are overblown.’
- RBA Deputy Governor Anderw Hauser’s ‘fireside chat’ at the Barrenjoey economic forum (video).
- This analytical note from the e61 Institute examines the distribution of individual income tax rates in Australia. The authors find ‘a huge amount of dispersion’ in effective tax rates for individuals in the top five per cent of taxpayers, ranging from below 20 per cent to above 40 per cent’. ‘Their level of income plays almost no role in determining where in this range an individual finds themselves…in this part of the distribution [which accounts for more than a third of all tax revenue] there is neither vertical nor horizontal equity.’
- Graeme Dobell reviews recent writings on Australia in a post-American world.
- The ABS marked the end of its Retail Trade publication with an article commemorating more than 75 years of retail trade statistics.
- Also from the ABS, new insights into Australia’s rental market.
- Austan Goolsbee discusses what’s been driving the recent surge in US productivity growth and implications for monetary policy. He considers the rise of WFH, better matching of workers to jobs after the COVID-19 induced Great Resignation, a post-pandemic surge in entrepreneurial dynamism (manifested in a jump in the number of startups), and the early impact of AI.
- This week’s Economist magazine has two briefings on AI. The first looks at safety issues while the second asks, what if AI produces explosive economic growth?
- Also from the Economist, the rise of ‘greenhushing.’
- Measuring the implications of pressure on central bank independence using blockchain prediction markets.
- The WSJ’s Greg Ip says Trump’s new trade order is fragile.
- The BIS Bulletin analyses Africa’s trade landscape and growth opportunities.
- Paul Krugman on the General Theory of Enshittification. It is all about network effects, according to Krugman.
- The IEA thinks global coal demand in 2025 and 2026 is set to remain close to the record high reached in 2024.
- Two Big Reads from the FT. One on robotaxis and driverless vehicles, and one on desalination.
- The geological sublime. Lewis Hyde considers Darwin, deep time, climate change and New England (US) butterflies.
- The FT Economics podcast asks, has Argentina’s Javier Milei proved his critics wrong?
- And from a sister podcast, the FT’s Unhedged examines why the EU folded on tariffs.
- The Odd Lots podcast on what 300 years of firewood prices can tell us about (US) economic development. (I linked to this paper a while back, so it is interesting to hear from the author.)
Latest news
Already a member?
Login to view this content


