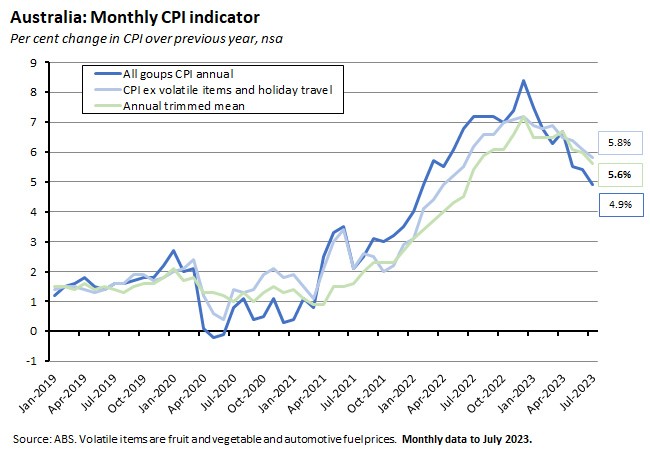
Inflation continues to track lower in the Australian economy, with the annual rate of increase in the monthly CPI indicator easing from 5.4 per cent in June this year to 4.9 per cent in July. The rate of disinflation is currently running ahead of market forecasts, which had predicted a 5.2 per cent print this week. The news should cheer Philip Lowe in his last meeting as RBA governor next week.
Granted, the way that the monthly indicator is constructed (not all categories are updated in the first month of the quarter) and the prospect of higher petrol prices feeding into the August numbers, mean that the monthly path of disinflation may not be smooth from here. It’s also true that the decline in underlying inflation remains more modest than the drop in the headline rate, and that stubbornness, along with the ongoing divergence between goods and services inflation, continues to raise questions over the likely persistence of above-target inflation. Still, even after taking those qualifications into account, the direction of travel towards lower inflation is clear.
What are the implications for next week’s RBA meeting? Drawing on the message from the minutes of the August RBA monetary policy meeting, we reckoned a couple of weeks back that another central bank rate hike in the current cycle would first require the appearance of some obvious upside inflation risks. We went on to argue that the latest wage and employment readings had failed to make a compelling case for a September rate hike. This week’s subpar print for the monthly CPI indicator should also fail to meet that same test. Financial markets seem to agree, as market pricing indicates a high probability for an unchanged target cash rate. Thus, another pause looks to be the most likely outcome at the monetary policy meeting on 5 September.
More detail on the inflation numbers follow, as well as a review of the rest of the week’s data. Elsewhere, in this week’s episode of the Dismal Science podcast, we consider the relationship between monetary policy and climate change and review some of the discussion at the recent Jackson Hole meeting of central bankers.
Australia’s monthly inflation indicator eases to 4.9 per cent in July 2023
The ABS said that the monthly Consumer Price Indicator (CPI) rose 4.9 per cent in the twelve months to July 2023, down from a 5.4 per cent annual rate in June. That was a better result than the market had expected, with the consensus forecast predicting a 5.2 per cent print. It also means that the annual rate has fallen for four consecutive months since April’s 6.7 per cent result and is now well below the peak of 8.4 per cent recorded last December.

According to the Bureau, the most significant contributors to inflation in July were Housing (up 7.3 per cent) and Food and non-alcoholic beverages (up 5.6 per cent). That was the case even though both measures were down on the previous month. For example, the increase for Food and non-alcoholic beverages had slowed from seven per cent in June to the lowest rise seen since May last year. Likewise, the rate of increase for housing eased from 7.4 per cent in June and the 5.9 per cent rise in new dwelling prices the lowest annual increase recorded by that series since October 2021. However, in the same housing category the rate of rental price increases rose from 7.3 per cent to 7.6 per cent and the rise in electricity prices accelerated from 10.2 per cent in June to 15.7 per cent in July. That last increase reflected a six per cent monthly jump due to the impact of annual price reviews across Australian capital cities. Indeed, the rise could have been even larger: the ABS noted that absent the impact of rebates from the Energy Bill Relief Fund, electricity prices would have soared by 19.2 per cent over the month.
Inflation in July was pulled down by price falls for Automotive fuel (dropping 7.6 per cent over the year) and Fruit and vegetables (down 5.4 per cent in annual terms).
The two monthly measures of underlying inflation also both eased in July, albeit by less than the headline numbers, and both remained above the headline rate. The annual rate of increase in the CPI excluding volatile items and holiday travel slowed from 6.1 per cent in June to 5.8 per cent. While the annual trimmed mean measure of inflation fell from six per cent to 5.6 per cent.
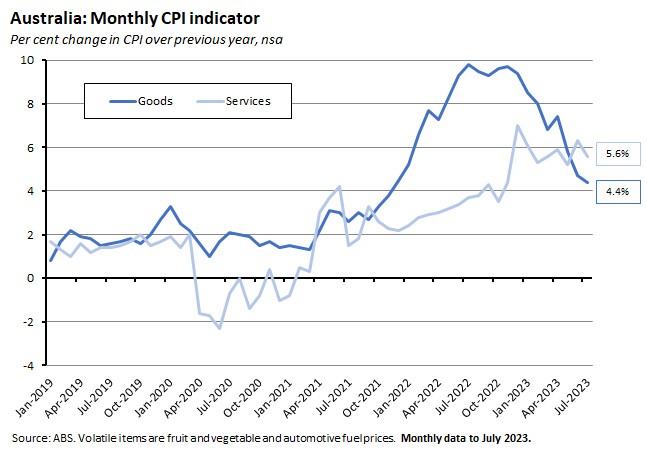
The ABS also published for the first time new monthly analytical series for goods and services, and tradables and non-tradables inflation. The annual rate of goods inflation slowed from 4.7 per cent in June to 4.4 per cent in July while annual rate of services inflation also eased, dropping from 6.3 per cent to 5.6 per cent. The pattern here is consistent with the quarterly readings, which show the bulk of disinflation to date being driven by developments in goods prices.

Tradables inflation was a low 1.7 per cent in July while non-tradables inflation ran at a much faster 6.5 per cent.
Finally, the ABS introduced a partial update of the CPI weights in July (normally these are updated every October). This involved an increase in the weight for international travel to better capture the impact of the continued increase in Australians holidaying overseas. In July, the annual rate of price increase for all holiday travel and accommodation fell from 12.9 per cent in June to 5.3 per cent in July.
What else happened on the Australian data front this week?
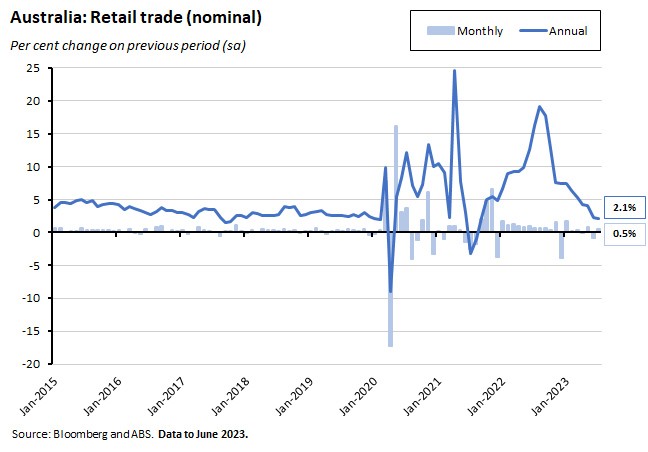
The ABS said that retail turnover rose 0.5 per cent over the month (seasonally adjusted) in July 2023 to stand 2.1 per cent higher over the year. That was a stronger result than market expectations for a softer 0.2 per cent monthly increase. It also represented a large bounce back after the 0.8 per cent fall in turnover recorded in June and weaker-than-usual end of financial year sales. The Bureau reckons that the increase in retail sales in July was given a boost by additional spending at catering and takeaway food outlets linked to the 2023 FIFA Women’s World Cup and the school holidays. But the ABS also noted that when considered on a trend basis, retail turnover was flat across the month and up only 1.9 per cent over the year despite the lift to nominal sales provided by strong price growth.

Private new capital expenditure rose by 2.8 per cent over the June quarter 2023 (seasonally adjusted) to be 10.8 per cent higher over the year. According to the ABS, spending on building and structures rose 3.5 per cent quarter-on-quarter and 15 per cent year-on-year while the corresponding quarterly and annual growth rates for spending on equipment, plant and machinery were 1.9 per cent and 6.4 per cent, respectively, indicating a broad-based rise in investment. This was a strong set of results, with the quarterly increase in capex comfortably outpacing the market consensus forecast of a one per cent rise. The Bureau commented that the rise in investment in equipment and machinery reflected a further easing of supply chain disruptions (with an improvement in vehicle and machinery availability, particularly in the construction sector) while the increase in building and structures investment was the product of a number of mining projects for resources such as lithium as well as the start of some previously delayed non-mining investment projects. Some economists also suggested that investment spending was boosted to take advantage pandemic-era tax incentives which expired at the end of June. Finally, the ABS also published Estimate 3 for capital expenditure in 2023-24. The estimate was $157.8 billion, up 14.5 per cent on Estimate 2 and 7.1 per cent higher than Estimate 3 for the 2022-23 year.
The ANZ-Roy Morgan Consumer Confidence Index rose 2.3 points to an index reading of 78.1 in the week ending 27 August. This uptick follows last week’s 2.4-point fall (at the time attributed to a falling dollar and rising petrol prices) and means that for the past six weeks confidence readings have fluctuated in a narrow band of 3.5 index points, between 75 and 78.5. It also means that confidence has spent a record 26 consecutive weeks (or six months) below an index reading of 80, with the 2023 weekly average to date now standing at 78.1. Despite the recent weekly fluctuations, that means the index continues to signal a period of significant weakness relative to past levels. Meanwhile, weekly inflation expectations fell 0.3 percentage points to 5.2 per cent.
The ABS said that the total number of dwellings approved fell 8.1 per cent over the month in July 2023 (seasonally adjusted) and dropped 10.6 per cent relative to July 2022. That fall was driven by a sharp 15.8 per cent monthly fall in approvals for private sector dwellings excluding houses, although they were still up 3.4 per cent over the year. In contrast, approvals for private sector houses edged 0.1 per cent higher over the month but were down 16.9 per cent on their July 2022 result. The Bureau also reported that the value of total building approved fell 16.9 per cent over the month, pulled down by a 27.8 per cent drop in non-residential approvals and a smaller 4.4 per cent drop in residential approvals.
Total construction work done in the Australian economy rose 0.4 per cent over the June quarter 2023 (seasonally adjusted) to be 9.3 per cent higher over the year. Building work done was up 0.4 per cent quarter-on-quarter and 4.3 per cent year-on-year, with residential construction flat over the quarter and 2.7 per cent higher in annual terms but non-residential construction growing 0.6 per cent over the quarter and 6.7 per cent over the year. The ABS also said that engineering construction rose 0.7 per cent over the quarter and 15.5 per cent over the year.
The ABS said that there were 4.1 million retirees in Australia in 2020-21. The average age at retirement of all retirees was 56.3 years, the average age at retirement of the 140,000 people who retired in 2020 was 64.3 years, and the average age people now intend to retire is 65.5 years. The main source of income for retirees was the government pension (44 per cent for men and 42 per cent for women) followed by superannuation (35 per cent for men and 19 per cent for women).
According to ABS data released last Friday, business expenditure on Research and Development (R&D) was $20.6 billion in 2021-22, up 14 per cent from 2019-20. However, the ABS also noted that R&D spending as a share of GDP has remained unchanged from its 2017-18 level at 0.9 per cent of GDP. By industry, Professional, scientific and technical services accounted for 34 per cent of all R&D spending, followed by manufacturing (25 per cent) and the Financial and insurance services industry (15 per cent). By field of research, Information and computing sciences (38 per cent of the total spend), Engineering (26 per cent) and Biomedical and clinical sciences (14 per cent) were the largest fields. Spending on biomedical and clinical sciences rose by 35 per cent while expenditure on Information and computing sciences was up 12 per cent. The ABS also estimates that total gross expenditure on R&D (GERD) by the combined Business, Government, Higher Education and Private non-profit sectors was a bit less than $38.8 billion in 2021-22, or about 1.7 per cent of GDP. That’s down from 1.8 per cent of GDP in 2019-20 and 2.1 per cent in 2013-14.
Other things to note . . .
- The Grattan Institute’s Danielle Wood gave a speech on Creating a better Australia for Generation Next.
- John Quiggin argues that last week’s Intergenerational Report gets population ageing wrong, because it neglects radical changes in the pattern of lifetime work, the improving health of the elderly and the way that technology has eliminated many unskilled – and physically onerous – jobs.
- RBA Deputy Governor (and soon to be Governor) Michelle Bullock gave the Sir Leslie Melville Lecture on climate change and central banks. Her speech covered how more frequent and severe weather events and the global transition to net zero could influence the setting of monetary policy as well as how the RBA was monitoring the impact of climate change as it relates to financial stability. (We spend quite a bit of time talking about monetary policy and climate change in this week’s Dismal Science podcast.)
- Roy Morgan reckons that 1.5 million Australians or 29.2 per cent of mortgage holders were at risk of ‘mortgage stress’ as of July this year (‘at risk’ is based on paying more than 25 per cent to 45 per cent of after-tax household income on their home loan). That number of mortgage holders was up by 642,000 over the year. But while July’s number represents an absolute high, the share of mortgage holders at risk of stress is still below the record high of 35.6 per cent reached during the GFC.
- The AFR with a long read on Australian industry policy and picking winners.
- Also from the AFR, Renee Fry-McKibbin, one of the authors of the recent RBA Review, explains the thinking behind the proposed dual mandate for the central bank.
- On Sam Roggeveen’s ‘echidna strategy’ for Australia.
- ABC Business journalist Gareth Hutchens has penned two columns seeking to answer the question, what is the point of economics journalism? Part 1 and part 2.
- The agenda and links to presentations and papers from the Jackson Hole Economic Policy Symposium. The theme this year was ‘Structural shifts in the global economy’, and we talk about this in the latest edition of the Dismal Science Podcast.
- Related: Odd Lots podcast on what we learned from the US Fed meeting at Jackson Hole.
- From the FT, Chris Giles lists five big economic shifts currently happening in the world economy: monetary policy is moving from reducing inflation to keeping it under control; supply conditions have become increasingly unstable; US politics has lost any will regarding budgetary restraint; India is becoming a more important player in the world economy; and the ‘normal’ rate of global growth is set to slow due to a weaker outlook for productivity, rising barriers to trade and an increased focus on resilience over efficiency.
- Charles Goodhart argues that central banks should abandon single point forecasts and replace them with a scenario approach…but only after they have returned inflation to target.
- A long read from the WSJ reckons that the German economy is sliding into stagnation as the country’s reliance on manufacturing and the global trade cycle has left it exposed to the recent mix of economic shocks including the disruption to global supply chains during the pandemic, the surge in energy prices following the Russian invasion of Ukraine and the world economic slowdown triggered by higher inflation and tighter monetary policy.
- The Economist magazine has a briefing on the interaction between El Nino and global warming, highlighting the threat of significant disruption to commodity markets.
- A new report from the McKinsey Global Institute on the economics of addressing both poverty and climate change.
- The latest IMF Article IV and Selected Issues reports for New Zealand.
- The NY Fed on business attitudes to remote work.
- Revisiting the Laffer curve.
- The FT’s Behind the Money podcast looks at the pros and cons of share buybacks.
- The Macro Musings podcast talks to John Coates about index funds, private equity, and what happens when a few financial institutions control everything.
Latest news
Already a member?
Login to view this content


