This week the RBA delivered the 10th consecutive rate hike of the current monetary policy cycle, with Tuesday’s 25bp increase in the cash rate target taking the cumulative tightening to date to 350bp and the cash rate up to 3.6 per cent, its highest level since H1:2012. Yet arguably the bigger news was the RBA hinting at the possibility of an upcoming pause in the interest rate cycle.
After the hawkish statement accompanying last February’s RBA meeting, an increase this month had been widely expected. Hence attention was focused less on the decision itself and more on if Martin Place would double down on last month’s tough rhetoric, or if some softer than expected growth and inflation readings that had dropped in the meantime would prompt a rethink.
Granted, the statement accompanying this week’s rate increase indicated that the RBA Board still ‘expects that further tightening of monetary policy will be needed to ensure that inflation returns to target’. That suggests that there remains at least one more rate hike to come before the RBA is done. But the text then continued:
‘In assessing when and how much further interest rates need to increase, the Board will be paying close attention to developments in the global economy, trends in household spending and the outlook for inflation and the labour market.’ [emphasis added]
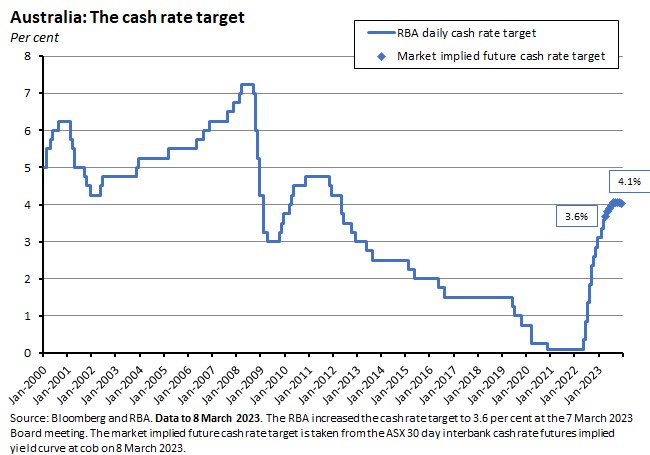
The key word is the third one – ‘when’ – which by injecting a degree of uncertainty about the timing of the next rate hike introduces the possibility of an imminent pause in the tightening cycle. That message was made more explicit in a speech from Governor Lowe onInflation and Recent Economic Data delivered the day after the RBA Board meeting. The governor concluded his formal remarks by noting:
‘At our Board meeting yesterday…[w]e also discussed that, with monetary policy now in restrictive territory, we are closer to the point where it will be appropriate to pause interest rate increases to allow more time to assess the state of the economy. At what point it will be appropriate to pause will be determined by the data and our assessment of the outlook.’
‘Closer’ is not the same as ‘at’, of course, but taken together, those two comments represent a clear shift in tone from February’s assessment, which had warned:
‘The Board expects that further increases in interest rates will be needed over the months ahead to ensure that inflation returns to target and that this period of high inflation is only temporary.’
Just as that earlier comment had prompted markets to anticipate a more aggressive rate cycle from the RBA, the latest change in tone has seen some of those earlier revisions pared back again. Indeed, at the time of writing, market pricing was indicating a slightly greater than 50 per cent chance of a pause next month. The shift in central bank messaging this week largely reflects a run of soft data releases, (see more below), but one key message is that the trajectory for interest rates from here will be similarly data dependent.
Before we dig further into the detail, including a review of some of last week’s key releases, a quick thank you to AICD members who were able to say hello at the AGS last week and to those who attended our live Dismal Science podcast. I very much appreciate your taking the time to do so. Finally, travel commitments mean that next week’s note will have to be a truncated affair. But in the meantime, there’s a hefty dose of economic data and linkage below.
From hawk to dove - why has the RBA changed its tone?
This week’s 25bp increase in the cash rate target means that – with 350bp of rate hikes over the course of just 10 meetings – the current policy tightening cycle is likely the most brutal of the era of inflation targeting to date, with the 1994 cycle the only other contender. Moreover, the RBA continues to say that it thinks even more tightening will be required.
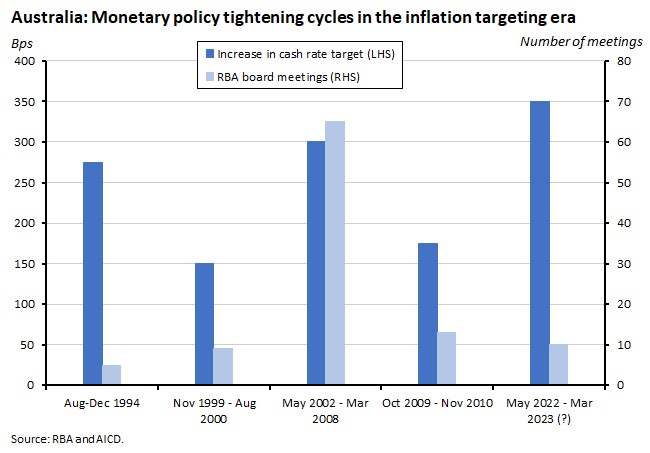
Yet, as noted above, the post-meeting focus this week has not been on the widely anticipated decision to deliver another 25bp rate hike but rather on the shift in tone from the central bank, which over the space of a month has gone from signalling the likelihood of multiple further rate increases to publicly contemplating the case for a pause in the tightening cycle.
Three factors appear to have driven that change.
- First, Martin Place recognises that it has already delivered a significant amount of policy tightening and done so in a short period of time. As a result, the cash rate target has now moved past a neutral setting and into a restrictive one.
- Second, and as we’ve stressed several times before, monetary policy operates with a lag. As the RBA statement notes, that means the full effect of those 350bp of rate increase is yet to be felt across the economy in general and in mortgage payments in particular (in his speech this week, Lowe noted that total required mortgage payments are expected to reach 9.5 per cent of household disposal income later this year, around a record high). Together with Australian households’ relatively high exposure to floating rate debt, this means that there are substantial uncertainties around the likely timing and extent of the upcoming slowdown in household spending.
- Third, the RBA has repeatedly remarked that in determining how much higher rates would need to go, it would be paying close attention to the data, and in particular to trends in household spending, the outlook for inflation and the labour market, and developments in the global economy.
The RBA’s data-driven world
While the RBA referenced all three of these factors in its commentary this week, the key change relative to February relates to the subsequent flow of data. A separate section below provides a more detailed review of most data releases from the previous week, but from the perspective of the monetary policy story, several key developments have influenced the central bank’s thinking:
- On the inflation front, the monthly CPI indicator for January 2023 showed the annual rate of inflation falling from 8.4 per cent in December 2022 to 7.4 per cent in January. This supported the RBA’s view that headline inflation likely peaked in the December quarter of last year. While the monthly indicator is an experimental one and not without its problems (the ABS suspended publication of its monthly estimate of underlying inflation in December, after identifying that the monthly version was not providing a reliable indicator for the quarterly measure, for example), it did suggest that the slowdown in global goods inflation seen in much of the world economy through the end of last year is now underway in Australia, too.
- In terms of growth and household spending, the December quarter 2022 national accounts showed the quarterly pace of real GDP growth easing to 0.5 per cent (seasonally adjusted), down from 0.7 per cent in Q3:2022 and 0.9 per cent in Q2:2023. Sitting behind that number were indications of a softening in household spending. Household consumption rose by just 0.3 per cent over the quarter (and declined in per capita terms) while both nominal and real disposable incomes fell and the household saving rate dropped down to below its pre-pandemic average.
- With respect to the labour market, the January labour force numbers showed employment falling by 11,500 and the unemployment rate rising to 3.7 per cent from 3.5 per cent in December. As noted at the time, we should probably be careful not to read too much into the January data, with the ABS cautioning that a larger than usual rise in unemployed people that month was also accompanied by a larger than usual rise in the number of unemployed people with a job to go to in future, indicating that the typical seasonal churn may have been atypically large this year. Also, at a sub-four per cent unemployment rate, the labour market remains extremely tight. Still, there are other signs that the degree of labour market tightness is easing. For example, the latest Labour Account data show the vacancy rate falling from its record high of 3.2 per cent in the September quarter 2022 to 2.8 per cent in the December quarter.
- Similarly, there is still no evidence of any dramatic acceleration in wage growth, with the RBA governor noting that recent data ‘suggest that the risk of a prices-wage spiral remains low.’ For example, the December quarter 2022 wage price index (WPI) rose by 3.3 per cent over the year. While that was the strongest annual growth since Q4:2012, it was also below both RBA and market forecast of 3.5 per cent. More recently, the national accounts measure of average earnings per head rose by 4.2 per cent over the year in the December quarter, while the hourly rate increased by just 2.5 per cent. According to Governor Lowe, wage growth at its current pace is consistent with the inflation target.
This data-driven approach to policy is set to continue in the lead up to next month’s RBA meeting and will determine whether we get another 25bp increase on 4 April or a pause. As a guide on what to watch, in the Q&A following his speech this week, Governor Lowe highlighted what he called ‘four really important pieces of data’ that the board would consider at its next meeting: the upcoming labour force, monthly CPI, and retail spending releases from the ABS and the NAB business survey. He continued:
‘…if collectively they suggest that the right thing is to pause, then we’ll do that, but if they suggest that we need to keep going, then we’ll do that…So we have a completely open mind about what happens at the next board meeting.’
What else happened on the Australian data front this week?
According to the ABS, Australia recorded an $11.7 billion monthly trade surplus in January 2023, down from the near-$13 billion surplus reported last December. Imports of goods and services were up 4.6 per cent over the month, driven by a 30.9 per cent jump in the value of non-industrial transport equipment and a 10 per cent rise in industrial transport equipment. Exports were up 1.1 per cent from December, reflecting a 12.8 per cent increase in exports of metal ores and minerals.
The ANZ-Roy Morgan Consumer Confidence Index was at 79.9 in the week to 5 March 2023. That was virtually unchanged on the previous week’s result and was also the fourth consecutive week where the confidence index was among the worst 12 results since the pandemic.
ABS data on industrial disputes for the December quarter 2022 showed 69 disputes (one less than in the previous quarter), 22,200 employees involved (no quarterly change), and 21,300 working days lost (down from 28,100 in the September quarter). Over 2022 as a whole, the number of disputes was 189 (up 59 from 2021) with 197,000 working days lost (an increase of 80,400 over the year).
What did we learn from last week’s data?
As noted above, this week’s RBA messaging was informed by recent data releases, and in particular by the readings on GDP growth and inflation. In addition, the past week also brought significant updates on the labour market, the housing market, retail sales, the balance of payments and government finances.
Growth is slowing as household income is squeezed
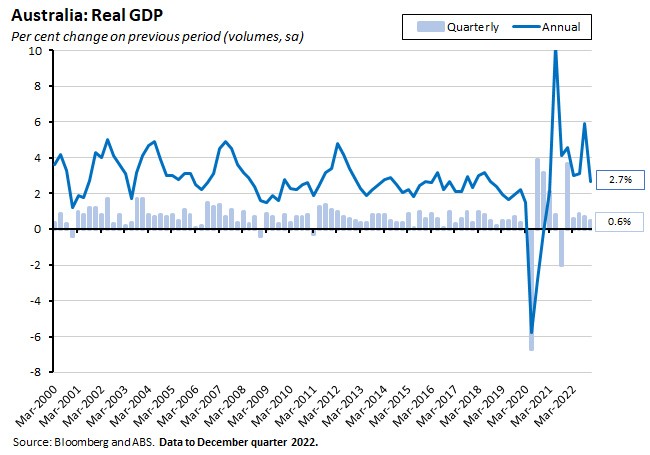
Starting with growth, the ABS reported last week that the Australian economy grew by 0.5 per cent in seasonally adjusted, chain volume terms in Q4:2022, putting real GDP up 2.7 per cent over the year. Although the December quarter result marked a fifth consecutive increase in Australia’s real GDP, it also saw a further decline in growth momentum, with the quarterly growth rate now having slowed from 0.9 per cent in Q2 and 0.7 per cent in Q3. In annual terms, growth finished last year a little above Treasury’s current estimate of an Australian potential growth rate of around 2.5 per cent.
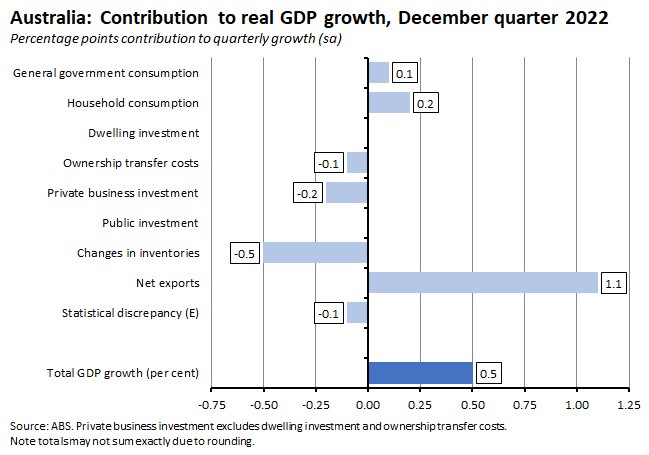
Growth across the December quarter was driven by a contribution from net exports (1.1 percentage points due to the combined impact of a 1.1 per cent rise in export volumes and a 4.3 per cent decline in import volumes over the quarter) supported by household consumption (0.2 percentage points) and general government consumption (0.1 percentage points).
Headwinds came from changes in inventories (which subtracted 0.5 percentage points from the quarterly growth rate as the Bureau noted that the decline in inventory levels reflected a fall in consumption goods imports and a draw down in inventories in coal mining in response to strong overseas demand and low production due to poor weather in parts of the country), from a fall in private business investment (-0.2 percentage points, driven by a decline in non-mining investment), and from a decline in ownership transfer costs (-0.1 percentage points from quarterly growth).
As noted earlier, the RBA is currently paying particularly close attention to developments in household spending. Here the data showed real household consumption rising by just 0.3 per cent over the quarter – the weakest quarterly increase since the Delta-variant lockdowns in Q3:2021. In per capita terms, real consumption declined.
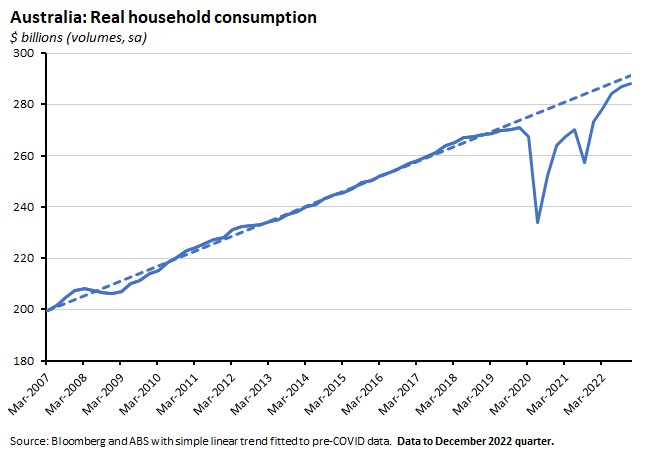
In terms of the detail, the ABS pointed out that consumers were more restrained when it came to discretionary spending on goods in particular in the December quarter, and while spending on services remained strong, there was a slowdown in the rate of growth.
Household incomes are being squeezed as growth in total income payable (up 8.9 per cent over the quarter in the largest increase since Q2:2002) has outpaced the increase in total gross income (up 1.6 per cent), leading to a 0.7 per cent fall in nominal gross disposable income. According to the ABS, interest paid on mortgages rose 23 per cent during the December quarter, following a 36.1 per cent rise in the previous period.
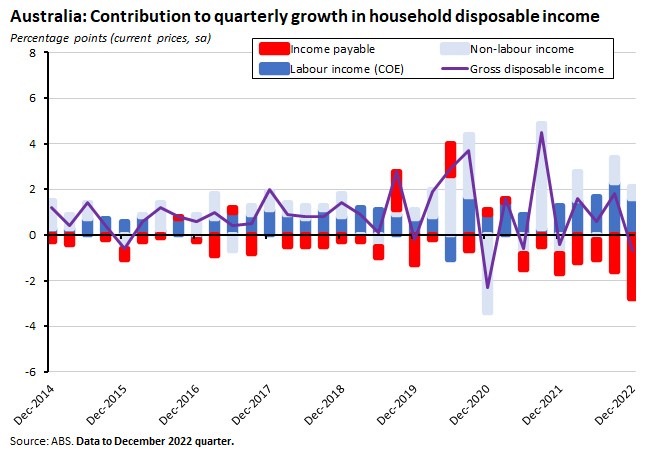
Meanwhile, high inflation rates mean that real disposable income fell for a fifth consecutive quarter.
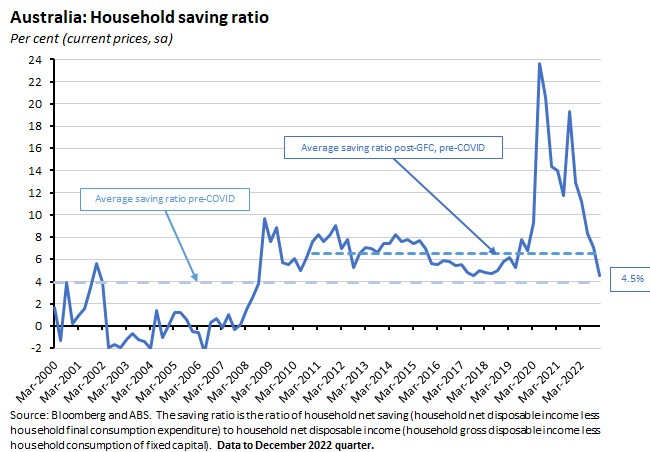
With consumption growing but disposable income falling, the December quarter also brought a further decline in the household saving rate, which fell from 7.1 per cent in the previous quarter to 4.5 per cent. That takes the saving rate down below its pre-pandemic level.
Other points of note from the national accounts release included:
- GDP per capita was flat over the quarter as output growth just kept pace with population growth, and only up 0.8 per cent in annual terms.
- Labour productivity growth was down sharply, with GDP per hour worked dropping by 3.5 per cent over the year in the weakest performance on record.
- Private gross fixed capital formation declined over the December quarter, pulled down by falls in dwelling investment (due to a decline in alterations and additions), in ownership transfer costs and in private business investment (with lower spending on non-residential construction, engineering construction and machinery and equipment).
- Compensation of employees (COE) rose 2.1 per cent over the quarter to be up 10.4 per cent over the year. Private sector COE was up 2.4 per cent, powered by increased hours worked, a rise in headcount, minimum wage increases, and market-driven increases in compensation. Public sector COE was more subdued, rising by just 0.7 per cent over the quarter.
- Price pressures remained strong: nominal GDP rose 2.1 per cent over the quarter and 12 per cent over the year, the GDP chain price index was up 0.6 per cent quarter-on-quarter and 10.3 per cent year-on-year, and the terms of trade increased by 0.6 per cent to be 7.2 per cent above their level in the December quarter 2021.
Annual CPI inflation eased to 7.4 per cent in January 2023
Turning to inflation, the ABS said the monthly Consumer Price Index (CPI) indicator rose 7.4 per cent over the year in January 2023, down from 8.4 per cent in December 2023. (The December quarter rate of annual CPI inflation was 7.8 per cent).
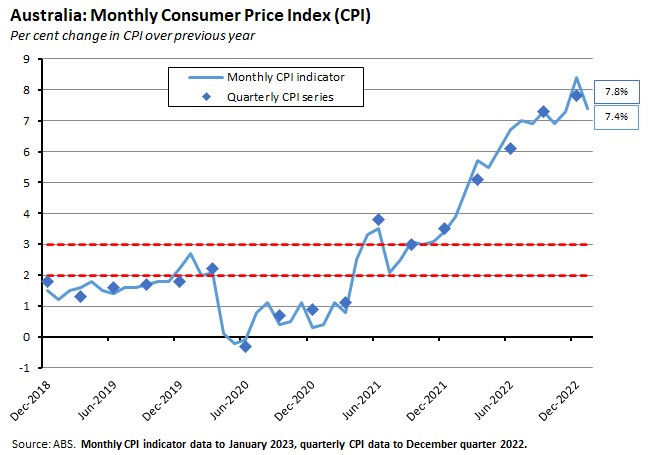
The Bureau reported that the most significant price increases in January were for:
- Housing (up 9.8 per cent). That was largely driven by a 14.7 per cent increase in new dwelling prices as builders passed on higher costs for labour and materials, plus the impact of fewer federal and state government grants. Rent prices were also up 4.8 per cent, driven by low vacancy rates. Note that while new dwelling prices are now decelerating, rents are rising more strongly.
- Food and non-alcoholic beverages (up 8.2 per cent). The ABS reported price rises across all categories due to higher wages and freight costs as well as supply disruptions.
- Recreation and culture (up 10.2 per cent). Holiday travel and accommodation rose 17.8 per cent, down from 29.3 per cent in December.
The annual rate of increase for the CPI excluding volatile items (fruit and vegetables and automotive fuel) was 7.2 per cent, compared to December’s 8.1 per cent rate. Automotive fuel prices rose 7.5 per cent – still high, but well down from their June 2022 peak of 43.2 per cent. Fruit and vegetable prices were up 5.1 per cent, down from 9.8 per cent in December.
The pace of house price decline eased sharply in February 2023
CoreLogic’s National Home Value Index fell by just 0.14 per cent over the month in February this year. That was the smallest monthly fall since May 2022 (which saw a 0.13 per cent decline) and the onset of the current RBA policy cycle. National values are now down 7.9 per cent over the year and 9.1 per cent from their recent peak (after having previously risen by 28.6 per cent from COVID trough to post-pandemic peak). Most forecasters have been tipping a total fall in house prices of around 15 per cent, which if correct would mean that we are now approaching two-thirds of the way through the projected adjustment.
Combined capital city values in February were also down just 0.1 per cent over the month, 9.1 per cent over the year, and off 9.7 per cent from their peak, while prices in Sydney actually rose 0.3 per cent over the month. CoreLogic pointed to a below average flow of new listings, as well as a rise in auction clearance rates as supporting values last month.
ABS lending data for January 2023 showed the value of new loan commitments for housing fell 5.3 per cent over the month (seasonally adjusted) to be down 35 per cent over the year. New lending to owner occupiers was down 4.9 per cent month-on-month and 35.1 per cent year-on-year, while corresponding declines in loans to investors were six per cent and 34.8 per cent, respectively. The Bureau also reported that the number of new owner-occupier first home buyer loan commitments fell 8.1 per cent over the month to its lowest level since February 2017. The value of owner-occupier housing loan refinancing between lenders also declined last month, but nevertheless remained close to record highs as borrowers continued to seek out lower interest rates.
The total number of dwellings approved fell 27.6 per cent over the month in January 2023 (seasonally adjusted) to be 8.4 per cent lower over the year. According to the ABS, the number of private sector houses approved fell 13.8 per cent over the month and dropped 12 per cent over the year. That marks a fifth consecutive drop and the lowest result recorded since June 2012. Approvals for private sector dwellings excluding houses slumped 40.8 per cent month-on-month (after having risen by 41.9 per cent in December) but were down just 0.3 per cent year-on-year.
Labour Account data indicate a slight easing in demand pressures
Data from the December quarter 2022 Labour Account showed falls in both the proportion of vacant jobs and in the number of job vacancies, albeit to still high levels as the share of vacant jobs in Australia fell to 2.8 per cent from the record high of 3.2 per cent in the September quarter. That marks the first fall in the vacancy rate since the September quarter 2021 (when the rate was 2.4 per cent) but still leaves it well above the pre-pandemic rate of 1.6 per cent. The Bureau noted that the fall in the proportion of vacant jobs was mainly the product of a decline in job vacancies, and not of an increase in total jobs in the labour market, with vacancies down by 11.2 per cent. Even so, job vacancies remained 94 per cent higher than in the pre-pandemic March quarter 2020.
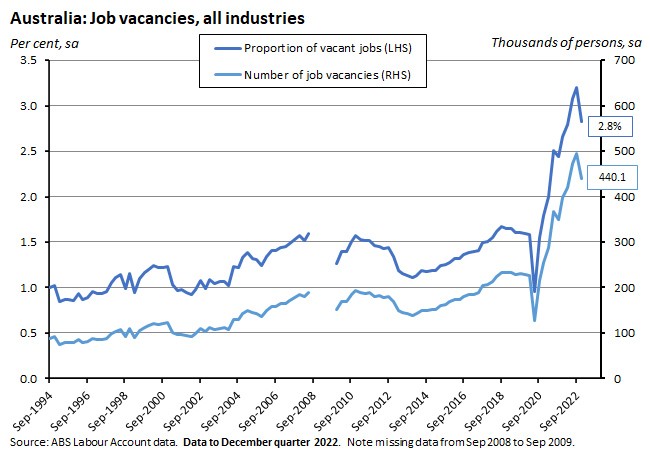
Vacancy rates were also down across 13 of the 19 industries tracked by the ABS, although again the share of vacancies across all industries remained above pre-pandemic levels.
The Labour Account also reported another rise in the rate of multiple job-bolding, which rose to 6.6 per cent in Q4:2022, the highest recorded in the history of the series, which is consistent with a labour market still running hot.
Retail sales rose in January 2023
The ABS said retail sales rose 1.9 per cent over the month in January 2023 (seasonally adjusted) to be 7.5 per cent above their level in January 2022. That extended a volatile period for retail trade, including a four per cent fall in monthly sales in December 2022. Turnover is now back to a similar level to that prevailing in September 2022. The Bureau also noted that an increase in the popularity of Black Friday sales and growing cost of living pressures had disrupted the usual (strongly seasonal) pattern of sales seen in November, December and January.
Australia recorded a current account surplus of $14.1 billion in Q4:2022
Australia’s current account surplus rose by $13.4 billion to $14.1 billion (seasonally adjusted) in the December quarter of last year, up from a revised surplus of $0.8 billion in the September quarter. That was far larger than the median market forecast of a $5.5 billion surplus. The ABS said the increase reflected the combined impact of a rise in the trade surplus and a decline in the net primary income deficit.
The surplus on goods and services trade rose from $31.5 billion in Q3:2022 to $40.9 billion in Q4:2022, an increase of almost $9.5 billion that took the surplus to the second highest on record. The goods trade surplus increased by more than $5 billion as exports were lifted by a rise of $2.8 billion in sales of metal ores and minerals while import values fell, pulled down by a $1.6 billion drop in imports of fuels and lubricants due to lower prices and volumes. The services deficit shrank by $4 billion over the quarter as travel services credits rose by $1.9 billion due to rising numbers of international student and visitor arrivals while imports of transport services sank by $1.5 billion.
The net primary income deficit fell from its record high of $30.4 billion in the September quarter to a still elevated $26.4 billion in the December quarter as high commodity prices and the resultant profitability of the Australian resource sector continue to underpin outflows to foreign investors.
The capital and financial account recorded a deficit of $10.1 billion in the quarter, driven by a financial account deficit of $9.9 billion (including a $28.2 billion net outflow of equity and a $18.3 billion net inflow of debt). The Bureau noted that deposit-taking institutions contributed $22.9 billion to net debt inflow as Australian banks sought offshore funding in preparation for the repayment of funds borrowed through the RBA’s Term Funding Facility (TFF).
Australia’s net international investment position at the end of last year was a liability of $856.8 billion, down $3.1 billion from a revised liability position of $859.9 billion in the September quarter.
The general government sector ran a net operating surplus of $12 billion in Q4:2022
According to the latest ABS Government Finance Statistics, the general government net operating balance rose $27 billion to a surplus of $12 billion in the December quarter of last year, up from a deficit of $14.9 billion in the previous quarter. Tax revenues were up almost 18 per cent over the quarter (and total general government revenues up 14.7 per cent) while total expenses rose 1.1 per cent.
Other things to note . . .
- The RBA’s March 2023 Chart Pack.
- The ABS lists 12 things that happened in the Australian economy in the final quarter of last year.
- The upgraded 2022-23 Tax Expenditures and Insights Statement from Treasury. Robert Breunig has some health warnings on interpreting the data.
- The Grattan Institute has views on how to improve Australia’s migration system.
- Jim Stanford says Australia’s inflation problem reflects booming corporate profits. But Richard Holden argues that the pressure on the labour share of income is largely a product of technology.
- An Andrew Leigh speech on how uncompetitive markets hurt workers. Related, this new working paper from Treasury (cited by Leigh) looks at the relationship between labour market concentration and low wage growth in the pre-pandemic Australian economy. Interestingly, the author finds that on average, labour markets have not become more concentrated over time, but that since the 2010s the impact of a given level of concentration on wage growth has increased. The hypothesis is that a decline in firm entry in particular has lowered competition for labour amongst incumbent firms, leading to lower wage growth.
- The PBO has a budget explainer on indexation and the Australian budget. In times of higher inflation, the budgetary impact of indexation (adjusting the value of government programs in line with changes in prices, wages or living costs) becomes more important. In the October 2022-23 budget, for example, the PBO reckons that indexation contributed more than 25 per cent of the total increase in forecast expenses over the forward estimates, which was more than the impact of policy decisions.
- The IMF Article IV report on Australia and the accompanying Selected Issues Paper with its reports on inflation and wage dynamics and on climate mitigation policies, are worth a read.
- The March 2023 issue of the IMF’s Finance & Development magazine considers the future of monetary policy including essays on monetary policy in a changing world, new models for policy, the case for limiting central bank mandates, and why IMF forecasters got inflation wrong.
- The latest BIS quarterly review is available.
- In the FT, Andy Haldane (former chief economist at the Bank of England) proposes that central banks need to be more flexible when it comes to their inflation targets, by extending the time horizon over which they seek to return inflation to target. AFR version.
- The WSJ sets out how base effects will influence inflation data a year on from the Russian invasion of Ukraine, as comparisons with a period of unusually high prices are set to send annual inflation rates tumbling.
- Related, FiveThirtyEight explains why US economic indicators are sending confusing signals.
- William Davies analyses the Reaction Economy.
- Aswath Damodaran has a warning for corporate debtors: the return of interest rates to pre-2008 levels means that firms that borrowed to capacity (or beyond) while rates were low are now at risk.
- The NY Fed considers the US dollar’s imperial circle. Not only is the greenback the world’s dominant currency, but this dominance means swings in its value influence global macro trends. For example, a tightening of US monetary policy results in US dollar appreciation, leading to a contraction in global manufacturing activity led by emerging markets that also spills back into US manufacturing. This in turn leads to a fall in global commodity prices and a decline in world trade. With the US less exposed to global developments than many of its partners, this then leads to a further strengthening of the greenback.
- Related, Herman Mark Schwartz on money, empire and Charles P Kindleberger.
- The Black Death and the onset of modern economic growth in England.
- A tribute to the ideas of Paul David. His famous paper on Clio and the economics of QWERTY is one of economics’ most cited articles. Another much-cited work is The Dynamo and the Computer.
- Lionel Barber on the Bonfire of the consultancies (link no longer accessible).
- A new CEPR e-book on nation building.
- The inside story on ChatGPT from MIT Technology Review.
- Five ways the Universe could end.
Finally, a roundup of some of my favourite podcast episodes from the past couple of weeks: The FT’s Martin Wolf in conversation with former Bank of England governor Mervyn King about Wolf’s new book on The Crisis of Democratic Capitalism; Tyler Cowen and Brad Delong discuss Delong’s economic history of the 20th century, Slouching Towards Utopia; and Ezra Klein talks to Sci Fi author Adrian Tchaikovsky about the minds of spiders, octopuses and AI.
Latest news
Already a member?
Login to view this content


