So, why is the RBA signalling yet more interest rate hikes, even though it thinks inflation has probably peaked, unemployment is on the rise and house prices are currently undergoing their largest and fastest fall since at least 1980?
Before answering that question, my apologies that this first regular weekly email has been delayed until today. That’s set to continue next week, as I will be attending AGS 2023 (by the way, if you spot me and have some spare time, please do come and say hello – it’s lovely to meet readers!). Hopefully, normal email service will resume the following week.
Until then, I thought it would be useful to provide an update on where we’re at on the Australian economic front, some two months into 2023. Since I took a look at the unexpectedly positive start to the year for the international economy in my webinar late last month, the focus will be on recent developments in the domestic economy in general, and on inflation, interest rates and the RBA in particular.
For those disinclined to wade through all the detail below, the quick version is that the near-term domestic outlook is still dominated by prospects for monetary policy, as the RBA continues to navigate its narrow path between inflation and recession. The important news here is that a surprisingly strong Q4:2022 reading on underlying inflation has prompted Martin Place to become more hawkish on the likely trajectory of the cash rate, signalling that several more rate increases will be needed to tame price pressures. As a result, the likely peak cash rate is now set to be at least 3.85 per cent. That in turn has increased the risk around future levels of economic activity.
That doesn’t mean a recession is inevitable - while the growth outlook has weakened in line with the prospect of additional rate hikes, a soft landing remains possible. But it does imply that, all else equal, the risk of a recession has risen, as the more the RBA feels compelled to raise rates, the greater the pressure on Australia’s household sector in particular. Key factors to watch over the coming months, therefore, include not just inflation but also trends influencing both the duration of the RBA tightening cycle and the likely resilience of the economy to that tightening. That includes developments in cost pressures, especially wages; measures of household confidence, consumer spending and the housing market; and the health of the labour market.
So far, some of those other numbers are telling us that:
- Household sentiment is very weak, reflecting rising interest rates and high inflation.
- There are some signs consumer spending is softening, although lower volumes have been offset by higher prices and services spending has held up.
- House prices are undergoing a large and rapid fall, albeit from very elevated levels.
- The labour market is easing, with unemployment tracking higher and two consecutive labour market reports surprising to the downside.
- And although nominal wage growth has picked up to more than three per cent, there is still no evidence of any significant wage-price spiral. Meanwhile, real wages continue to slump.
We also take a quick look below at recent data on the budget position and net overseas migration – both of which have been running stronger than expected.
(Much) more detail below for those who would like a deeper dive.
This week on The Dismal Science podcast, we catch up on all the Reserve Bank news. How high will interest rates go? What could RBA Governor Philip Lowe have done differently? And is the Reserve Bank's independence in jeopardy?
Underlying inflation surprises to the upside Q4:2022
On 25 January this year, the ABS published the Q4:2022 Consumer Price Index (CPI). According to the Bureau, the headline CPI rose 1.9 per cent over the December quarter to be up 7.8 per cent over the year, a significant increase from the 7.3 per cent annual rate recorded in the previous quarter. The December quarter’s annual result was also the highest rate of inflation seen in Australia since Q1:1990. But while the headline rate was a bit stronger than the median market forecast of a 7.6 per cent annual print, it was still below the RBA’s forecast of an eight per cent increase, as presented in the November 2022 Statement on Monetary Policy (since revised in the February 2023 edition).
Rather than the headline rate, it was the underlying rate of inflation as measured by the trimmed mean that grabbed Martin Place’s attention, rising by 1.7 per cent over the quarter and 6.9 per cent over the year. That annual rate was the highest in the official history of the data series (the ABS started publishing estimates in 2003) and was well above both the market consensus forecast of a six per cent rate and the RBA’s November 2022 projection of a 6.5 per cent increase.
Prompting the RBA to become more hawkish
The RBA delivered its first monetary policy decision of the year on 7 February, announcing it would increase the target cash rate by 25b to 3.35 per cent. That was the ninth consecutive RBA rate hike and took the cumulative monetary policy tightening to date to 325bp (remember, the cash rate target was just 0.1 per cent before the central bank delivered its initial rate hike back in May 2022).
A 25bp rate increase at the February meeting had been widely anticipated. What came as a surprise, however, was the tone of the accompanying commentary, and in particular the statement that:
‘The Board expects that further increases in interest rates will be needed over the months ahead to ensure that inflation returns to target and that this period of high inflation is only temporary.’
That message, together with the decision to drop the qualification (used for example in the statement accompanying the December 2022 meeting) that the RBA was ‘not on a pre-set path’, led RBA-watchers to interpret the central bank as signalling that it had decided that at least another two rate hikes would be needed over coming months, regardless of data flow. Market pricing adjusted accordingly, and at the time of writing was consistent with a peak cash rate of around 4.2 per cent, implying that either a further 75bp or 100bp of tightening could be in store.
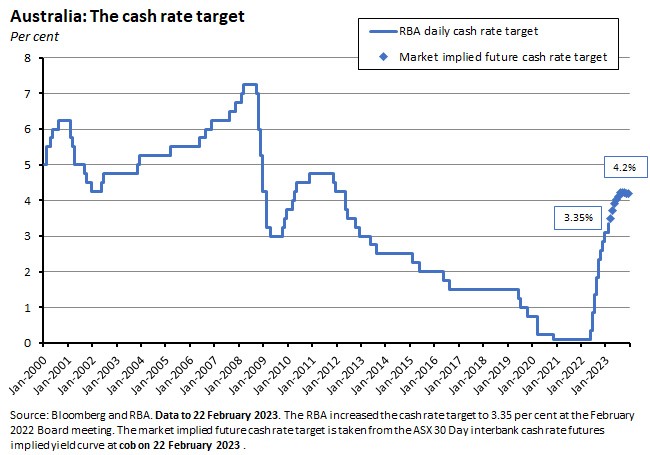
My expectation through the end of last year had been for a peak cash rate of either 3.6 per cent or 3.85 per cent, but now a range of 3.85 per cent to 4.1 per cent looks more likely.
RBA testimony and minutes highlight inflation risk
The shift in tone from the RBA was driven by the Q4:2022 inflation data in general and by the strong rise in underlying inflation in particular. When RBA Governor Lowe spoke to the House of Representatives Standing Committee on Economics on 17 February, he explained that the December inflation report had included two ‘surprises’ for the central bank.
- First, the difference between the global and Australian experience with regard to goods prices. At the global level, a ‘normalisation’ in economic conditions across supply chains, shipping costs and commodity prices had already led to a marked slowdown in the pace of goods inflation. In contrast, in Australia there was no equivalent moderation of goods price inflation in the December quarter. Instead, there were strong quarterly price gains for clothing and footwear, for nondurable housing goods and for durable goods.
- Second, many services prices were also rising strongly, driven by holiday travel, meals out and takeaway food. Services inflation in Q4:2022 was the strongest since 2008.
These surprises, Lowe said, had prompted ‘an evolution rather than a revolution’ in the central bank’s thinking, and this shift:
‘…largely reflected the outcome in the December quarter CPI. We had expected underlying inflation to be around 6½ and it turned out to be 6.9. That’s a big difference…when we went through the details about what was driving that, we could see areas in the economy where there was strong demand, and that was pushing up prices…we need to respond to that with further monetary policy targets, and we wanted to make it clear to the community that we were not done yet.’
Unsurprisingly, the Minutes of the 7 February RBA Monetary Policy meeting, released this week, are consistent with this story. They too note that the December quarter’s inflation outcome suggested more near-term underlying domestic inflationary pressure than the RBA had previously anticipated, in turn implying strong domestic demand relative to the economy’s supply capacity. Although the RBA still thinks that inflation peaked last quarter, it does not yet have the data to confirm this, and in that context, the case for further increases in the cash rate was that:
‘The recent inflation data had suggested more breadth and persistence in inflation than had been expected and that strong demand was leading to price increases in some parts of the economy. While inflation was expected to decline, there was a risk that it could persist at an uncomfortably high level, which would entail longer term costs.’
Other factors cited as supporting a rate hike included that Australia’s cash rate target was still below the level of policy rates in many comparable economies, Australia’s positive exposure to higher commodity prices, and extra savings buffers accumulated by local households that were estimated to be relatively larger than in other countries. The fact that wage growth in Australia remained lower than elsewhere was a partial offset. (The minutes also noted that the cash-flow channel of monetary policy in Australia was likely stronger than in other countries, given our high level of variable rate household debt, although the overall impact of monetary policy on inflation was thought to be similar.)
In another significant sign of the hawkish shift in the RBA’s thinking, the minutes reported that the board had only debated between a 25bp and a 50bp rate hike, dropping any consideration of the third option – a pause in the rate hike cycle – that had been discussed in the previous December 2022 meeting. The argument for a more aggressive 50bp move reflected ‘a pattern of incoming prices and wages data exceeding expectations, and a risk that high inflation would be persistent’ while the case for the smaller 25bp hike recognised the likelihood that inflation had peaked, that prospects for consumption had softened, that there had already been a significant cumulative tightening of policy, and that the overall outlook remained uncertain. The board considered that the case for a 25bp move was also boosted by the opportunity provided for further regular adjustments by the RBA’s calendar of monthly meetings.
RBA sets out new growth, inflation forecasts
Additional insight on the RBA’s thinking was provided by publication of updated economic forecasts in the February 2023 Statement on Monetary Policy (SOMP). Key changes worth noting included:
- A modest adjustment to the forecast headline rate of annual CPI inflation. This is now projected to slow to 6.75 per cent by the June quarter of this year and then to continue to fall, dropping to 4.75 per cent by the December quarter, 3.5 per cent by the June quarter of next year, 3.25 per cent by the December quarter of 2024, and three per cent by the June quarter of 2025. Relative to the forecasts in the November 2022 SOMP, headline inflation is projected to be half a percentage point higher in Q2:2023 but 0.75 percentage points lower in Q2:2024. The former change reflects the stronger than expected inflation outcome last quarter, while the latter recognises the disinflationary impact of the government’s Energy Price Relief Plan.
- A larger adjustment to the forecast path for the underlying rate of inflation (the trimmed mean). This is projected to ease to 6.25 per cent by the June quarter this year, before falling to 4.25 per cent in the December quarter and then dropping again to 3.25 per cent by the June quarter of 2024. By the December quarter of next year, underlying inflation is forecast to be back to three per cent and to still be there by the June quarter of the following year. Compared to the previous set of RBA forecasts, the new projections have underlying inflation higher through 2023 but slightly lower from 2024 onwards.
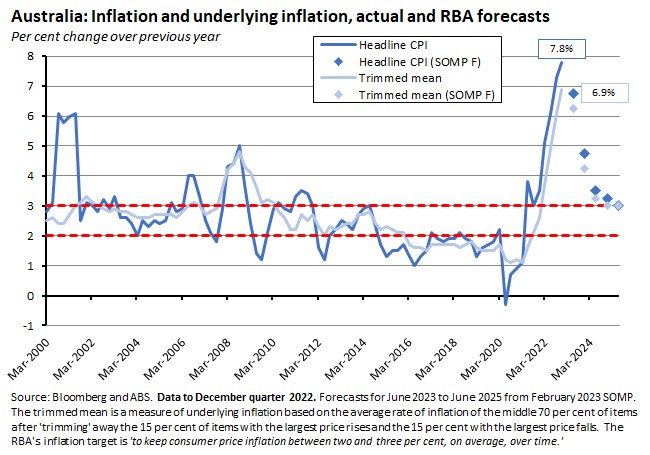
- Sitting behind those inflation projections, the RBA thinks goods price inflation will moderate, following (if lagging) the trajectory seen overseas. But services inflation is forecast to be more stubborn. Key to this judgment is the RBA’s view that labour cost growth will pick up strongly over the coming year and remain high across the forecast period, driving cost pressures for labour-intensive services. Rental price inflation, which has already accelerated, is also expected to rise further over the coming year reflecting low vacancy rates.
- The RBA has trimmed its forecast for economic growth. It now thinks GDP growth will average 2 per cent in 2023 (down from 2.75 per cent in the November 2022 SOMP) and just 1.5 per cent next year (no change to the forecast). Consumption will be pulled down by higher interest rates, high inflation, and falling wealth due to lower house prices.
- The unemployment rate is forecast to rise to 3.75 per cent by the December quarter of this year, and then to continue to climb, rising to 4 per cent by the June quarter 2024, to 4.25 per cent by the December quarter 2024, and to 4.5 per cent by the June quarter 2025. That trajectory is unchanged from the previous SOMP.
- Despite higher unemployment, the SOMP sees wage growth (as measured by the wage price index or WPI) accelerating to 4.25 per cent by late 2023, before slowing to 3.75 per cent by mid-2025.
The bottom line, then, is that the RBA thinks it can return inflation to the top of the target band by 2025 and do so at the cost of considerably slower growth but no outright recession and only a moderate rise in unemployment (a one percentage point rise in joblessness is far from trivial but would leave the rate comfortably below the 5.1 per cent reported in December 2019, pre-pandemic).
Note that these RBA forecasts made then are based on a technical assumption that the RBA cash rate would move in line with market pricing and market economists’ expectations at the time of the forecast. They implied a peak cash rate of around 3.75 per cent in the second half of this year, falling to around three per cent by mid-2025. But as we’ve noted above, the RBA seems to be signalling that the actual peak is likely to be higher than this.
February’s SOMP also contains an interesting discussion (in Box C) on the relative importance of supply and demand factors driving inflation in Australia over the past year. It concludes that at least half and up to three quarters of that inflation reflected a range of supply shocks – international supply disruptions due to the war in Ukraine and pandemic-related disruptions before that, and domestic supply disruption due to poor weather.
Watching the household sector
That February 2023 SOMP forecast of a (relatively) soft landing for the Australian economy is hostage to a range of forces, including the threat of more shocks to the global economic environment. Closer to home, the central bank will be paying particular attention to household consumption and to the labour market and wage-setting behaviour. In the case of the former, three data developments over the past month or so are worth highlighting.
First, consumer confidence took a large hit from the RBA’s rate hike and hawkish tone. This was apparent in the Westpac-Melbourne Institute Consumer Sentiment reading for February. The sentiment index slumped by 6.9 per cent, falling to a reading of just 78.5. That took sentiment back down below the GFC low point and close to the lows seen during the early phase of the pandemic.
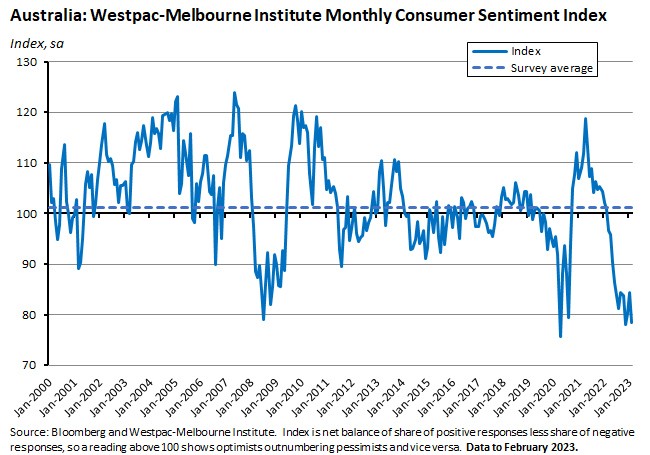
The survey spanned the week of the RBA decision, and while sentiment amongst those surveyed before the meeting was only down a little on the January survey result (83.5 vs 84.3), sentiment amongst those surveyed after the meeting slumped to 74.8.
Will that pessimism translate into a sharp slowdown in spending and therefore overall activity? As readers will recall, one recurring theme from last year was the gap between very soft consumer sentiment indicators and relatively robust consumer spending. A potential explanation for this discrepancy was the role played by ‘excess’ household savings accumulated during the pandemic, which the RBA estimates are currently equivalent to 20 per cent of household disposable income. Granted, these savings are unevenly distributed, but that nevertheless leaves a big aggregate buffer for consumption in place.
One sign that the anticipated squeeze on household spending may now be underway was the sharp 3.9 per cent monthly decline in retail sales in December 2022 (a far bigger drop than the market consensus for a mere 0.2 per cent fall). That was the largest monthly fall since August 2020 when Victoria was entering lockdown. It was also the only monthly decline recorded across 2022, following 11 consecutive monthly increases. The data for the December quarter also showed the volume of retail sales falling 0.2 per cent in their first quarterly decline since Q3:2021.
Household spending will also be influenced by negative wealth effects from falling house prices. Here, the latest data from CoreLogic showed national home values fell one per cent over the month in January 2023, with combined capitals values sliding by 1.1 per cent. National prices have now fallen 7.2 per cent over the year and 8.9 per cent from their recent peak, while capital city prices are down 8.7 per cent in annual terms and 9.6 per cent from their peak.
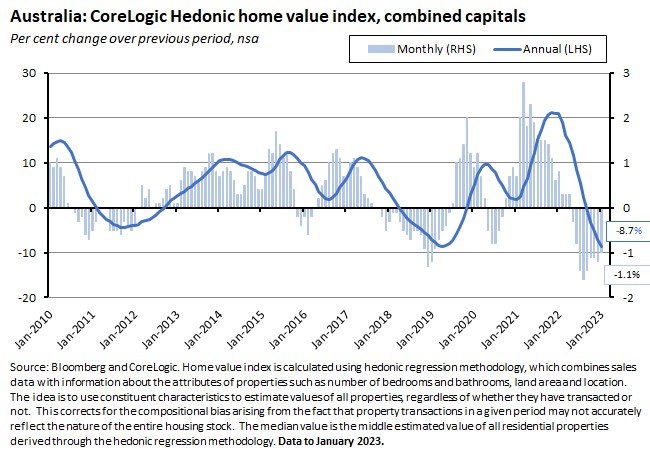
While there is some sign that the pace of monthly price falls has eased, CoreLogic also reported that January set a new record for how much and how fast dwelling values have fallen in Australia, noting that the 8.9 per cent fall in the national home value index was the largest and fastest decline in values since at least 1980, when CoreLogic’s records begin. Of course, that fall also has to be seen in the context of prior COVID-era trough-to-peak growth of more than 28 per cent.
Watching wages and the labour market
Turning to the labour market, the latest data releases have suggested some downside risk to the RBA’s forecasts for unemployment and wage growth. For example, the January 2023 labour market report showed the unemployment rate rising to 3.7 per cent (on a seasonally adjusted basis) from 3.5 per cent in December vs the median market economist forecast for no change. The unemployment rate now looks to have bottomed at 3.4 per cent in October last year and to be moving higher.
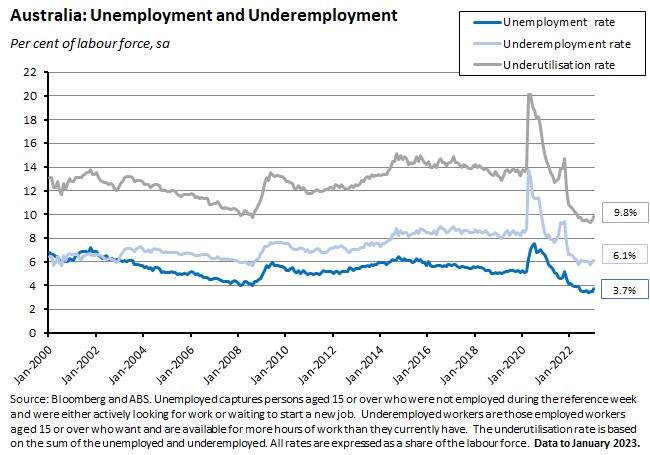
The underemployment rate also edged up last month, taking the underutilisation rate to 9.8 per cent.
Likewise, employment surprised to the downside in January, falling by more than 11,000 persons compared to a consensus forecast for a 20,000 increase. That marked a second consecutive fall after a (downwardly revised) 20,000 fall in employment in December.
We should probably be careful not to read too much into the January data. The ABS cautioned that the larger than usual rise in unemployed people last month was also accompanied by a larger than usual rise in the number of unemployed people with a job to go to in future, suggesting that the January seasonal churn may have been unusually large this year. But if February’s labour market results were again to disappoint, that would be a strong signal that labour market softening is progressing faster than the RBA currently expects.
That in turn would have implications for the wage growth forecasts that help underpin the outlook for services inflation. Here, this week’s data release showed the annual rate of increase in the WPI climbed to 3.3 per cent (seasonally adjusted) in the December quarter of last year. That was the strongest rise since the final quarter of 2012 and was also up on the September quarter’s 3.2 per cent print. Even so, it was softer than the RBA’s updated forecast for 3.5 per cent growth, which was also the market consensus forecast. That was partly because, although private sector wages grew at an annual rate of 3.6 per cent (the fastest since Q3:2012), public sector wages rose at a much more modest 2.5 per cent (their highest rate since Q2:2019). According to the WPI data, then, there is no sign yet of a dramatic wage break out that would be inconsistent with the RBA’s inflation target, or of the dreaded ‘wage-price spiral’.
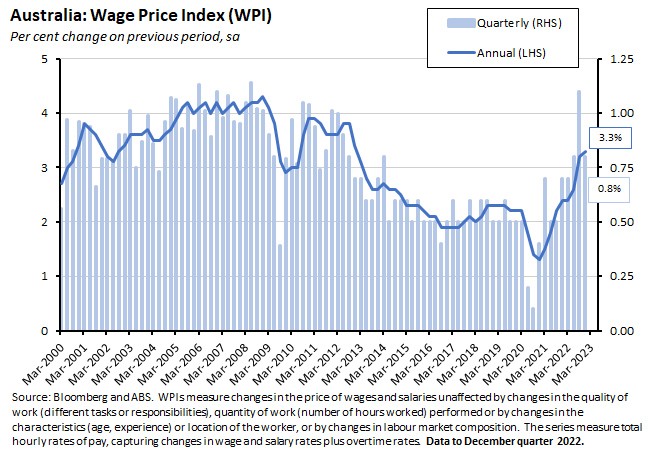
This week’s ABS data on average weekly earnings are consistent with this. Over the year to November 2022, average weekly full-time adult ordinary time earnings rose by 3.4 per cent (seasonally adjusted), while all employees’ average weekly total earnings rose by 3.7 per cent. (Unlike the WPI, these earnings figures are influenced by changes in the composition of employment as well as by changes in the level of individual earnings). Trend growth in full-time average earnings at 3.4 per cent was the highest since May 2020 (when the result was distorted by the pandemic-driven exit of low wage workers) and before that since May 2013 but remains below 4 per cent.
At these rates, growth in both the WPI and in average weekly earnings are also well below the inflation rate, indicating an ongoing contraction in real wages and another headwind for consumption spending.
What else has happened on the Australian data front?
There are two other developments on the data front worth noting - the first relating to the fiscal position and the second to net overseas migration.
A better budget picture due to higher receipts
According to the Department of Finance’s latest monthly Financial Statements, the underlying cash balance recorded a cumulative deficit of $14.7 billion over the year to 31 December 2022. That was comfortably below the October 2022-23 budget profile which called for a deficit of $26.2 billion – an $11.5 billion improvement.
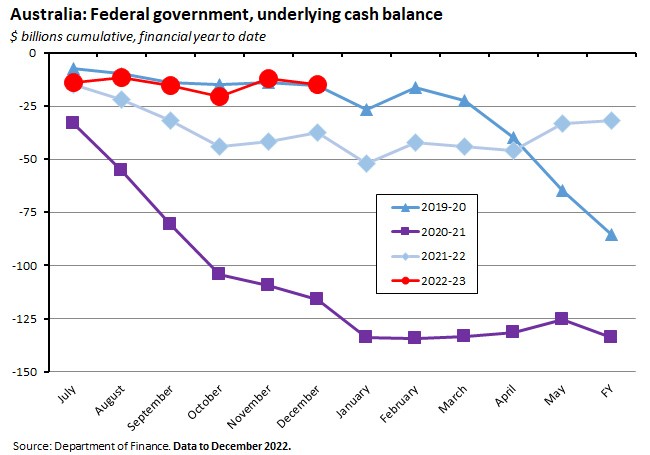
That outperformance is mainly because receipts have been running ahead of budget expectations ($298.2 billion vs $289.4 billion), powered in part by higher than anticipated income and company tax receipts. That in turn is because employment incomes have been stronger than the budget estimates, as have bulk commodity prices with the exception of the oil price. Payments have also been lower than projected ($312.9 billion vs $315.7 billion).
Rapid recovery in net overseas migration
Data released late last year showed that after recording an outflow of almost 85,000 people in 2020-21, net overseas migration rebounded to an inflow of about 170,900 people in 2021-22.
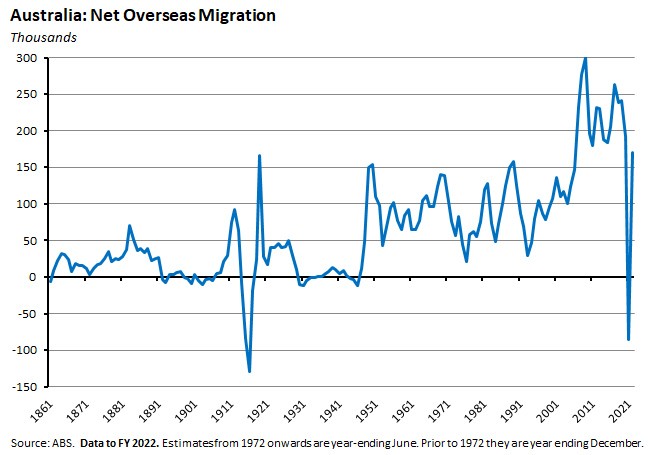
Since then, the monthly data on arrivals and departures suggests that the rebound in migration – and consequently in population growth – has been sustained. Total arrivals in December 2022 reached 1.3 million, compared with less than 300,000 in the first month of last year, and preliminary figures show that number continued to rise through January of this year. Inflows of international students and working holidaymakers have resumed, with temporary migration overall recovering faster than anticipated by Treasury’s earlier forecasts. That in turn should have implications for skills and labour shortages and for the level of labour market tightness.
Latest news
Already a member?
Login to view this content


