

 This product has already been purchased.


Overview
- At its meeting next week, the RBA’s Monetary Policy Board is widely expected to vote to increase the cash rate target to 4.6%. Higher oil prices and hawkish central bank rhetoric underpin the assessment.
- The August 2026 labour force data delivered a surprise increase in the unemployment rate, which rose from 4.5% in July to 4.6% last month. But this evidence of labour market loosening was set against a stronger-than-expected employment outcome, a fall in the underemployment rate, a rise in hours worked, and increases in the participation rate and the employment to population ratio as the labour market continued with its recent habit of sending mixed signals.
- According to the latest Intergenerational Report, IGR2026, the next 40 years are set to see slower population growth, slower productivity growth, and slower economic growth than the previous 40.
- Relative to its predecessor, IGR 2023, the new report is more positive on the outlook for debt and deficits, in part thanks to the changes announced in Budget 2026. But those projections rely on productivity growth recovering from its current lacklustre performance.
This week we look ahead to the upcoming Monetary Policy Board (MPB) meeting, where a mix of higher energy prices and hawkish central bank rhetoric are widely expected to combine to deliver the year’s fourth increase in Australia’s policy rate.
We also consider another set of mixed messages from the Australian labour market, which saw the unemployment rate rise to 4.6% last month, even as employment growth beat expectations, the underemployment rate fell, and hours worked rose.
Then we turn our attention to the new Intergenerational Report (IGR 2026) and the latest attempt to imagine Australia’s economic future over the next 40 years. As has been the case with previous editions, the IGR’s numbers rest on what look to be quite optimistic productivity assumptions when set against actual outcomes. But this time the authors can cite the AI revolution as justification, even as that same AI revolution potentially represents the kind of shock that can dramatically disrupt the trend-based analysis that underpins the IGR’s analytical approach. Finally, we conclude with the usual roundup of suggestions for further reading and listening.
The RBA is expected to increase the cash rate target next week
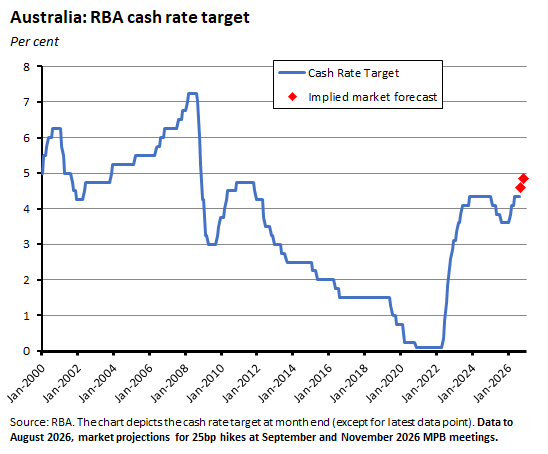
Markets and RBA watchers alike are increasingly confident that the MPB will vote to increase the cash rate target next week to 4.6%, although there is some speculation that this could involve a split vote. Another 25bp hike would take the policy rate to its highest level since end-October 2011 (the then RBA Board decided to cut the cash rate from 4.75% to 4.5% on 1 November 2011).
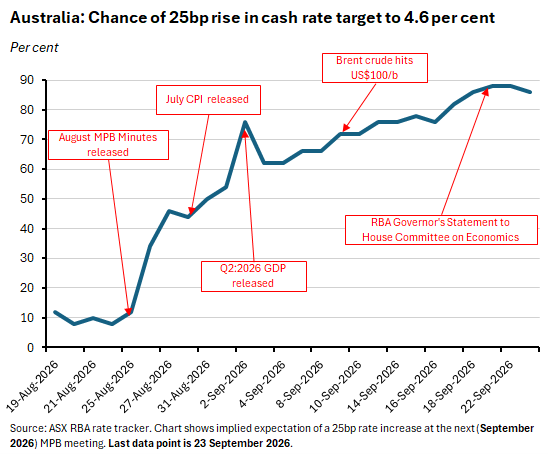
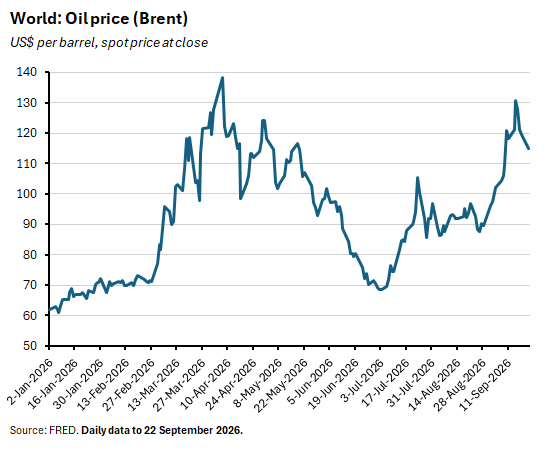
As discussed in last week’s note, the recent increase in oil prices is a large part of the story. And despite some retreat over the past week, at the time of writing spot prices remained well above US$100/barrel.
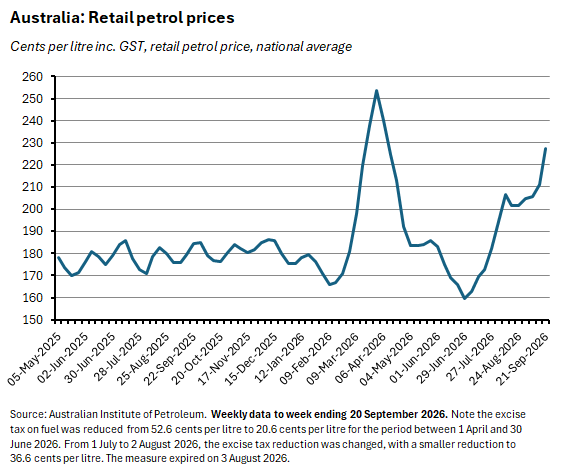
Higher global energy prices have fed into higher domestic fuel prices, in turn putting pressure on input costs as well as on households’ short-term inflation expectations.
Markets have also noted that RBA staff, from the Governor down, have been sounding rather hawkish in their recent public appearances while conspicuously refraining from any attempt to push back against the market narrative of an incoming rate hike.
Indeed, the consensus is now increasingly minded to think that a vote to increase the cash rate target on 29 September could be followed by another such vote on 3 November. If so, that would see the cash rate target at 4.85%, its highest level since late 2008 (just before the RBA cut the policy rate by 100bp from 5.25% to 4.25% on 2 December that year).

Australia’s labour market continues to loosen, sort of
According to the ABS August 2026 Labour Force report, Australia’s seasonally adjusted unemployment rate rose from 4.5% in July this year to 4.6% last month, an increase of 0.2ppts once the impact of rounding is considered. On a trend basis, the unemployment rate also rose from 4.5% to 4.6%.
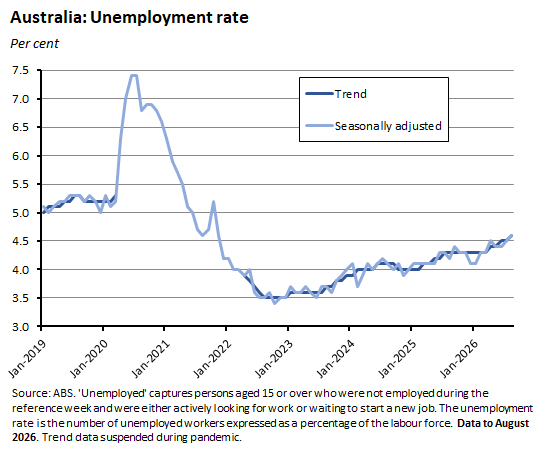
Given that the market had expected the unemployment rate to remain unchanged at 4.5%, while the RBA’s August 2026 Statement on Monetary Policy only expected the rate of joblessness to reach 4.6% by the June quarter of next year, this offered further evidence that the labour market could be easing at a faster than expected rate. That should be good news for Martin Place, given that the Governor is, somewhat controversially, on record as saying that she thinks a higher unemployment rate of ‘between 4.5 and 5 will probably take enough heat out of the labour market that it'll ease pressure on inflation.’
Once again, however, the labour force numbers sent mixed messages. Although the unemployment rate rose, the underemployment rate fell, easing from 6.3% to 6.2%. That left the underutilisation rate unchanged at 10.8%. At the same time, monthly hours worked in all jobs were up 0.7% over the month and 1.7% over the year.
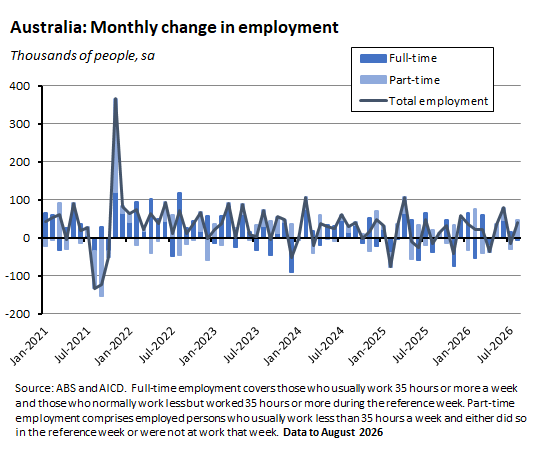
In addition, employment growth surprised to the upside in August. The market consensus forecast had expected employment to rise by 20,000 last month. Instead, it was up by 39,500 people as a 45,800 gain in part-time employment comfortably offset a 6,300 fall in full-time employment.
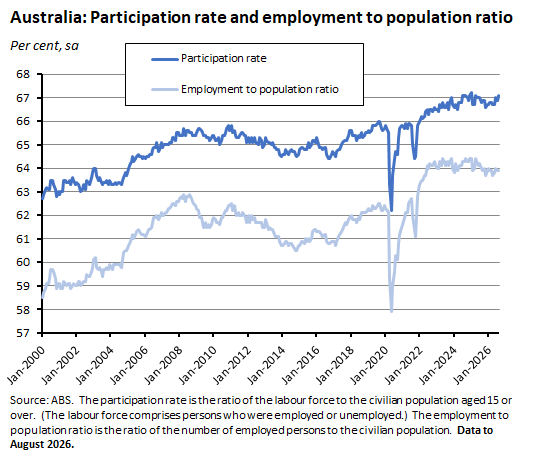
Other indicators of relative labour market resilience included increases in the employment-to-population ratio (up 0.1ppt to 63.9%) and in the participation rate (up 0.2ppts to 67.1%) – although note that the latter is also likely to be an indicator of the cost-of-living squeeze on Australian households.
There is one more complication. The ABS noted that while the underpinning Labour Force Survey is always subject to sample variability on a month-to-month basis, the August results may include ‘a degree of additional variability due to the changes in Supplementary Survey collection methodology.’
Overall, therefore, while the unemployment rate might be moving in the ‘right’ direction in terms of the RBA’s inflation views, the mixed messages in the August labour market reading seem unlikely to be enough to move the dial on next week’s rate decision.
IGR 2026: Reimagining Australia’s future, again
Australia’s Intergenerational Reports (IGRs) are fiscal and economic updates intended to assess the long-term sustainability of current government policies over the next 40 years. According to the Charter of Budget Honesty Act 1998, the Australian government is to publicly release and table an IGR at least once every five years.
The first IGR arrived in 2002 as part of the 2002-03 Budget and there have been seven IGRs to date, with the most recent, IGR 2026, released by the Treasurer on 21 September this year. The new IGR projects the outlook for the Australian economy and the government’s budget out to 2065-66. It covers more than 300 pages and is split into three parts: Part 1 considers major transitions over the next 40 years; Part 2 sets out expected developments in the economy over this period; and Part 3 assesses the implications for the budget.
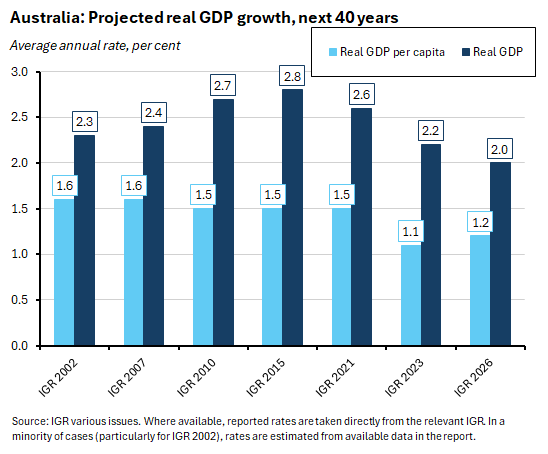
For those not inclined to dig into the details, the headlines are that in the new IGR, real GDP is now projected to grow at an annual average rate of 2% over the next 40 years, down from 3% over the past 40. That decline reflects a combination of slower population growth and slower growth in real GDP per capita.
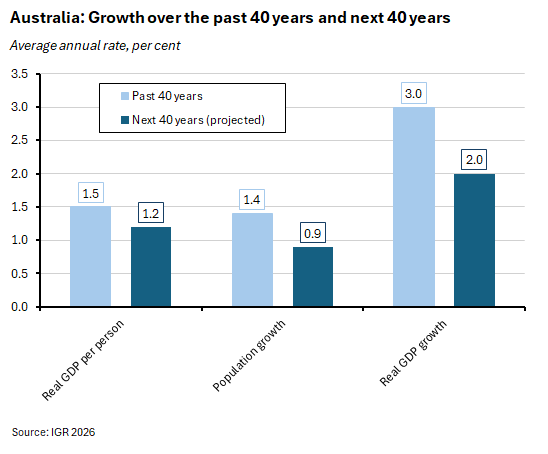
Sitting behind that slowdown in real GDP per capita growth is the impact of an ageing population, manifested in a falling share of the working-age population and a decline in participation.
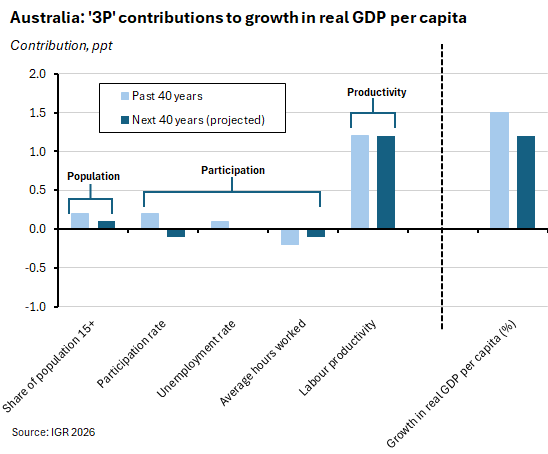
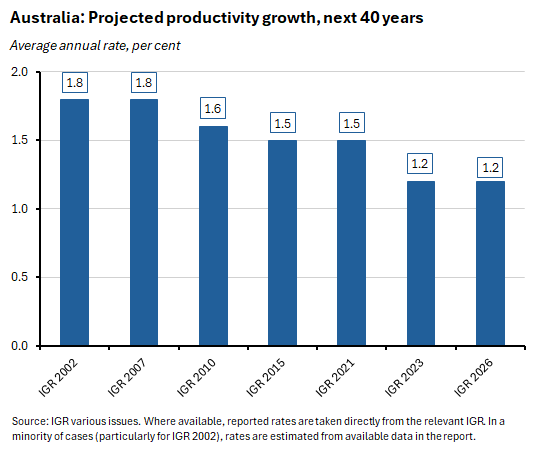
Notably, IGR 2026 sticks with the same productivity assumption as IGR 2023: a long-run productivity growth rate of 1.2% per year. That rate was in line with the previous 20-year average when IGR 2023 was published. But it is far above the 0.2% average recorded over the past decade and the 0.6% rate recorded in 2025-26, and further still from the 0.2% year-on-year fall recorded in the June quarter 2026. Given that productivity growth does nearly all the work in driving projected growth in real GDP per capita, this is a critical assumption that we will return to several times below.
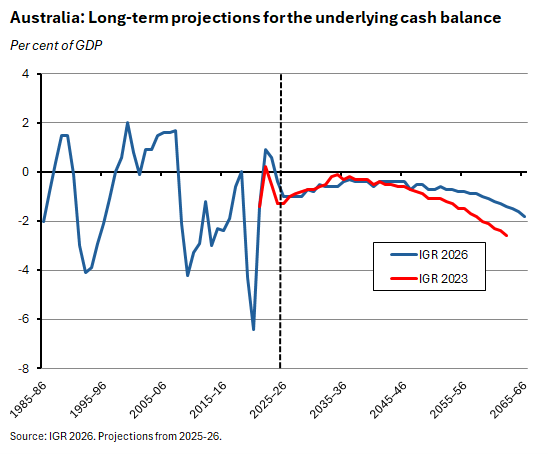
Based in part on these assumptions, and in part on the fiscal projections made in Budget 2026, IGR 2026 paints a picture of the fiscal position that looks considerably better than the one presented in IGR 2023 in the aftermath of COVID-19 and the associated fiscal blow out. Projected deficits are now lower, with the underlying cash balance (UCB) expected to improve by 1.2ppt of GDP by 2062-63 compared to the numbers presented in the previous report:
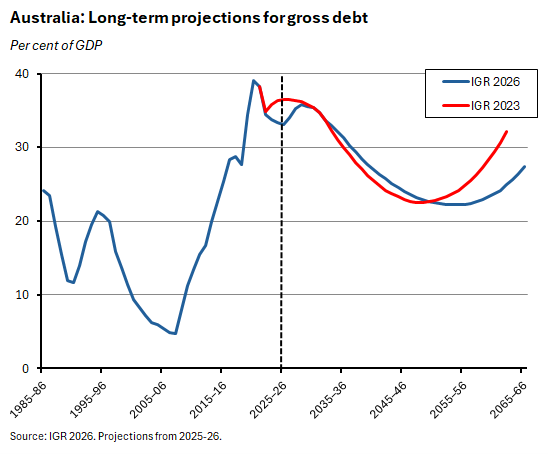
Likewise, the projected debt burden, shown here as the ratioof gross debt to GDP, is lower by 7.2ppt of GDP by 2062-63.
All of which is good news as far as fiscal sustainability goes, and certainly much more reassuring than projections suggesting explosive growth in debt and deficits, for example. Of course, anyone putting much weight on a 40-year forecast (or arguably, even a four-year one given the current range of uncertainties) should be prepared for a fair bit of disappointment…
Anyway, on to the detail, which, as with the previous IGR, combines a mostly qualitative analysis of some of the key forces expected to shape Australia’s external environment over coming decades with a more quantitative economic and fiscal analysis based around Treasury’s familiar ‘3Ps’ framework.
Part 1: Five major transitions over the next 40 years
According to IGR 2026, ‘the global economy is experiencing a period of remarkable change and the pace of this change is accelerating.’ It identifies what it reckons are the ‘five most consequential transformations that will have profound implications for our economy and society.’
Transformation #1 is the AI revolution, which the IGR says will be ‘a defining influence on the economy over the next 40 years’, as ‘the rapid improvement in AI capabilities represents the biggest observable shift’ since the previous report in the series, IGR 2023. The global AI investment boom is identified as a significant driver of growth in the near term, with the report noting the large increase in capex on data centre construction underway, of which around one-third (after taking into account the high level of import content) is expected to directly support domestic economic activity.
Further out, the IGR judges that ‘AI products and services will become a more significant part of the global economy over the next 40 years’ and argues that to ‘become a leading geography for the development of AI businesses, Australia will…need to ensure competitive access to data, compute and foundational models.’
Importantly for what follows, AI is expected to ‘underpin the next phase of significant productivity growth’ although the report notes that current estimates of AI’s likely impact on productivity growth vary widely. IGR 2026 reckons that AI-driven productivity gains ‘would help achieve Treasury’s long-term productivity growth assumption of 1.2% per year.’
IGR 2026 includes three scenarios: a baseline anchored to the 1.2% assumption; an upside scenario in which productivity growth ‘materially exceeds the current long-term assumption’; and a downside scenario in which AI’s contribution remains modest due to slower-than-expected diffusion and constraints on task-level automation in labour-intensive services and materials sectors. In this scenario, gains from AI could be further offset by domestic and global headwinds, leaving Australia’s productivity performance meaningfully below the long-term assumption.
Transformation #2 is geopolitical fragmentation, with the report noting that geopolitical competition is intensifying such that trade, investment and technology flows are ‘increasingly aligning with strategic and geopolitical objectives.’ The report does not project an unwinding of global economic integration, but rather a reorganisation of the global economy in line with new alliances and competitors.
This new international economic order is increasingly one of export controls, investment restrictions, screening regimes, and increased competition over critical technology and critical inputs. The IGR judges that this new environment is ‘expected to be a drag on longer-term growth and prosperity.’ It also sees a world in which shocks (from conflict, sabotage, and cyber incidents along with natural hazards and pandemics) will become more consequential, and where ‘acute disruptions may…impose significant economic costs.’
Given an environment of growing economic security risks, the IGR foresees resilience, reliability and agility becoming more important for governments and businesses. It suggests that the ‘challenge for Australia will be to maximise the benefits of openness while strengthening resilience in the relatively small number of areas where disruption could have severe economic, security, or sovereignty consequences.’
Transformation #3 is the energy transition, which is driven by a mix of energy security challenges, technological change, and action on emissions reduction. IGR 2026 judges that economies ‘around the world will continue to change and adapt as they transition to reliable renewable energy’ and cites substantial cost declines in renewable technologies as a key driver of this shift, which it reckons will ‘continue over the coming decades as the world continues to transition towards net zero emissions.’
According to IGR 2026, the implications of this transition will include lower household energy expenditure due to electrification and the emergence of new industrial opportunities. Should this not be the case, the IGR warns that a disorderly global transition will deliver significant economic costs.
The report also warns that over the next 40 years, ‘increasingly frequent and severe natural disasters will pose a significant economic risk. Impacts include the loss of economic activity, infrastructure damage, and higher insurance costs.’
Transformation #4 is ageing and the care economy. A key finding of IGR 2026 is that population ageing is accelerating, mainly due to a lower projected fertility rate. As a result, Australia’s median age is now projected to rise from 38.6 years in 2025-26 to 45 years by 2062-63, 1.9 years above the IGR 2023 projection for the same year. Australia’s old-age dependency ratio is now projected to reach 38.8 people aged 65 and over for every 100 working-age people by 2062-63 (up from 38.2 in IGR 2023). The number of people aged over 85 is forecast to triple over the next four decades, rising from 625,000 today to 1.9 million.
Population ageing will add to fiscal and service delivery pressures even as Australia remains in a better position than many of our peers. This new demographic trajectory will also drive demand for the care economy, reinforcing a broader shift towards a services-based economy. Since 2023, employment in the health care and social assistance sectors has already grown by 13% and the IGR projects this will increase by a further 23% by 2035.
These developments also mean that our working-age population will be a smaller proportion of the total and much older than it is today, with a larger share aged over 40. But the IGR also notes that, unlike in many of its OECD peers, Australia’s working-age population will keep growing, supported by skilled migration.
Transformation #5 is Australia’s industrial transformation, which is reshaping the industrial landscape through the impact of the previous four forces. Population ageing and rising incomes will contribute to the long-run expansion of the services sector; the energy transition is expected to lead to a shift in the industrial base in response to electrification and the declining costs of renewables; and the AI revolution is set to restructure the market for business services, for example.
In addition to these five transformations, IGR 2026 also highlights a sixth key issue:
#6 Intergenerational equity. IGR 2026 warns that ‘while household wealth is expected to keep rising over time, there is a risk that younger generations continue to see smaller gains compared to prior generations.’ It reckons that long-term demographic and economic pressures on housing and on the tax system are set to intensify existing concerns about intergenerational equity, with the current heavy reliance on taxing the incomes of working-age Australians a particular pain point.
Part 2: The Australian economy over the next 40 years
By 2065-66 and the end of the 40-year projections included in IGR 2026, the Australian economy is expected to have more than doubled in size in real terms while living standards are expected to be 55% higher than they are now.
Those projections are constructed using Treasury’s ‘3Ps’ framework, which combines predictions for population, participation, and labour productivity to determine potential output. The IGR then assumes that, over the long run, real GDP will converge to this potential level.
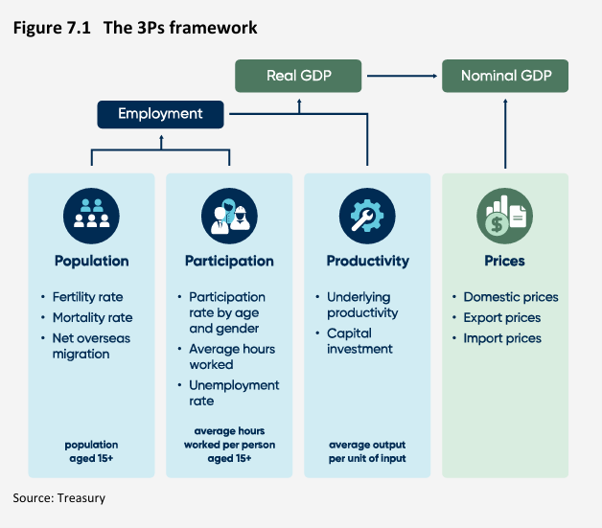
Source: IGR 2026, Box 7.1.
If we start with population, IGR 2026 assumes that the average annual rate of population growth over the next 40 years will slow to 0.9%. That’s the lowest projected rate since IGR 2007 and is 0.2ppts lower than the projection in IGR 2023. As a result, total projected population is now lower (by about 1.8 million people by 2062-63) than in that earlier IGR.
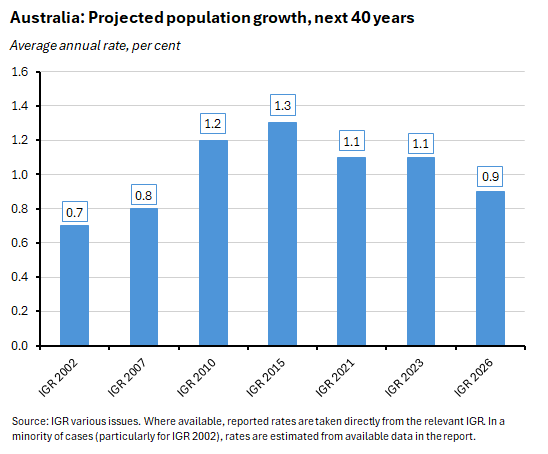
Slower population growth reflects lower projected fertility rates, with the total fertility rate (TFR) now expected to fall to 1.34 children per woman by 2065-66. One notable consequence is that by the 2060s, national deaths are projected to exceed national births for the first time in any IGR.
As a result, net overseas migration (NOM) is projected to become the sole driver of population growth from around 2059-60 onwards. IGR 2026 assumes a long-run NOM rate of 235,000 people per year over the medium term, in line with IGR 2023.
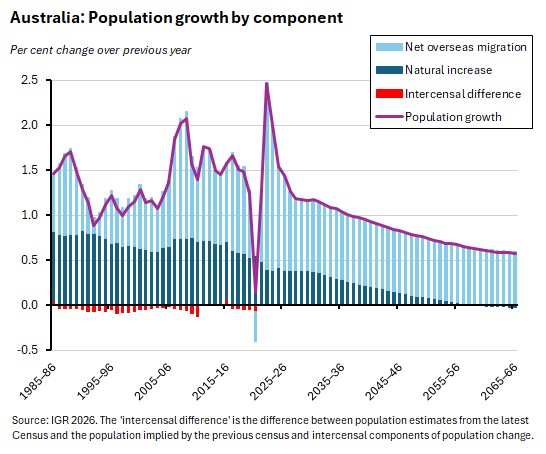
Given this backdrop of slowing population growth, trends in participation become more important. Here, IGR 2026 projects a continued increase in the participation rate until it hits a peak of 67.7% in 2039-40. It then falls back to 64.7% by 2065-66 as the impact of population ageing starts to more than offset the lift from rising participation rates for women and for older Australians.
Each successive IGR, including this one, has had to upgrade its projections for participation rates from its predecessor due to what the current IGR describes as a ‘persistent underestimation of the extent and persistence of within-cohort participation increases, most notably among women and older Australians.’
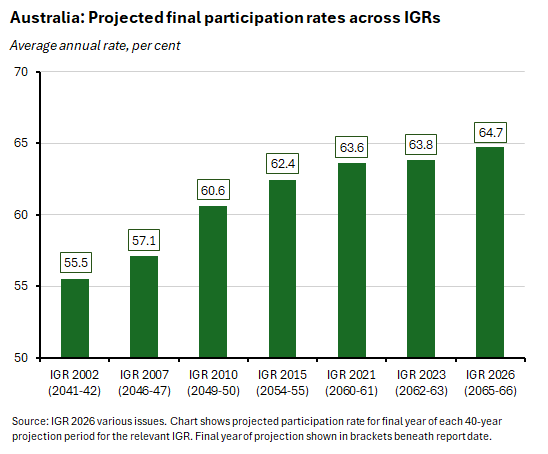
The IGR attributes this increase mainly to higher female participation, reflecting growth in part-time and other flexible working arrangements, a more flexible labour market, the growth of the formal care economy, increased educational attainment and changing social norms.
In the case of productivity, as already noted IGR 2026 maintains the assumed 1.2% annual average rate of productivity growth adopted in IGR 2023. While this remains the most pessimistic projection made in an IGR to date, it is worth noting that even in IGR 2023 there was considerable scepticism about this assumption. Three years on, and with Australia’s productivity performance remaining distinctly lacklustre, the assumption is arguably even more heroic this time. We will return to that a little later.
Put all these assumptions together, and IGR 2026 projects an annual average rate of GDP growth of 2% over the next 40 years along with an average annual rate of real GDP per capita growth of just 1.2%. That represents the slowest projected overall growth rate of any IGR to date and the second slowest per capita growth rate (IGR 2023 assumed a 1.1% rate).
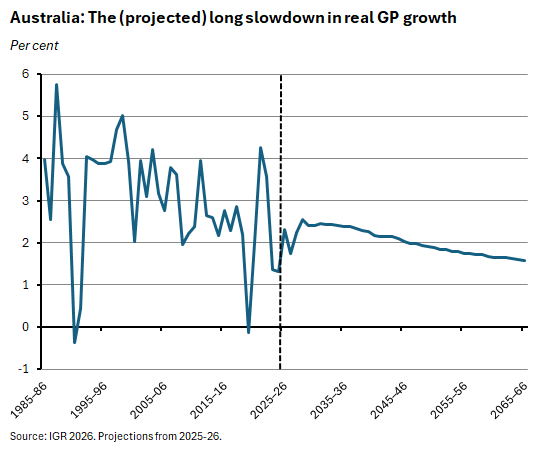
Demographic developments mean that projected economic growth grinds steadily lower across the projection period, falling from 2.4% in 2035-36 to 2% in 2045-46 and to 1.8% in 2055-56, before easing again to just 1.6% in 2065-66. (Remember, these assumptions are based on the ‘3Ps’-based estimate of potential growth and therefore do not consider the upswings and downturns of the business cycle. In practice, the actual path of economic growth will be much less smooth than the IGR’s charted projections.)
Part 3: The Commonwealth budget over the next 40 years
IGR 2026 then uses these economic projections in combination with Budget 2026’s medium-term projections to generate long-term fiscal projections. As already noted, the good news in IGR 2026 is that the debt and deficit position looks markedly better than the one presented in IGR 2023.
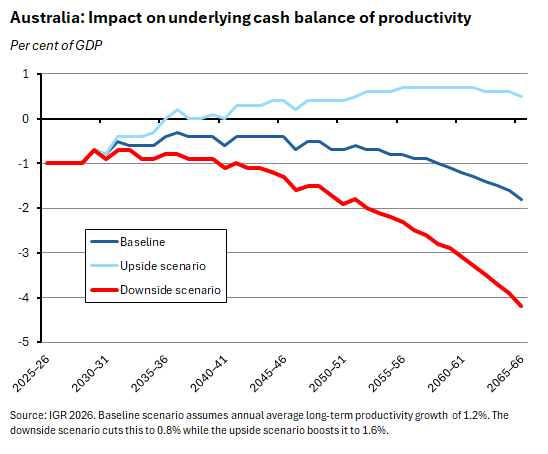
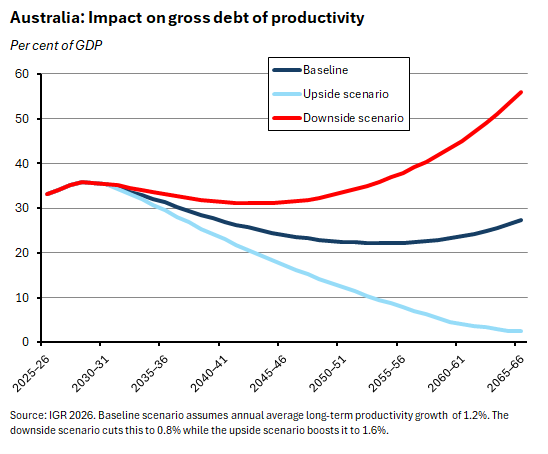
The not-quite-so-good news is that the UCB is projected to remain in deficit across the entire 40-year period, reflecting the presence of persistent fiscal pressures. So, after falling to a low of 0.3% of GDP in 2036-37, the deficit is expected to rise to 1.8% of GDP by 2065-66. And those same fiscal pressures mean that after falling from 33.1% of GDP in 2025-26 to a low of 22.2% of GDP in 2053-54, gross debt is expected to rise to 27.4% of GDP by the end of the projection period.
Still, if these projections somehow turn out to be correct, those kinds of outcomes would represent an enviable achievement in the context of slowing growth, an ageing population, and higher borrowing costs (relative to IGR 2023, IGR 2026 assumes higher borrowing costs out until the early 2050s).
Budget 2026’s reforms to the NDIS and aged care explain much of the improved fiscal position in the latest IGR, with a helping hand from new revenue measures. Even so, fiscal pressures will remain in the form of higher spending on health (up by more than 2ppts of GDP by 2065-66 relative to 2025-26, with a third of that increase attributable to population ageing), aged care (up by almost 1ppt) and defence (up by nearly 0.5ppt), along with more modest increases for interest payments and the NDIS. These increases are partly offset by falls in spending on education (again due to population ageing), on age and service pensions (due to superannuation, as the share of older Australians receiving a pension or income support payment is projected to fall from 66% to 52%), and on other income support (due to lower payments to families because of lower fertility rates and lower payments to working-age Australians due to population ageing).
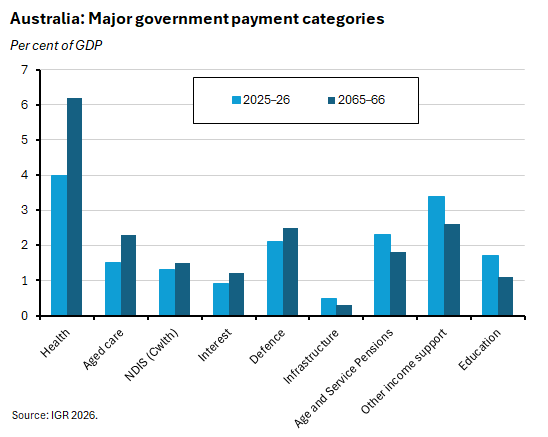
Note, however, that while the superannuation-pension story is a positive one, the shine comes off once superannuation tax concessions are included. That is because while spending on Age and Service Pensions falls by about 0.5ppt of GDP over the next 40 years, superannuation tax concessions are projected to rise by about 1ppt, with the value of revenue foregone from tax concessions exceeding expenditure on the Age pension by the late 2030s.
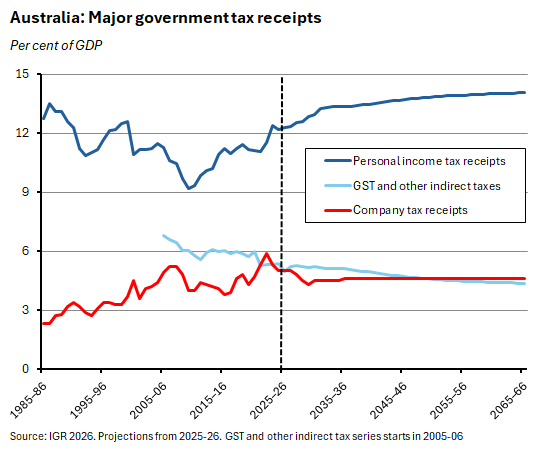
On the revenue side of the fiscal accounts, IGR 2026 assumes that tax receipts as a share of GDP will not exceed their historical high of 24.2% recorded in 2004-05 and 2005-06, in line with the approach followed by previous IGRs. At the same time, and in the absence of any further policy changes, their composition is expected to involve a growing reliance on personal income tax receipts as company tax receipts stabilise and revenues from indirect taxes decline. Remember, this will be happening in the context of a shrinking share of the working-age population in the total.
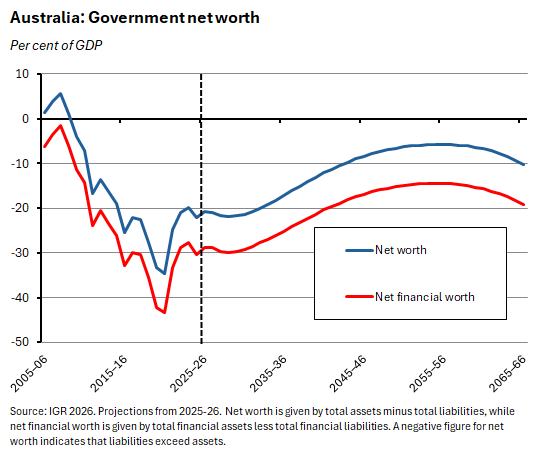
The combined impact of these developments in revenue and expenditure on the government’s balance sheet is that net worth (total assets less total liabilities) will improve from -20.9% of GDP in 2026-27 to -5.7% of GDP in 2054-55 before falling back to -10.2% of GDP in 2065-66. Over the same period, the government’s net financial worth (financial assets less financial liabilities) will improve from -28.9% of GDP in 2026-27 to -14.5% of GDP in 2054-55 before deteriorating to -19.2% of GDP by 2065-66, in line with the debt story set out earlier.
What could go wrong? (1) Productivity growth
IGR 2026 has been subject to two main criticisms, one focused on the productivity assumption that underpins the economic projections, and one on the methodology more broadly.
Starting with the productivity assumption, we’ve already noted that an assumed 1.2% annual growth rate looks very optimistic when judged against past performance. IGR 2026 is ‘lucky’ in that the AI revolution offers a counterargument: if AI is going to deliver a big productivity payoff, then a return to 1.2% productivity growth could even turn out to be a conservative estimate. On the other hand, if many of the productivity claims for AI turn out to be overblown, that could put a big hole in the IGR’s projections.
To its credit, IGR 2026 recognises this risk and presents a sensitivity analysis based on those three productivity scenarios noted above: the baseline 1.2% productivity assumption along with higher (an increase of 0.4ppts) and lower (a reduction of 0.4ppts) scenarios. For pessimists, the latter – which implies a 0.8% productivity growth rate – looks like a more realistic option. In which case the projected deficit on the UCB would be considerably larger than the one presented in the baseline:
Likewise, the profile for gross debt would be considerably higher (while still leaving Australia in a better place than many of our advanced economy peers currently find themselves):
What could go wrong? (2) Adverse economic shocks
The second criticism of IGR 2026 relates to the approach of focusing on long-term trends and – in effect – mostly relegating the likely impact of shifts and shocks to a qualitative discussion.
Regular readers will know that our own base case scenario for the world economy is one in which shocks – particularly supply shocks – are the new normal. While we’ve been making this case for a while, it’s no longer especially controversial. After all, the world economy has suffered at least five major supply shocks this decade: the COVID-19 pandemic; the post-pandemic reopening shock; the 2022 Russian invasion of Ukraine; the April 2025 ‘Liberation Day’ tariff shock; and most recently the ongoing war in the Middle East. Looking ahead, the energy transition, climate change, and more geopolitical contestation all suggest the possibility of further disruption.
And then there are the risks of an old-fashioned financial crisis as seen recently in the disruption to global bond markets and fears of an AI-driven bubble in equity markets.
Indeed, the IGR’s own opening discussion of transformational forces is consistent with the view that the outlook is hostage to the possibility of several major shifts and shocks.
All of which means that the kind of trend-line forecasts presented in the quantitative part of the IGR are extremely unlikely to manifest. How you feel about this depends in large part on how you view the IGR exercise itself. As we’ve written in the past, the IGR is an interesting attempt to push the government of the day to think beyond the tyranny of Australia’s relatively short electoral cycle and consider the medium term. That has the obvious and important advantage that it encourages a focus on the longer-term implications of current policy settings. But it has the equally obvious and important shortcoming that our ability to say anything with confidence about the global and Australian economies four decades from now is incredibly limited. Consider, for example, just how much both have changed over the previous four decades and the sheer difficulty of forecasting many (most?) of those changes. IGR 2021 helpfully explained that an IGR was not a forecast but rather ‘one possible picture of the future based on expected structural settings and existing policy settings…the report presents a world that could be, rather than will be.’ Keep that in mind, and the IGR’s strengths as well as its inherent limitations are more understandable.
What could go wrong? (3) A new political and policy environment
One final thought as to developments that could undermine the analysis in the IGR. The rise of populism and its implications for the quality of economic policymaking are a growing source of risk across advanced economies. Treasury’s 3Ps framework may turn out to be ill-suited to a new populist era.
Further reading and listening
- The 21st (2026) edition of the Annual Statistical Report of the HILDA survey tracks how Australian households are faring over time. For example, it notes that while mean and median household disposable incomes grew very strongly between 2003 and 2009, growth was then much weaker between 2009 and 2018 before enjoying a pickup between 2018 and 2021. Mean incomes then continued to rise between 2021 and 2022 before falling sharply between 2022 and 2023, while 2024’s modest recovery left mean income a bit below its 2021 level. At the same time, median incomes fell sharply between 2021 and 2023, with a slight recovery in 2024 leaving median income 3.3% below the 2021 level. The Survey also reports a slight reduction in short-term (two-year and five-year) income mobility this century but little change in long-term (ten-year) mobility.
- Consistent with our earlier analysis, RBA governor Michele Bullock’s opening statement to the House Standing Committee on Economics suggests that Martin Place will be minded to tighten monetary policy later this month: ‘At the time of the August Board meeting, we assessed that the risks to that outlook were skewed to the upside. Developments since then suggest that although growth in the Australian economy is slowing, some of these upside risks to inflation appear to be materialising. Global cost pressures have increased – the Middle East conflict, the AI boom and extreme weather events are contributing to upward pressure on a range of energy, agricultural and technology-related prices. There is little sign of resolution of the Middle East conflict. Oil and related prices have increased sharply again and will add directly to inflation…we are hearing that many firms are passing on higher input costs…The global AI boom is driving stronger growth in economies that are key parts of the AI supply chain. It is also driving higher global prices for some AI-related technologies that are supply constrained…And domestically, while labour market conditions have eased gradually as expected, some capacity pressures remain. There is a risk that this could exacerbate the degree of pass-through of rising input costs.’ [emphasis added]
- And a fireside chat with the RBA governor which notes in passing the sequencing challenge being created by the AI boom. That is, we are already seeing demand-side pressure from current AI-related capex but little evidence yet of any supply-side payoffs in the form of a better productivity performance. It also includes the governor’s comment that ‘I think [an unemployment rate of] between 4.5 and 5 will probably take enough heat out of the labour market that it'll ease pressure on inflation.’
- Yet more RBA comms: MPB member Iain Ross on the chances of a wage-price spiral. Key message: ‘The overall thesis is that there is no evidence of the emergence of a wage-price spiral in the present circumstances and recent data suggest such an outcome is unlikely.’
- The AFR flags the possibility of Australia-US tech wars over AI and social media.
- The e61 Institute discusses the missing shocks in the Intergenerational Report. The argument here is that large shocks – most recently the GFC and then the COVID-19 pandemic – have required the public sector balance sheet to act as a shock absorber, with substantial implications for the trajectory of deficits and debt. Possible future shocks could include a major geopolitical crisis, a global bond market shock, or a severe domestic recession. Worse, such shocks could be correlated.
- The concluding statement from the 2026 IMF Article IV Mission to Australia reckons that returning inflation to target should be the near-term policy priority; that in a context of rising spending and public debt (especially among the States), gradual fiscal consolidation is needed; and that lifting labour productivity is critical to improving living standards and medium-term growth. The Fund expects the economy to grow by 1.9% this year and 1.6% in 2027 and judges that although risks to growth are broadly balanced, risks to inflation remain tilted to the upside.
- The Lowy Interpreter explains why ‘Australian AIs only’ is harder than it sounds.
- Productivity Commission Chair Danielle Wood gave a speech on the economic case for integrity in which she warned about the negative impact of declining trust on the ability of governments to pursue economic reform. Her speech also touched on the growth of the regulatory burden (including citing AICD findings in this area), the dangers of ‘grey corruption’ (money-politics, nepotism and pork barrelling), and the need to avoid playing politics with key institutions.
- The September 2026 (Interim) OECD Economic Outlook has revised up expected global growth this year from 2.8% to 2.9% while downgrading the estimate for 2027 from 3.1% to 3%. The OECD puts this year’s better-than-expected performance down to a mix of resilience to the Middle East conflict (due to plentiful oil inventories, additional non-Gulf supply and government support measures) and the offsetting boost to activity from AI-related investment. Downside risks include more persistent disruption to Middle East energy exports, weather-related supply shocks, further rises in long-term sovereign bond yields, and a repricing of financial assets in the event of AI-related disappointments.
- The WSJ reviews the forces that have reshaped the US bond market this decade.
- The IEA considers oil market strains.
- Related, an FT Big Read on five ways the Iran energy shock is wrongfooting the world: after being too pessimistic about the early economic implications of the conflict, economists may now be too complacent; this is a fuel (diesel, petrol, jet fuel) not an oil crisis; past oil shocks are a poor guide to the present; poor countries are being hit hardest; and the oil industry itself is uncertain about the likely price impact.
- Also related, a new BIS working paper on maritime chokepoints and the global economy.
- Toward a new economic growth model for China, a new IMF e-book.
- The Economist on the broadening international slowdown in GDP per capita growth rates. According to the magazine, more than two in five humans now live in places where GDP per capita grew half as fast or less in the decade to 2024 than in the previous ten years, up from less than one in six in 2014.
- An impending copper crunch.
- Dieter Helm argues for climate realism in a world of rising energy demand and increasing emissions.
- Ember Futures on The age of power, which examines the convergence between the electric and information revolutions.
- New jobs in 140 years of data. According to Swedish data on occupational structure, and despite successive waves of technological change, roughly seven in ten workers today are employed in occupations whose core functions already existed in the late nineteenth century. Part of the argument rests on a distinction between tasks and jobs: the AI economics literature tends to focus on the displacement of workers from tasks, but if the focus were instead on occupations, projected labour-market changes could look smaller.
- An OECD paper on Agentic AI in organisations.
- Carlyle on ‘rules of relevance’, learned blindness and the AI boom.
- Milanovic and Gilman contemplate the end of upward mobility if AI comes for the meritocracy.
- An empire of slop?
- Should we fear a Zombie iPocalypse?
- 50 years of wine is a fun read for oenophiles from a UK perspective (FT).
- A Grattan Institute podcast on how to decouple money from power.
- The Past, Present, Future podcast has started a new series on our ageing world. The first episode considers lifespan vs healthspan and reviews some of the changes influencing longevity from statins to GLP-1s and on to AI.
- The Conversations with Tyler podcast features former IMF chief economist and first deputy managing director Gita Gopinath.
Latest news
Already a member?
Login to view this content