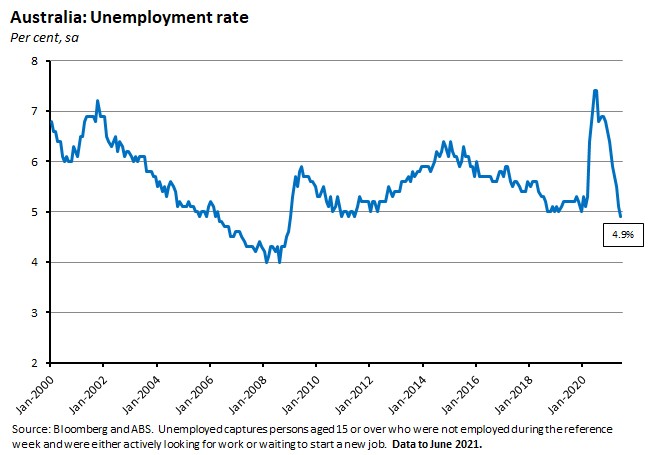
Australia’s unemployment rate fell to just 4.9 per cent in June, its lowest rate since December 2010. The New South Wales government has extended its lockdown of Greater Sydney, raising risks to the economic outlook for the remainder of the year.
The Westpac-Melbourne Institute Index of Consumer Sentiment rose 12.5 per cent in July as rebounds in Victoria and Western Australia offset a sharp decline in New South Wales. The NAB monthly Business Survey for June showed business conditions slumping by 12 index points over the month and business confidence dropping nine points, although both indices remain elevated. The ANZ-Roy Morgan index of consumer confidence rose two per cent over the week ending 10-11 July 2021. This June’s increase in US consumer prices was the largest monthly change since June 2008 and the strongest annual reading in more than a decade, providing more fuel to the US-inflation debate and adding more pressure on the Fed’s policy position. China’s GDP rose 1.3 per cent over the quarter and 7.9 per cent over the year, keeping the economy comfortably on track to meet Beijing’s six per cent growth target for this year. The European Central Bank has adopted a new monetary policy strategy designed to give it more flexibility in combating low inflation and aimed at delivering a ‘greener’ version of policy.
This week’s readings include the economics of NAIRU and Australia’s labour market, economists and lockdowns, the final ABS survey on the household impacts of COVID-19, a briefing on global inflation, the impact of natural disasters on supply chains, survey evidence on how boards and shareholders design CEO pay, trends in global wealth and an update on world energy markets.
Finally, stay up to date on the economic front with our AICD Dismal Science podcast .
Listen and subscribe: Apple Podcasts | Google Podcasts | Spotify
What I’ve been following in Australia . . .
What happened:
The ABS said that Australia’s unemployment rate fell to 4.9 per cent in June 2021, down from 5.1 per cent in May.
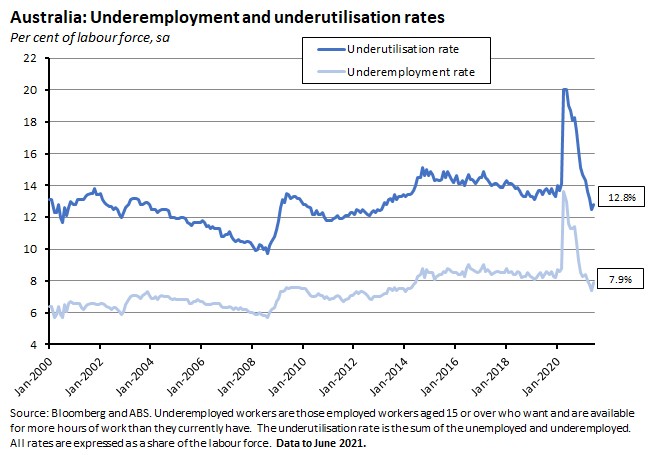
The underemployment rate, however, rose 0.5 percentage points to 7.9 per cent, nudging the underutilisation rate up 0.3 percentage points to 12.8 per cent.
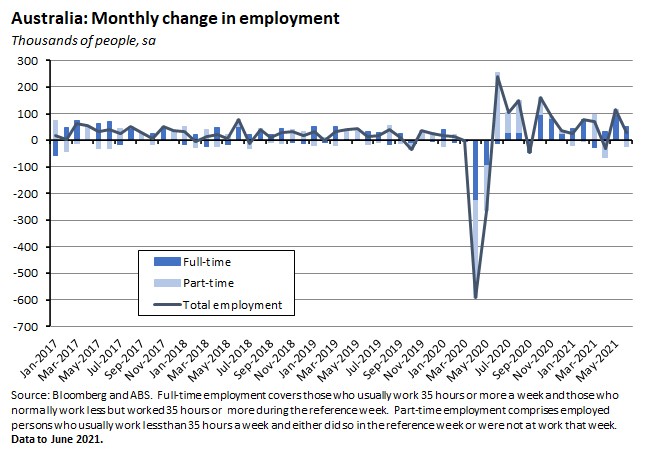
Employment rose by 29,100 people (0.2 per cent) to 13.15 million people. Full-time employment increased by 51,600 while part-time employment fell by 22,500. The part-time share of employment was 31.5 per cent, down from 31.7 per cent in May.
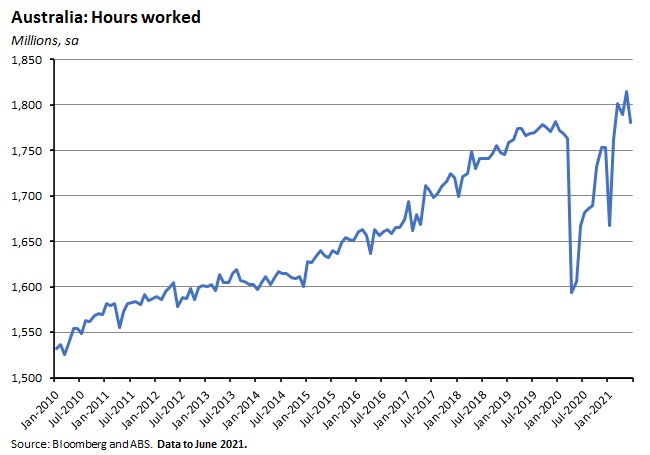
Monthly hours worked in all jobs in June fell by 33.4 million hours (1.8 per cent) to 1,781 million hours.
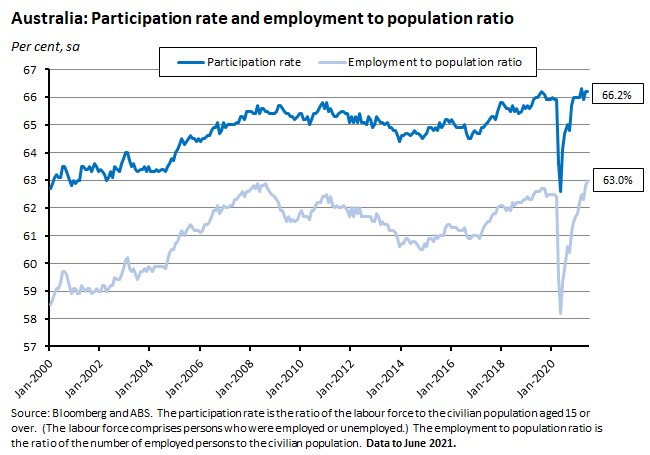
The employment-to-population ratio edged higher by 0.1 percentage points to 63 per cent while the participation rate was unchanged over the month at 66.2 per cent.
Why it matters:
Continuing a run of strong labour market results, the June labour force release beat expectations: at 29,100, jobs growth was comfortably ahead of the consensus forecast for a 20,000 gain while the drop in the unemployment rate to 4.9 per cent was likewise better than the median forecast for a 5.1 per cent print. The unemployment rate has now fallen for eight months in a row, dropping a full two percentage points from the 6.9 per cent rate reported in October 2020. The last time Australia enjoyed an unemployment rate below five per cent was in June 2011, and the last time the unemployment rate was lower than it is now was in December 2010. All of which means that we have now (just) reached the ‘unemployment rate with a four in front of it’ that the Treasurer mentioned as a potential labour market target at the time of the May 2021 Federal Budget.
There is no doubt that this is an impressive achievement. Unfortunately, however, the good news included in the June results has been overshadowed by the potential for the recently-extended New South Wales lockdown and now a newly announced Victorian lockdown to undermine at least some of this labour market progress (see next story).
In fact, the adverse impact of state lockdowns on the labour market had already made an appearance in the June data, even if it didn’t show up in the headline unemployment rate. Instead, it took the form of a 1.8 per cent fall in national hours worked, driven by an 8.4 per cent drop in Victorian hours due to that state’s lockdown (which also showed up in a more modest 0.3 per cent fall in state employment). In contrast, hours worked across the rest of Australia rose by 0.5 per cent.
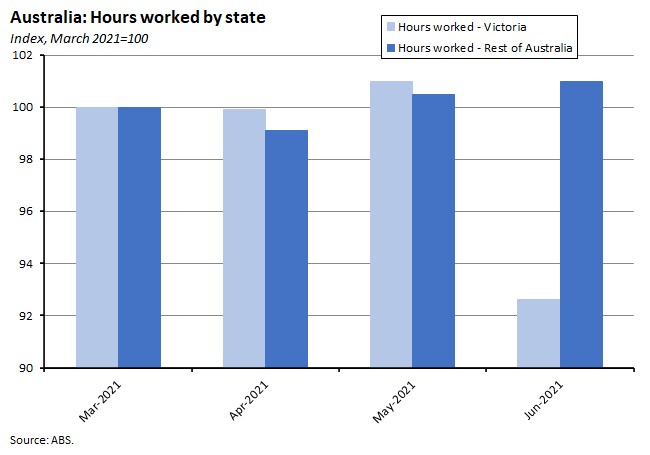
That fall in hours worked also produced a rise in the monthly underemployment rate, which increased by 2.3 percentage points to 10.1 per cent in Victoria and by 0.5 percentage points to 7.9 per cent across Australia overall. That in turn pushed up the national underutilisation rate, with the latter’s 0.3 percentage point increase in June 2021 marking the first rise since September 2020.
Another indicator of labour market fallout from public health restrictions was a rise in the number of Australians working zero hours for economic reasons, which jumped from around 58,200 in May to about 156,500 in June – it’s highest level since September last year.
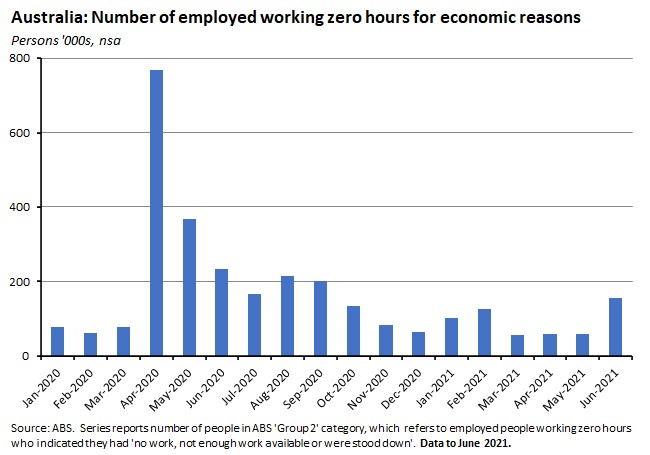
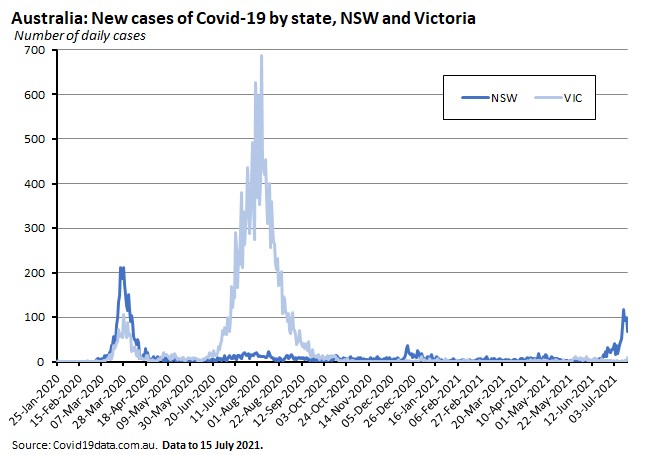
The ABS noted that the June survey reference period was 30 May to 12 June 2021 which coincided with the Victorian lockdown (which began on 28 May 2021). However, restrictions in New South Wales only came into effect from 23 June, which was after the reference period, and any labour market impact will therefore appear in next month’s numbers.
What happened:
This week the New South Wales (NSW) government said that it would extend its lockdown of Greater Sydney until at least 30 July 2021. And at the time of writing, the Victorian government had just announced a new five-day lockdown.
In response to recent developments in NSW, the Federal Government had already announced an ‘upgrade’ to its COVID-19 Support Package to provide additional assistance in the case of extended lockdowns:
- From week four of a lockdown because of a Commonwealth declared hotspot, the COVID-19 Disaster Payment will now increase from $500 to $600 / week if a person has lost 20 hours or more of work or $325 to $375 / week if a person has lost between eight and 20 hours of work.
- The COVID-19 Disaster Payment will become a recurring payment for approved recipients for as long as the Commonwealth declared hotspot and lockdown restrictions remain in place, removing the need for recipients to re-claim for each seven day period of a lockdown.
- A person will now be eligible for the payment, including where they are still working, provided they have lost more than eight hours or a full day of work.
- From week four of the lockdown, the Commonwealth will fund 50 per cent of the cost of a new small and medium business support payment. Eligible entities will receive 40 per cent of their NSW payroll payments, at a minimum of $1500 and a maximum of $10,000 per week, provided they maintain their full time, part time and casual staffing level as of 13 July.Eligibility is for non-employing and employing entities (including NFPs) with annual turnover between $75,000 and $50 million, and if their turnover is 30 per cent lower than an equivalent two-week period in 2019.For non-employing businesses, such as sole traders, the payment will be set at $1,000 per week.
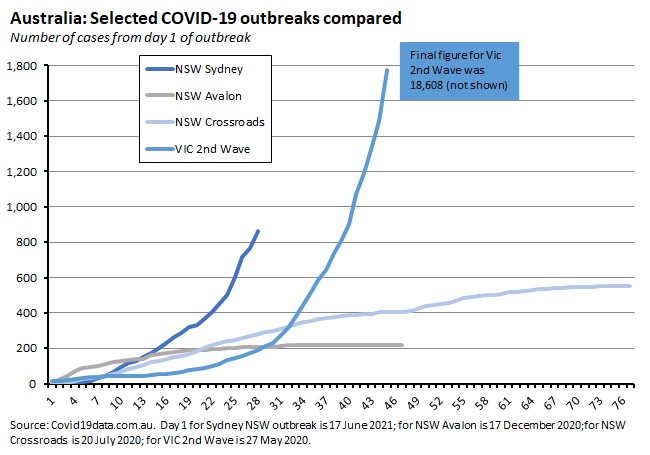
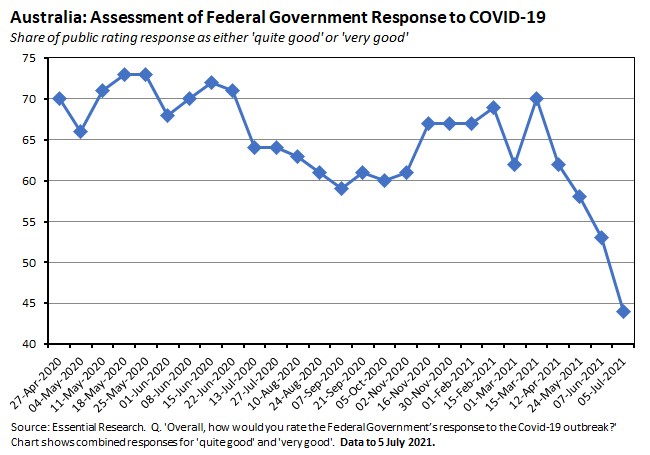
The new COVID-19 outbreaks are also taking a toll on the public’s perception of Australia’s approach to handling the pandemic, with a majority of the public no longer rating the Federal government’s response as good or very good for the first time.
Why it matters:
Official forecasts for the Australian economy this year have been predicated on the twin assumptions that Australia would continue to experience lockdowns but that they would also be limited in their impact. For example, Budget 2021-22 (Budget Paper No.1, Statement 2, Box 2.1) said that during 2021 ‘localised outbreaks of COVID-19 are assumed to occur but are effectively contained’ and that ‘there are no extended or sustained state border restrictions in place over the forecast period.’ Likewise, the baseline forecast in the RBA’s May 2021 Statement on Monetary Policy ‘assumes that no further large outbreaks and accompanying extended hard lockdowns occur within Australia, and that restrictions, when imposed, are brief.’ Current developments mean that those assumptions – and the forecasts they underpin – are now at risk.
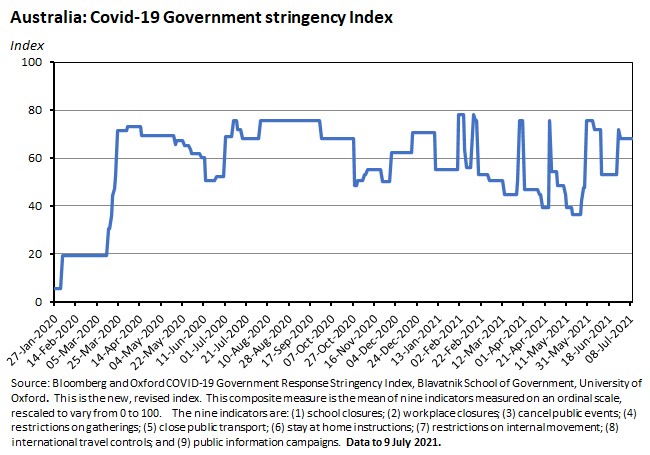
Health policy responses to outbreaks of the Delta variant mean that state-level restrictions on activity have once again been tightened. And we know from past experience that tighter restrictions lead to falls in mobility (as also do declines in public confidence around health and safety conditions).
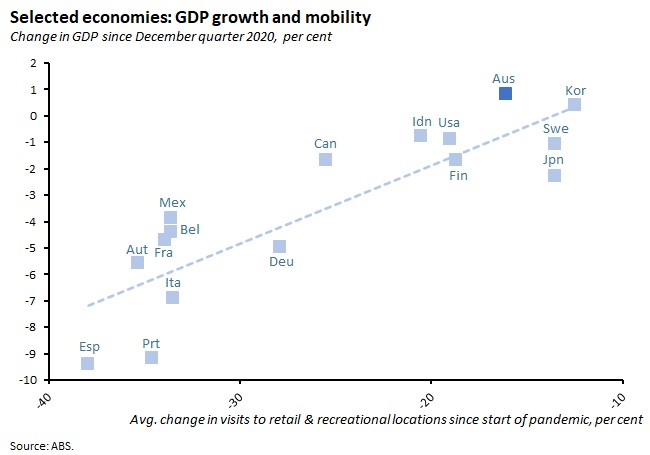
International comparisons confirm that there is a strong correlation between GDP growth and changes in mobility. For example, the chart below shows that Australia’s above average mobility during the pandemic last year, as measured by Google mobility data on visits to retail and recreation locations, has been correlated with an above average GDP performance.
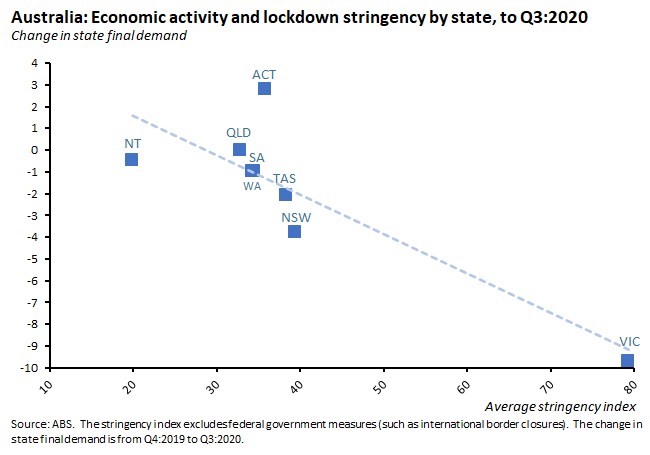
Cross-state comparisons paint a similar picture, with changes in the average stringency of state government responses correlated with growth in state final demand last year.
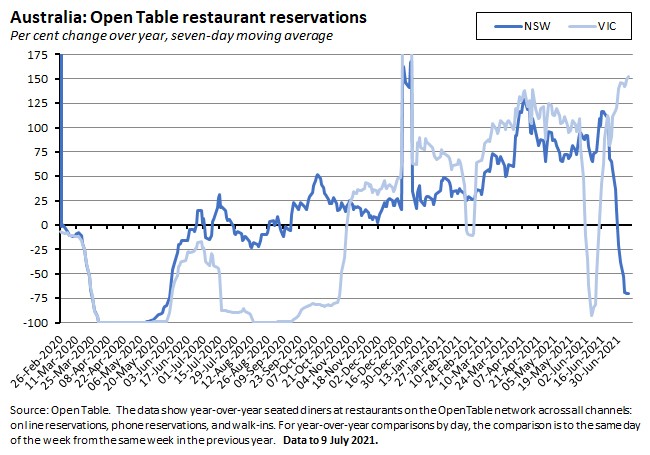
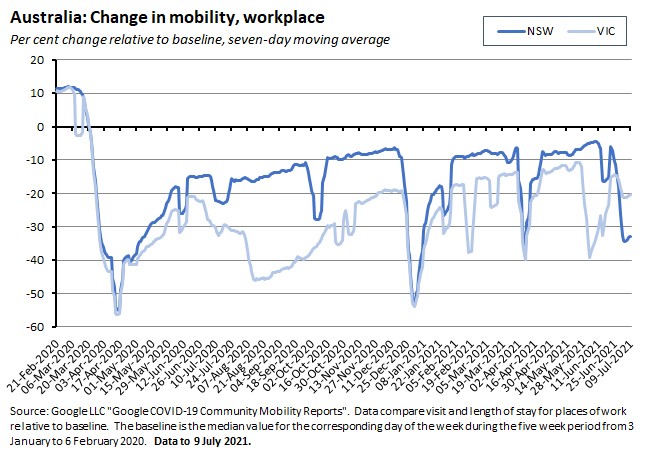
In this context, mobility indicators are already showing that the latest NSW restrictions are having an impact:
- Restaurant reservations are down sharply.
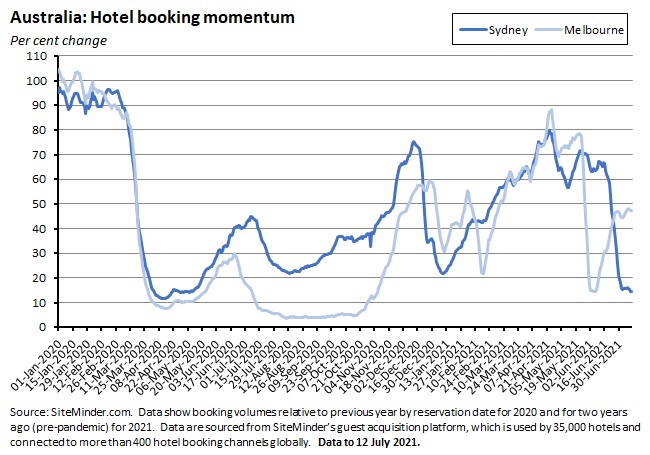
- As are hotel bookings.
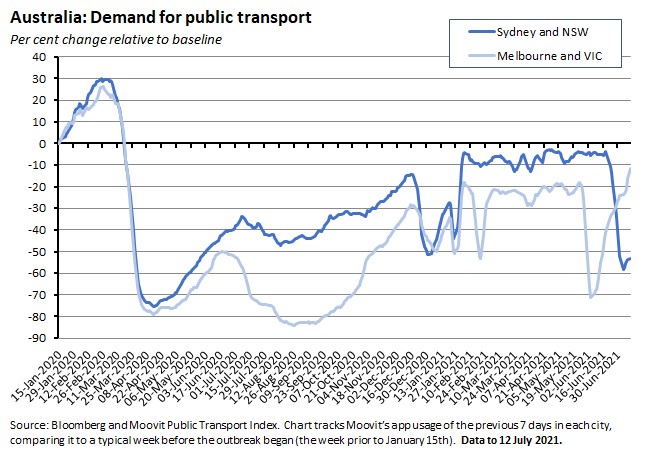
- Demand for public transport has slumped.
- Google mobility indicators show a decline in visits to retail and recreation locations.
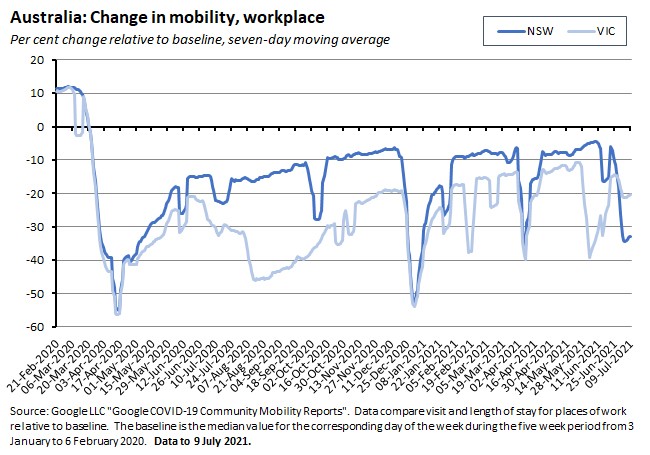
- And a decline in visits to workplaces.
Some offsetting good news here is that there is some evidence that over the course of the pandemic the relationship between mobility and economic activity has changed, as businesses and households have become more used to working with restrictions. More familiarity with working from home, shopping online and other fixes means that a given decline in mobility is likely now associated with a smaller fall in output than it was when the first lockdowns were introduced. Another piece of good news is that experience with previous lockdowns suggests that some activity tends to bounce back quite sharply once restrictions are lifted: that is, activity is postponed rather than destroyed. This is also more likely to be the case in the presence of policy support, and while the government’s new measures are not as generous as its previous policy settings such as JobKeeper, nevertheless they do offer a significant degree of support.
The actual size of the economic hit from a given lockdown is not just a function of the level of policy support and the changing adaptability of businesses and households, of course. It is also a product of the severity of restrictions and of their duration, with the latter in particular now subject to a significant degree of uncertainty. Longer lockdowns imply larger economic costs.
The NSW Treasury estimated that the initial three-week state lockdown would come at a cost of $2.5 billion, or around $0.83 billion/week. Since then, the Federal Treasurer has said that the Commonwealth Treasury’s estimate of lockdown costs is around $0.7 billion/week, while some private sector forecasters have suggested a higher cost of around $1 billion/week.
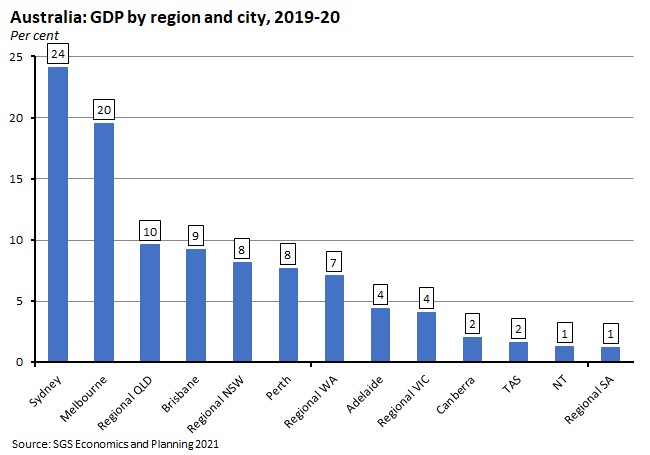
As a simple illustration of the potential scale of effects, if we assume a cost of $1 billion/week, a lockdown period of five weeks (based on current announcements of the NSW lockdown continuing until end July, although there is a clear risk that the actual duration will significantly exceed this), and a national quarterly GDP of around $500 billion, that implies that the Sydney lockdown could cost up to one per cent of quarterly GDP. That is before considering an extension beyond 30 July and /or the impact of lockdowns in other states such as Victoria.
What happened:
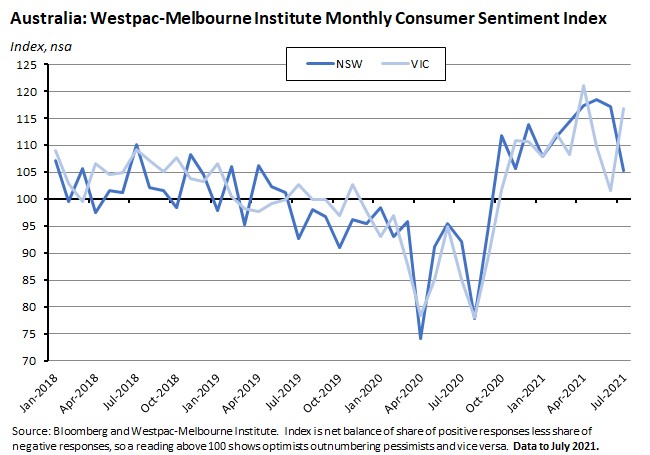
The Westpac-Melbourne Institute Index of Consumer Sentiment (pdf) rose 1.5 per cent to an index reading of 108.8 in July 2021.
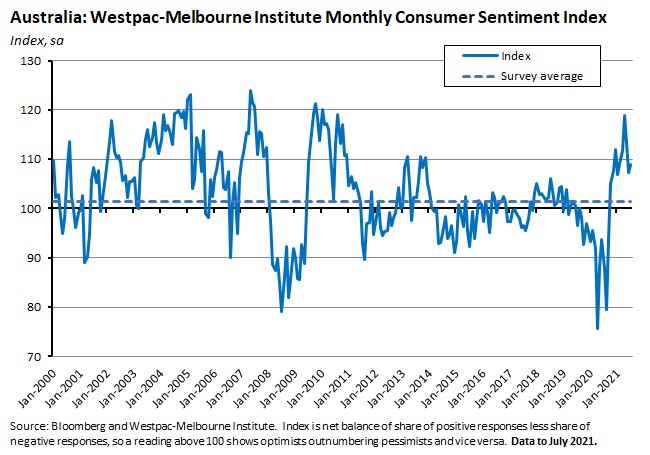
Of the five subindices, four registered increases over the month with only one, ‘economic conditions – next five years,’ suffering a decline.
Confidence in NSW dropped by 10.2 per cent over the month, led by a 13.6 per cent slump in Sydney. But the resultant drag on the overall index was more than offset by marked recoveries in consumer sentiment in Victoria (up 15 per cent) and Western Australia (up 10.5 per cent) as both states exited lockdowns.
The Westpac Melbourne Institute Index of Unemployment Expectations rose 1.1 per cent in July, indicating a slight increase in the share of respondents expecting a rise in the unemployment rate over the coming year.
Why it matters:
After having fallen for two consecutive months, taking the headline index down 9.8 per cent, consumer sentiment edged higher in July to leave sentiment well above the survey average. That was despite developments in Sydney. In that context, note that the supporting survey was conducted over the week of 5-9 July 2021, during the lockdown in Sydney and restrictions in regional New South Wales, but before the tightening of restrictions announced on 9 July. Westpac notes that this means that responses may have reflected the assumption of a shorter period of restrictions than will now be the case, suggesting additional downside risk to next month’s survey.
July’s results also show that developments in Sydney have not (yet?) had negative effects on consumer confidence in the rest of Australia. Rather, sentiment has improved elsewhere. That was particularly the case in Victoria and Western Australia as both states emerged from their own public health restrictions after having seen sentiment fall over the previous two months (down 16 per cent in Victoria and 18 per cent in Western Australia).
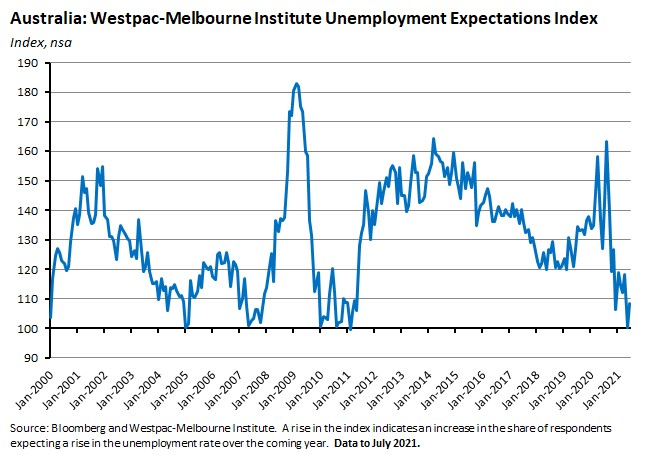
Finally, and despite the modest increase in expectations regarding the future of the unemployment rate reported this month, the Unemployment Expectations index is still signalling some of the strongest labour market conditions seen over the past decade. That result is consistent with the fall in the actual unemployment rate in June.
What happened:
The NAB Monthly Business Survey for June 2021 showed business conditions slumping by 12 index points over the month while business confidence fell nine points.
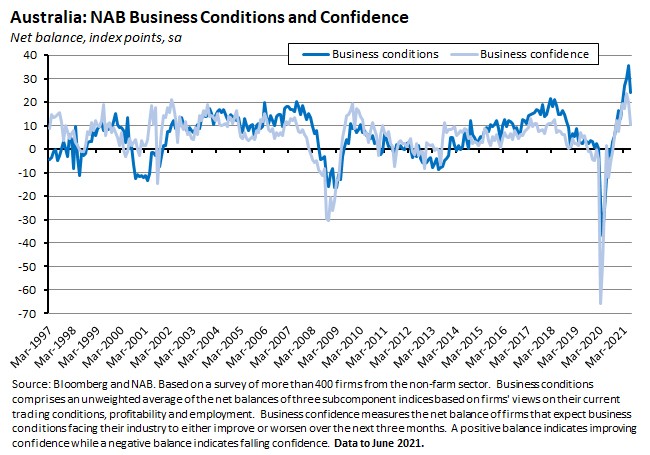
All three subcomponents of business conditions fell last month: trading conditions fell 10 points, profitability dropped 14 points and employment declined eight points.
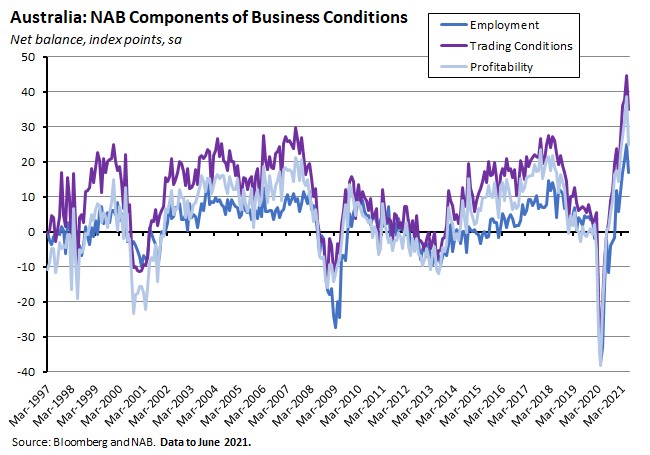
By industry, the biggest declines in business conditions were suffered by finance, business and property, and mining while conditions fell across all states with the exception of Western Australia. Victoria saw the biggest decline in business conditions at the state level with a fall of 18 points followed by Tasmania (down 16 points) while there were smaller (between three and six point) declines in New South Wales, Queensland and South Australia.
Business confidence fell in all industries except mining and manufacturing with a particularly large (27 point) decline in recreation and personal. By state, the biggest declines in confidence came in New South Wales and Queensland.
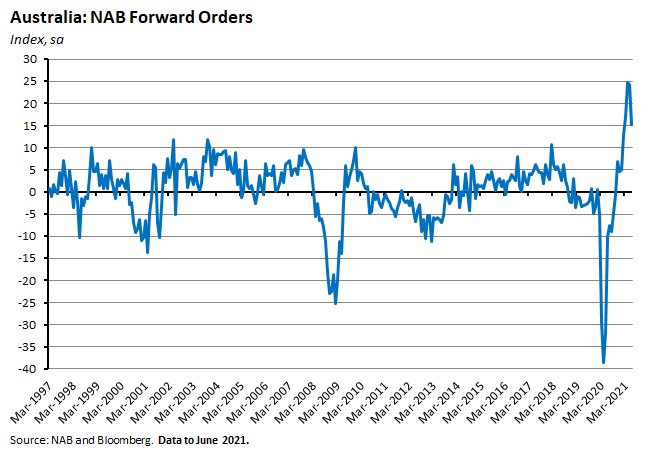
Leading indicators also softened in June, with forward orders sliding by nine points.
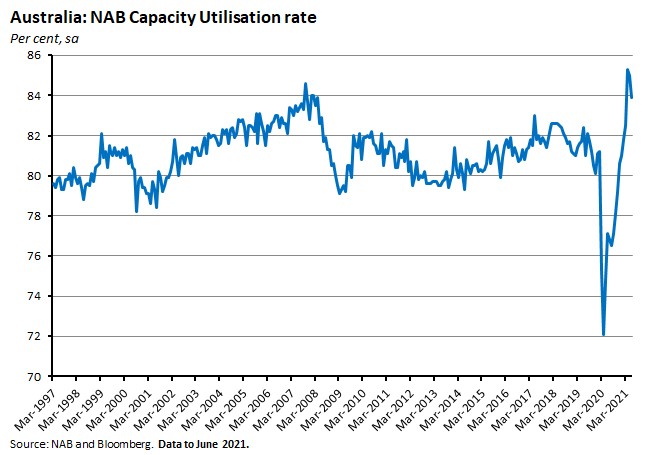
Likewise, the rate of capacity utilisation fell from 85 per cent in May to 83.9 per cent in June.
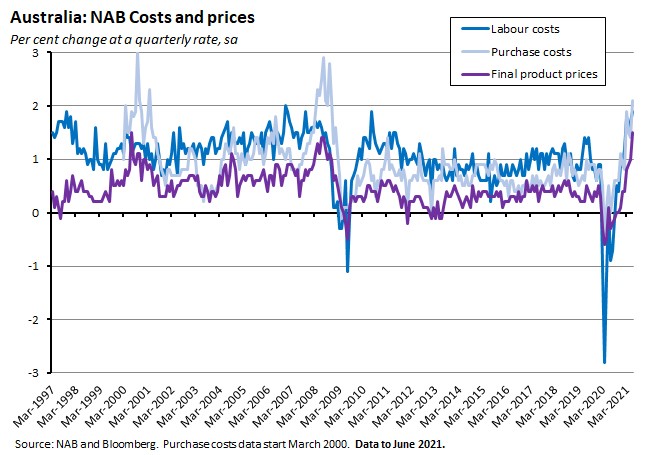
Finally, reported cost pressures continued to build in June, with increases in the rate of change of labour costs and purchase costs along with a rise in the rate of growth for final products prices.
Why it matters:
June’s business survey results show the combined impact of pandemic news and state government lockdowns, with NAB noting that the survey ‘was conducted between 18 and 30 June. While NSW had not quite entered the first stage of the lockdown in the early part of the survey period, the Sydney metropolitan area, as well as a number of other capital cities, had locked down by the end of field work.’ The decline in business confidence over the month was driven by sharp falls in NSW and Queensland (although it was broad-based across all states) while the drop in business conditions was driven by developments in Victoria.
While these sizeable monthly declines testify to the pandemic’s ongoing ability to disrupt business conditions and confidence, however, it’s also important to note that both indices remained elevated relative to their typical level across recent years. That dichotomy reflects the fact that the previous survey May had delivered an extremely strong set of results: business conditions, employment, profitability and trading conditions had all hit new record highs, forward orders had remained steady at the record level set in April, capacity utilisation had continued to run hot, and although business confidence had retreated from a record April result, it was still well-above its survey average.
What happened:
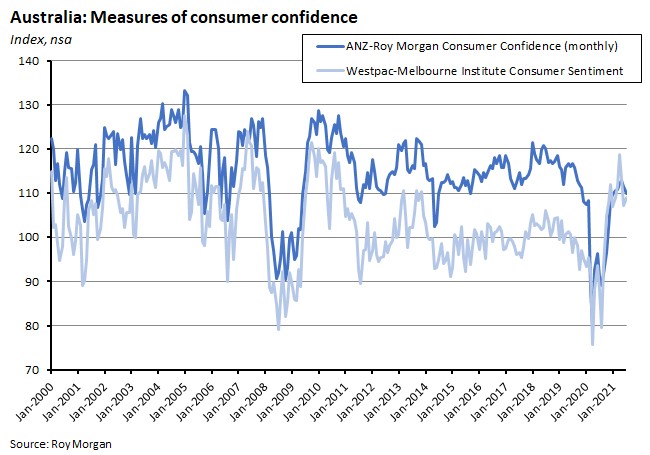
The ANZ-Roy Morgan index of consumer confidence rose two per cent over the week, taking the index to 110 for the week ending 10-11 July 2021.
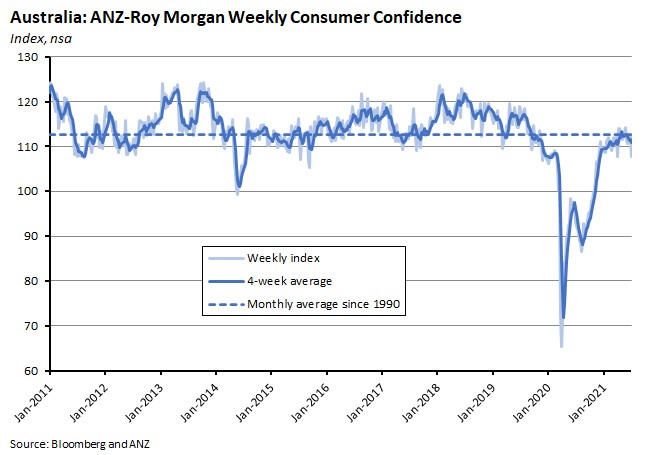
All five subindices rose, with the largest increase for ‘future economic conditions’ (up by 3.7 per cent) and the smallest for ‘current financial conditions’ (up just 0.4 per cent).
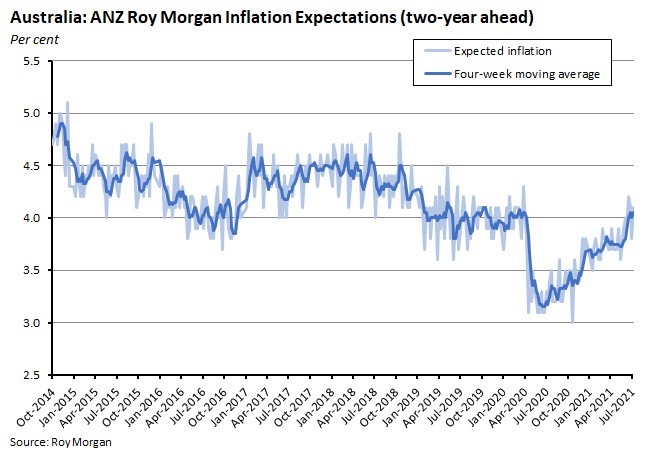
Inflation expectations (two-years ahead) were at 4.1 per cent. Inflation expectations on this measure have now unwound their pandemic-led period of weakness but have not yet shown any breakout relative to their pre-pandemic history.
Why it matters:
The recovery in confidence likely reflects the exit of Brisbane, Perth and Darwin from their lockdowns. Confidence in Sydney was also up 3.7 per cent over the week (after having slumped 8.9 per cent the previous week), possibly buoyed by the announcement of enhanced support from the Federal government.
. . . and what I’ve been following in the global economy.
What happened:
The US Bureau of Labor Statistics (BLS) said that the US consumer price index (CPI) rose 0.9 per cent over the month in June to be up 5.4 per cent over the year.
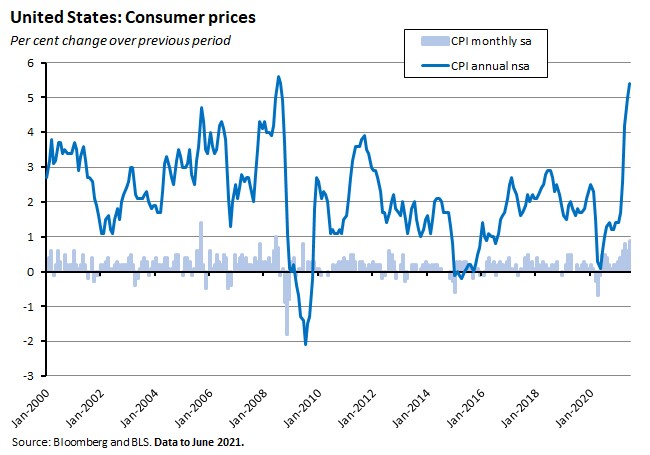
The BLS said that the index for used cars and trucks continued to rise sharply over June, increasing 10.5 percent in monthly terms and accounting for more than one-third of the seasonally adjusted all items increase. There were smaller but still substantial monthly increases for new vehicles (up two per cent month-on-month), the food index (up 0.8 percent month-on-month) and the energy index and transport services (both up 1.5 per cent month-on-month).
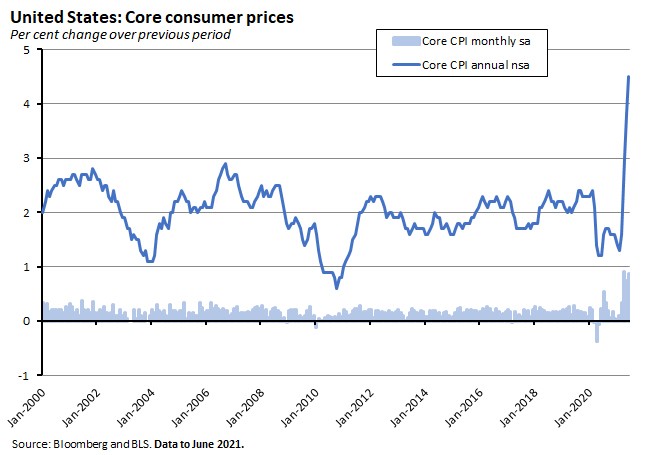
Core inflation (which excludes the typically volatile food and energy components) rose 0.9 per cent in monthly terms and 4.5 per cent in annual terms.
Why it matters:
Markets had expected a strong inflation reading in June, predicting that the CPI would be up 0.5 per cent over the month and 4.9 per cent over the year. But the actual outcome (0.9 per cent and 5.4 per cent, respectively) was even stronger. The BLS pointed out that June’s reading was the largest one-month change in the CPI since June 2008 and the strongest annual reading in more than a decade, since August 2008.
Last month, when we did a deep dive on the US May CPI result, we noted that a critical debate for the future policy stance of the US Fed was the extent to which the current spike in inflation is a ‘transitory’ response to the economy emerging from the pandemic as opposed to a sign of significant and persistent underlying inflationary pressures. The Fed’s view, as stated most recently in its July 2021 Monetary Policy Report to Congress, is that the former is more likely. It argues that the spike in inflation is a product of temporary factors and that as ‘these extraordinary circumstances pass, supply and demand should become better aligned, and inflation…move down toward the FOMC's two percent longer-run goal.’ (Note that the Fed’s preferred measure of inflation is not the CPI but rather Personal Consumption Expenditure (PCE) inflation, which tends to run a bit lower than the former.)
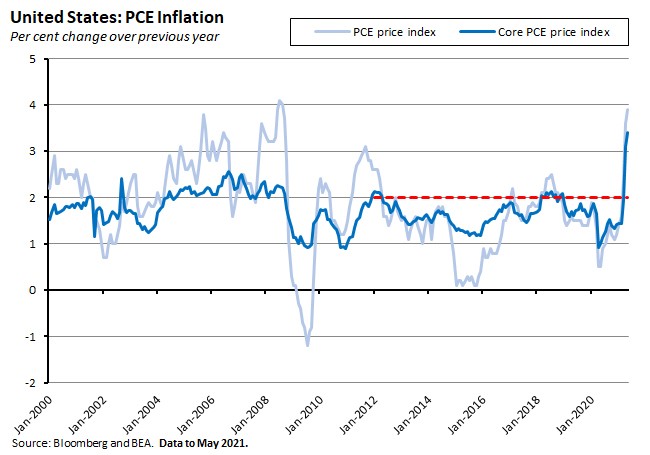
Fed Chair Powell repeated this analysis in this week’s testimony to Congress, stating that:
‘Inflation has increased notably and will likely remain elevated in coming months before moderating. Inflation is being temporarily boosted by base effects, as the sharp pandemic-related price declines from last spring drop out of the 12-month calculation. In addition, strong demand in sectors where production bottlenecks or other supply constraints have limited production has led to especially rapid price increases for some goods and services, which should partially reverse as the effects of the bottlenecks unwind. Prices for services that were hard hit by the pandemic have also jumped in recent months as demand for these services has surged with the reopening of the economy.’
And the detail of the June report does provide a fair amount of support for the Fed’s view. For example, base effects continue to be important: compared with two years ago, the June CPI was up a rather more modest three per cent. Likewise, many of the big price rises over the month were indeed in sectors that have been subject to substantial pandemic-related disruption. As noted above, price increases for used cars alone accounted for about one third of the overall increase in CPI inflation in June. And many of the other outsized price moves came from vaccine-enabled re-openings in the travel, transport and entertainment sectors, with air travel, hotels, rental cars, entertainment and recreation all experiencing surging prices in the face of rebounding demand. Bloomberg Economics estimates that just six components – used cars, rental cars, vehicle insurance, lodging, airfares and food away from home – drove 55 per cent of the monthly increase in June (up from 52 per cent in May). Add in energy costs and that share rises to 66 per cent. All that said, however, there were also signs of underlying inflation pressures, with rental costs on the rise, for example.
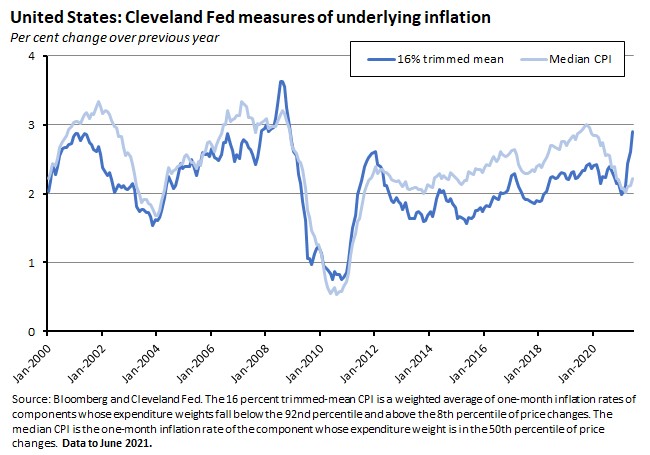
Measures of underlying inflation are sending some mixed signals. On the one hand, they remain considerably more subdued than the headline numbers. Nevertheless, they are also on the rise. For example, the Cleveland Fed’s 16 percent trimmed-mean CPI (which is a weighted average of one-month inflation rates of components whose expenditure weights fall below the 92nd percentile and above the 8th percentile of price changes) and median CPI (the one-month inflation rate of the component whose expenditure weight is in the 50th percentile of price changes) suggest that the annual rate of underlying inflation in June was somewhere between 2.2 per cent and 2.9 per cent.
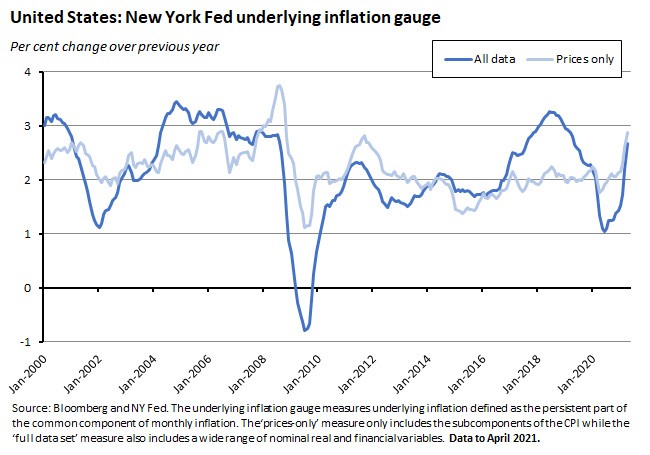
Similarly, the NY Fed’s underlying inflation gauge (UIG) estimates that trend CPI inflation is now in the 3.4 per cent to 3.5 per cent range.
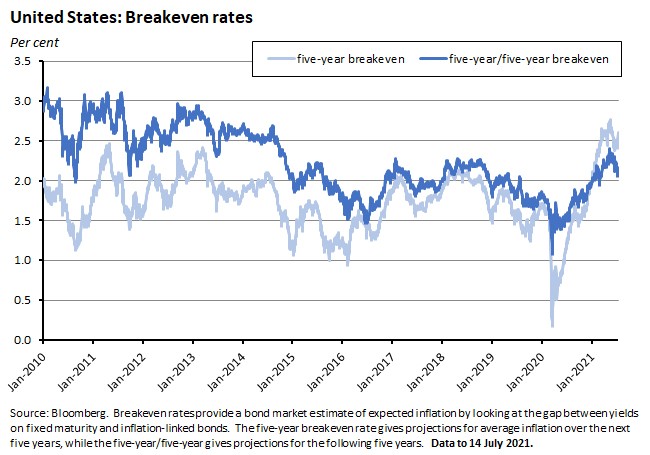
Moreover, and again as noted last month, the Fed will also be keeping a close watch on what’s happening to inflation expectations. It stated in its latest monetary policy report that there would be a risk ‘if longer-term inflation expectations were to rise persistently above levels consistent with the Federal Open Market Committee's (FOMC) longer-run inflation goal. Inflation expectations are often seen as a driver of actual inflation, which is why a fundamental aspect of the FOMC's monetary policy framework is for longer-term inflation expectations to be well anchored at the Committee's two percent longer-run inflation objective.’
In this case, the data show that although financial markets have clearly revised their near-term expectations higher, they are still some distance from predicting a major inflationary breakout beyond that. For example, while the five-year breakeven rate has now climbed above 2.5 per cent, the five-year/five-year rate (which captures inflation expectations for the following five years) remains lower at around 2.2 per cent. Although, as previously noted, inflationistas could fairly point to the significant distortions to bond markets created by QE as a complicating factor in interpreting this kind of data.
High headline rates are now having an impact on the public’s views on price pressures. The NY Fed’s latest survey of consumer inflation expectations shows median inflation expectations at the one-year horizon climbing to 4.8 per cent in June, a series record and the eighth consecutive monthly increase. Again, however, this rate of increase is not expected to persist - at the three-year horizon, expectations in June remained unchanged from May’s reading at 3.6 per cent.
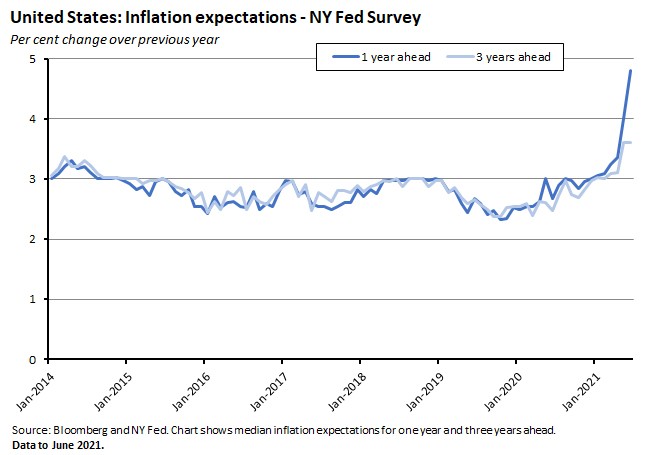
The combination of rising inflationary expectations and surging headline rates will keep a degree of pressure on the Fed’s current policy stance, with Powell telling Congress that the Fed remains ‘prepared to adjust the stance of monetary policy as appropriate if [it] saw signs that the path of inflation or longer-term inflation expectations were moving materially and persistently beyond levels consistent with [its] goal.’
What happened:
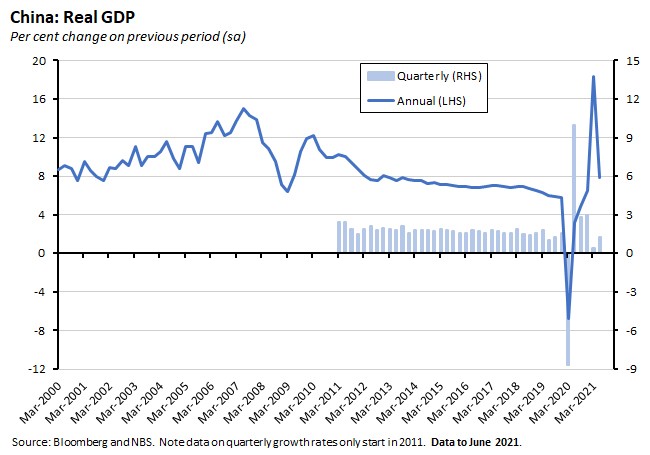
China’s real GDP rose 1.3 per cent over the June quarter to be up 7.9 per cent over the year.
Why it matters:
After the People’s Bank of China (PBOC) cut the reserve requirement ratio (RRR) by 50bp last week, delivering the first reduction in the RRR since March 2020, one interpretation of its move was that China’s central bank had been trying to inject some life into a flagging recovery. This had increased the focus on this week’s GDP release although in the event, the GDP results were broadly in line with consensus expectations: the market had expected a slightly lower quarterly growth outcome of one per cent and a marginally higher annual growth rate of eight per cent. Note that the big decline in the annual growth rate from 18.3 per cent last quarter had been expected as base effects from last year’s COVID-19 lockdown dropped out of the data. Otherwise, the second quarter results keep China on track to comfortably meet this year’s official growth target of six per cent.
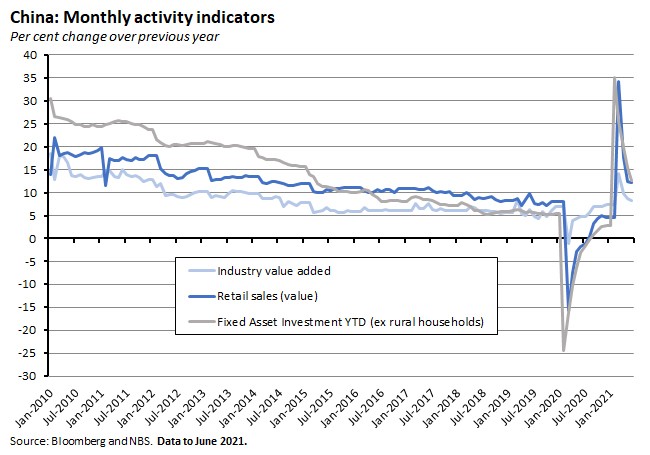
A raft of monthly data releases also provided some reassurance on the growth front. Industrial production (up 8.3 per cent over the year vs consensus expectations for a 7.9 per cent print), retail sales (up 12.1 per cent over the year vs consensus forecasts of 10.8 per cent) and fixed asset investment (up 12.6 per cent over the year to date vs consensus forecasts of 12 per cent) all came in better than expected. China’s industrial production and trade performance in particular have both been boosted this year by the ongoing surge in global goods demand, although it’s possible that a switch in consumption patterns from goods to services later in the year will bring a relative decline in the role played by this external support for activity.
What happened:
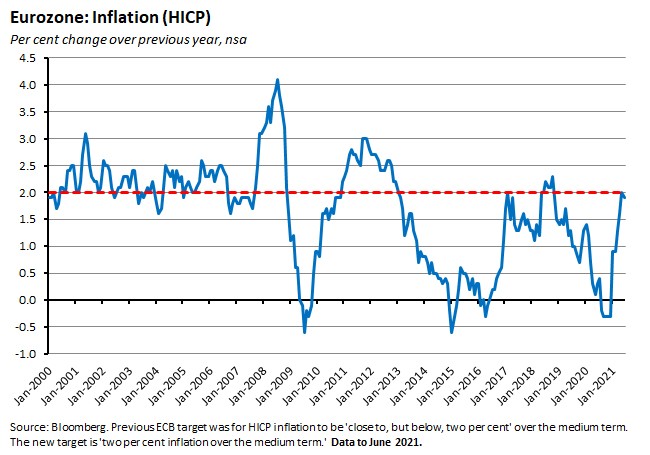
Last week, the European Central Bank (ECB) released its latest monetary policy strategy statement. The ECB’s new monetary strategy sets an inflation target level of two per cent over the medium term, based on the headline Harmonised Index of Consumer Prices (HICP). This target replaces the ECB’s previous ‘double-key’ formulation which featured a definition of price stability in terms of inflation within a range from zero to two per cent and, within this definition, an inflation target of below, but close to, two per cent.
The ECB’s new target is symmetric, meaning that the central bank’s Governing Council ‘considers negative and positive deviations of inflation from the target to be equally undesirable.’ In this context, the ECB notes that the previous ‘double-key formulation may have led to possible ambiguity about the level of the inflation aim and a perception of the aim being asymmetric, which – in proximity to the effective lower bound – may have contributed to the low-inflation environment.’
The ECB also announced two other significant changes, although both will take time to implement. First, it has pledged to adopt a roadmap to include owner-occupied housing (OOH) in the HICP, although for now it is ‘too early to provide a precise timetable’ as to when the augmented version of the HICP will become the new inflation target, given that ‘the full inclusion of owner-occupied housing in the HICP is a multi-year project.’ Note that when owner-occupied housing is included in the revised HICP this will have the effect of mechanically increasing the headline inflation rate for a given policy stance.
Second, the ECB’s Governing Council ‘has committed to an ambitious climate-related action plan. In addition to the comprehensive incorporation of climate factors in its monetary policy assessments, the Governing Council will adapt the design of its monetary policy operational framework in relation to disclosures, risk assessment, corporate sector asset purchases and the collateral framework.’ In particular, the central bank will use disclosures as a requirement for eligibility as collateral and asset purchases and ‘take into account EU policies and initiatives in the field of environmental sustainability disclosure and reporting’ and use these to ‘introduce disclosure requirements for private sector assets as a new eligibility criterion or as a basis for a differentiated treatment for collateral and asset purchases.’
Why it matters:
The ECB’s previous strategy review had been all the way back in 2003, with the current review following the appointment of Christine Lagarde to replace Mario Draghi as president of the central bank in late 2019.
The key monetary policy shift is the replacement of the ‘close to, but below, two per cent’ inflation target with a symmetric two per cent target. For much of the past decade the ECB has failed to hit its old target, creating the perception that in practice the target was asymmetric with the bank much happier to undershoot than overshoot. The new setup is designed to signal that there is no such asymmetry by explicitly allowing for potential overshooting as well as undershooting. It should thereby also make it easier for the ECB to stick with its current stance of very easy monetary policy for longer.
The new strategy can also be seen as a product of the common challenge that has been facing many of the world’s leading central banks since at least the global financial crisis - how to adjust to an operating environment in which the ‘normal’ level of interest rates is very low and close to the effective lower bound, due to a sustained decline in the neutral rate of interest or r-star. The difficulty for monetary policy is that a low r-star leads to an increased risk of hitting the effective lower bound and thereby exhausting conventional policy ammunition. That in turn creates a policy imbalance: it remains relatively easy for the central bank to hike interest rates to cool an overheating economy, even as the scope to cut interest rates is much reduced. That in turn increases the risk of recessions and of inflation being stuck below target, a calculation reflected in falling inflation expectations that in turn drags down nominal interest rates and thereby further squeezes the available policy space. In response to this problem, the ECB has now pledged ‘especially forceful or persistent monetary policy action’ when the policy rate approaches the effective lower bound and when inflation is below target, including by signalling that it would accept a ‘transitory period in which inflation is moderately above target’. That commitment should, all else equal, also reduce the risk of a future premature tightening of monetary policy.
Seen in that context, these changes to the ECB’s strategy are part of a wider shift across the world’s leading central banks towards a less hawkish interpretation of their inflation-fighting mandates. Still, the ECB’s shift is a relatively conservative one and does not go as far, for example, as the US Fed’s adoption last year of average inflation targeting in response to its own review of monetary policy strategy. The crucial difference between the two frameworks is that the Fed’s new approach allows for a period of ‘catch-up’ inflation: the FOMC ‘seeks to achieve inflation that averages two per cent over time, and therefore judges that, following periods when inflation has been running persistently below two per cent, appropriate monetary policy will likely aim to achieve inflation moderately above two per cent for some time.’ In her press conference announcing the new strategy, Lagarde stated explicitly that the ECB was not adopting the Fed’s approach.
The other big change to the ECB’s strategy involved measures to ‘green’ monetary policy, with commitments to construct new models of the financial impact of climate change, conduct more stress tests, push for enhanced disclosures of environmental risk, and adjust the ECB’s own policies regarding asset purchases and the acceptance of collateral. In contrast to its monetary policy target, here the ECB is out ahead of the US Fed in terms of the boldness of its initiatives.
What I’ve been reading . . .
- Two pieces from Gareth Hutchens at ABC Business digging into the economics of NAIRU and output gaps and the relationship between inflation and unemployment.
- New analysis from Deloitte on the future of employment and economic activity in Melbourne’s CBD post-COVID. This also includes comparable employment forecasts for Sydney, Brisbane, Adelaide and Perth. Deloitte reckons that employment of people working in Brisbane and Perth will return to 2019 levels during 2023 and in Adelaide by the start of 2026. Employment in Melbourne and Sydney is not forecast to return to pre-COVID levels over the next five years, however, with Melbourne suffering the largest employment gap across the state capitals. (The assessments don’t consider the impact of the latest round of lockdowns.)
- Quiggin and Holden on economists and lockdowns.
- Four papers from this month’s Melbourne Economic Forum on the labour market after the pandemic are available for download.
- Two posts from the AusTax policy blog. First, Robert Breunig argues that there is a growing disconnect in Australia between taxing income and taxing wealth with problematic intergenerational consequences. Second, Miranda Stewart and Teck Chi Wong review survey evidence on the accountability of initial COVID-19 fiscal policy responses of 120 countries. The results find that no country had a ‘substantive’ level of fiscal accountability and only four (Australia, Norway, Peru and the Philippines) an ‘adequate’ level.
- Grattan on three approaches to net zero for Australia.
- The ABS published the final release in its Household Impacts of COVID-19 Survey, conducted between 11 – 20 June 2021. Findings included that 26 per cent of respondents said that life in Australia would take more than a year to return to normal, up from 14 per cent in November 2020 while 16 per cent said that life would never return to normal, up from 11 per cent in November 2020. In June, 37.4 per cent of respondents reported working from home one or more times a week, up a little from a 35.9 per cent rate in April 2021 and well up on the 24 per cent reported in March 2020 (pre-COVID).
- Also noted from the ABS, the 2020-21 guide to Australia’s national accounts.
- APRA’s draft expectations on Australian banks’ readiness for zero or negative interest rates.
- An Economist magazine briefing on global inflation. Booming consumer demand for durable goods, disrupted global supply chains and a rebound in the price of services are all driving higher prices, although for now inflation expectations (at least in the developed world) remain ‘well-anchored’ to use the jargon. What happens with wages will be critical to what comes next.
- And from the same source, can central banks taper without the tantrum?
- This interesting working paper from the World Bank looks at the impact of natural disasters on global supply chains by focusing on developments in the automobile and electronic sectors after the 2011 earthquake in Japan. The analysis finds that the 2011 Japan shock did not lead to reshoring, nearshoring, or an increase in import diversification to reduce risk, and that what production relocations took place in subsequent years were driven by fundamentals such as transport costs, not policies. One implication is that contrary to some initial expectations, the impact of COVID-19 on GVCs could turn out to be rather modest.
- From VoxEu, the race between vaccinations and new COVID variants (OECD economists argue that quick vaccine rollouts can substitute for lockdown policies at a lower economic cost, but success requires a high share of the population is vaccinated), a look at some of the implications of the rise of anywhere jobs (non-routine service jobs that can be done from anywhere in the global economy), and some survey evidence on how boards and shareholders design CEO pay (directors and investors tend to disagree on the appropriate level of pay and the relative importance of long-term incentives but tend to agree that a CEO’s intrinsic motivation and personal reputation are critical factors).
- The Credit Suisse Global Wealth Report 2021 reports that despite the pandemic, total global wealth grew by 7.4 per cent last year, or by $US28.7 trillion, to end 2020 at US$418.3 trillion. Wealth inequality also rose sharply. The increase in overall global wealth reflects increases in wealth in North America (up US$12.4 trillion), Europe (US$9.2 trillion) and China (US$4.2 trillion) while aggregate wealth fell in India and across Latin America. Wealth per adult rose by six per cent to reach another record high of US$79,952 last year with the biggest per capita increases recorded in Switzerland (up US$70,729) and here in Australia (up US$65,695). The worldwide number of (US dollar) millionaires expanded by 5.2 million to reach 56.1 million or more than one per cent of all global adults. The US accounted for 39 per cent of this group, followed by China (nine per cent). The number of ultra-high net worth individuals (with a net worth in excess of US$50 million) rose 23.9 per cent over 2020 to 215,030.
- Vanity Fair on Silicon Valley tech workers’ reluctance to return to the office.
- How the EU bungled Brexit.
- The BP Statistical Review of World Energy 2021 depicts an historic year in global energy markets in response to the pandemic. Primary energy consumption fell by 4.5 per cent in 2020, marking the largest decline since 1945. That drop was driven mainly by oil, which contributed almost three-quarters of the net fall in energy consumption although there were also significant declines in the consumption of natural gas and coal. In contrast, wind, solar and hydroelectricity all grew. Carbon emissions from energy use declined by 6.3 per cent last year, falling to their lowest level since 2011 and recording their largest decline since 1945.
The FT’s Martin Wolf was not impressed by the recent G20 meeting, arguing that the collective failure to manage the pandemic bodes ill for future progress on dealing with climate change.
Meanwhile, China is set to launch the world’s largest emissions trading program while the EU is proposing a carbon border-adjustment mechanism (CBAM).
The Macro Musings podcast has an interesting discussion with Jason Furman on (US) overheating, inflation, and fiscal policy in an era of low interest rates.
And the Odd Lots podcast digs into the US employment situation with an in-depth look at how one hotel chain is managing the current environment.
Latest news
Already a member?
Login to view this content


