Ahead of a big news week next time, with a cut in the cash rate expected from the Reserve Bank, this week was pretty quiet on the data front.
The main development was that inflation returned in the September quarter, following the previous quarter’s record-breaking quarterly decline in the CPI. Consumer confidence rose for an eighth consecutive week. Preliminary trade data for September show how the pandemic continues to influence the pattern of imports. PMI readings suggests business activity continued to strengthen in October. More ABS survey data on the impact of COVID-19 on firms. And global trade has made a partial recovery from the big drop it suffered earlier this year.
This week’s readings include ABS data on COVID-19 and excess deaths in Australia, quarterly business surveys from the NAB, an update on the state of the states, economists grade the October budget, how China is reshaping the global middle class, how textiles have changed the world, the relationship between the pandemic, unemployment, insolvencies and sectoral reallocation and a conversation with 538’s Nate Silver that offers a deep dive into polling, probabilities, uncertainty and what’s different between the 2016 and 2020 US presidential elections.
On this week's Dismal Science podcast we look ahead to the election next week, its significance and who is likely to win.
You can subscribe and listen to The Dismal Science on your podcast player of choice at the links below.
Apple Podcasts | Google Podcasts | Spotify | Overcast | Stitcher
What I’ve been following in Australia . . .
What happened:
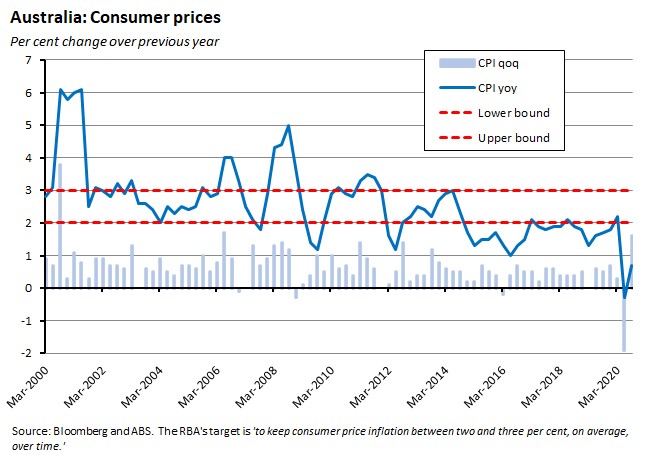
According to the ABS, the Consumer Price Index (CPI) rose 1.6per cent over the September quarter and was up 0.7 per cent in annual terms.
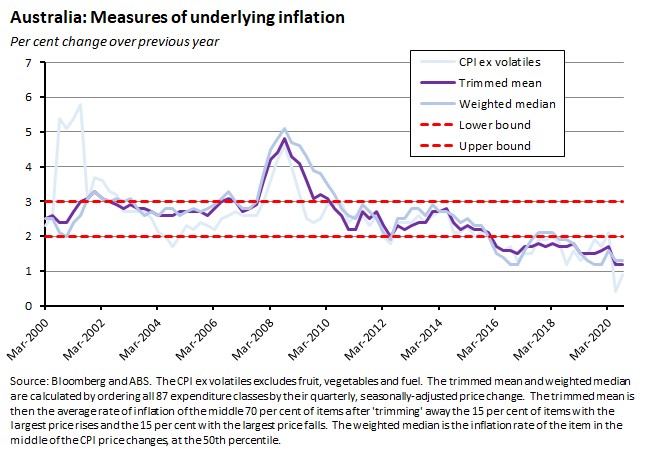
In terms of measures of underlying inflation, the trimmed mean (usually treated as the RBA’s preferred measure) was up 0.4 per cent over the quarter and 1.2 per cent over the year, while the weighted median rose 0.3 per cent over the quarter and 1.3 per cent in annual terms.
By group, the largest quarterly price rises were in furniture, household equipment and services, transport and education.
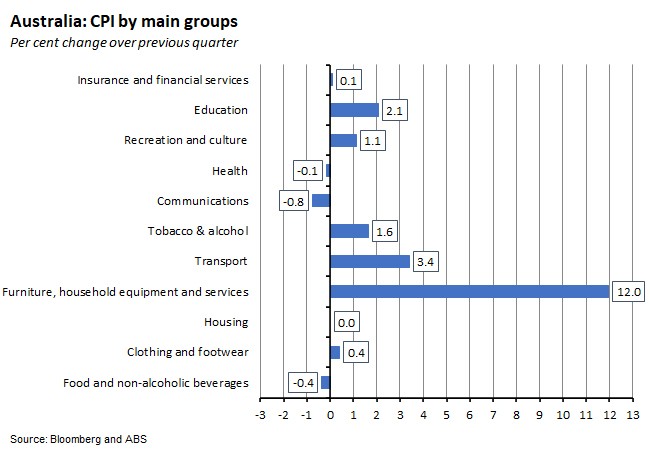
The big 12 per cent quarterly increase in furniture, household equipment and services was mainly a product of a sharp rise in child care costs. Indeed, the cost of childcare was the single largest contributor to September’s 1.6 per cent quarterly increase in the headline CPI. All up, the ABS estimates that higher child care costs added 0.9 percentage points to the headline quarterly inflation rate in the September quarter after having subtracted 1.1 percentage points from the June quarter result.
The key factor here was the government’s Early Childhood Education and Care Relief Package which provided free childcare between 6 April and 12 July and contributed to a 95 per cent fall in the cost of childcare in the June quarter. After that initiative expired, fees were reinstated from 13 July and that meant that families (excluding in Melbourne) paid childcare fees for 58 out of 66 business days across the September quarter. That helped push the quarterly rate of inflation in the furnishings, household equipment and services group up to 12 per cent (excluding childcare costs, the rise would have been 1.3 per cent). The same group also saw price rises of 6.4 per cent in furniture and 5.3 per cent in major household appliances, reflecting strong demand for products such as home office furniture and fridges and freezers, as well as some supply constraints.
Higher childcare costs were also reflected in a 2.1 per cent rise in the Education group, driving an increase of 11.1 per cent for preschool and primary education due to the ending of free before and after school care, again as part of the expiry of the Early Childhood Education and Care Relief Package.
After childcare costs, the second key driver of price pressures in the September quarter was the 3.4 per cent increase in the transport group, which was driven by rises of 9.4 per cent in automotive fuel and 2.5 per cent in motor vehicles. Those rise in fuel prices reflected the combined impact of global oil prices of a partial recovery in world oil consumption alongside a reduction in global oil production. The ABS estimates that higher fuel prices added 0.3 percentage points to the headline rate of inflation in the September quarter after having subtracted 0.7 percentage points in the June quarter.
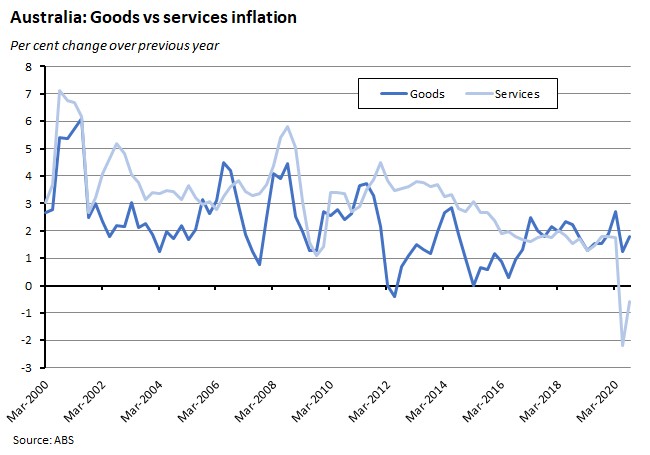
The impact of the swings in childcare payments in particular was has also been apparent in a marked divergence between measures of goods and services inflation.
Finally, by capital city, the rate of quarterly increase ranged from 0.9 per cent in Melbourne to 2.3 per cent in Brisbane and Canberra.
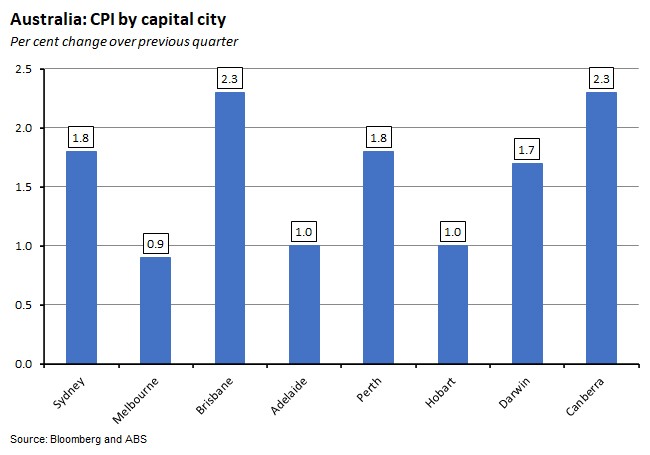
In annual terms, prices rose in every city with the exception of Darwin, which saw a 0.4 per cent decline.
Why it matters:
The quarterly CPI series has delivered two big results in succession. The June quarter saw the biggest quarterly decline in the history of the series. And now the September quarter has produced the fastest quarterly increase since 2006 as the inflation rate returned to positive territory. September’s inflation print was fairly close to market expectations, with the median forecast of a 1.5 per cent quarterly rise and a 0.6 per cent annual increase not far off the actual outcomes of 1.6 per cent and 0.7 per cent, respectively.
In both the June and September quarters, the headline rate of CPI inflation has been knocked around quite substantially by the shifting cost of childcare (the ABS estimates that excluding the impact of child care, the headline CPI would have risen only 0.7 per cent over the September quarter, for example) along with major swings in the global oil price and the consequent implications for domestic automotive fuel prices. The headline rate has also been influenced by the impact of missing items due to the pandemic, which has seen some goods and services being temporarily unavailable or businesses being temporarily closed. That has forced the ABS to impute the rate of price change for about seven per cent of the CPI basket (ten per cent in Melbourne). All of which somewhat qualifies the information content of the recent swings in the headline CPI.
More relevant in terms of understanding the ‘true’ inflation picture, therefore, is the underlying rate of inflation. This remains subdued, with the trimmed mean now stuck below two per cent for 19 consecutive quarters. And with a large output gap, high levels of unemployment and underemployment and soft inflationary expectations, the near-term outlook for underlying inflation is for more of the same.
What happened:
The ANZ Roy Morgan weekly index of consumer confidence rose 1.6 per cent on 24/25 October to an index reading of 99.7.
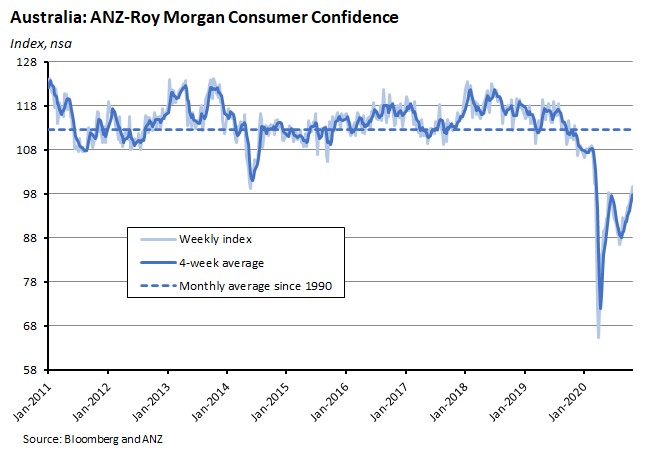
All five subindices increased over the week with the largest gains comprising a 3.5 per cent increase in the measure of current financial conditions and a 2.6 per cent rise in current economic conditions.
Why it matters:
This marked an eighth consecutive weekly increase and takes the index to its highest level in six months. It also means that the index is now only a little below a neutral reading of 100 (although note that despite the run of good news, this still leaves the index level well below its long-run average).
What happened:
The ABS said that preliminary merchandise (goods) trade data for September showed exports of goods up three per cent over the month and imports down one per cent.
The monthly increase in exports was driven by (typically volatile) exports of non-monetary gold, which rose 69 per cent in September following a big fall in August. In annual terms, goods exports in September were down 12 per cent, with the decline mainly driven by falls in gas exports (down 53 per cent), coal exports (down 30 per cent, continuing a declining trend since mid-2019) and exports of non-monetary gold (down 18 per cent). Over the same period exports of metalliferous ores were up 16 per cent.
The decline in imports in September was driven in part by a decline in imports of non-monetary gold, (down 25 per cent). Imports of textile yarn, fabrics and related products, which includes commodities associated with personal protective equipment (PPE) such as facemasks and isolation gowns, also fell further last month, down 29 per cent from August 2020 and continuing the decline from the record high reached in July 2020 (although note that the value of these imports was still up 42 per cent on September 2019). Partially offsetting the overall decline in import values last month was a nine per cent increase in road vehicles.
This marked the fourth consecutive monthly increase in this series.
Why it matters:
The preliminary numbers – particularly on the import side – shine an interesting light on the shifting impact of the pandemic on Australia’s trade profile. For example, on the one hand, the decline in imports of textiles, fabrics and related products reflects the decline in demand for PPE. At the same time, recovering domestic consumer demand is apparent in a recovery in demand for the import of road vehicles, which after dropping by more than $1 billion from April to May 2020 (and remaining low in June 2020) have enjoyed a steady recovery, such that the September 2020 value of these imports was only $1 million less than the corresponding value in September 2019.
What happened:
Last Friday, flash estimates showed the IHS Markit Composite PMI rising to 53.6 in October. (Flash indices are based on around 85 per cent of final survey responses and are intended to provide an advance indication of the final PMI print.)
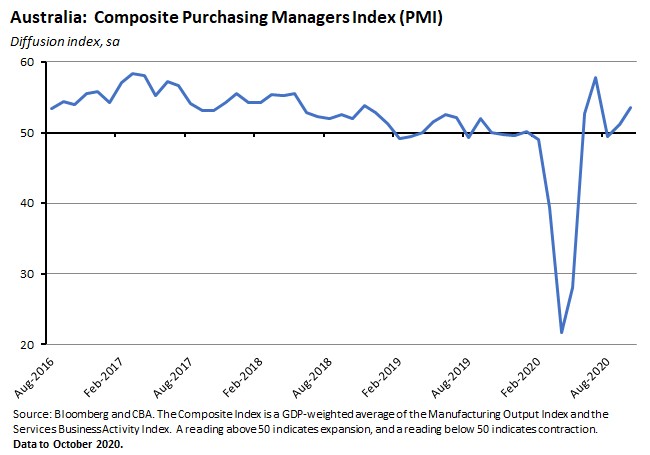
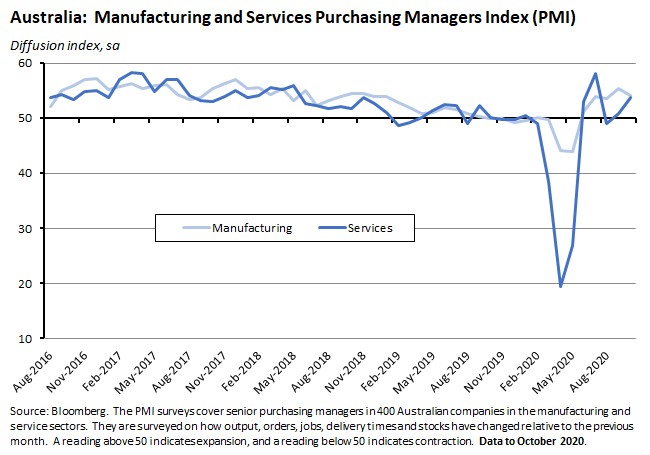
The increase in the composite index in October was driven by a strengthening of activity in the services sector which more than offset a slight weakening in manufacturing activity (although the latter also remained in positive territory).
Why it matters:
The Flash PMI results for October are consistent with the message that the continuing easing of COVID-related health restrictions has boosted activity, particularly in the services sector. IHS Markit also reported that their composite measure of business confidence has risen to its highest in more than two years, with both service and manufacturing businesses indicating a rise in optimism. One note of caution here, however, was that capacity utilisation remains relatively low which, along with only modest growth in new business, indicates that the foundations for that recovery in optimism may still be fragile.
What happened:
Also last week, the ABS released the latest in its series of polls looking at the business impacts of COVID-19. Findings included:
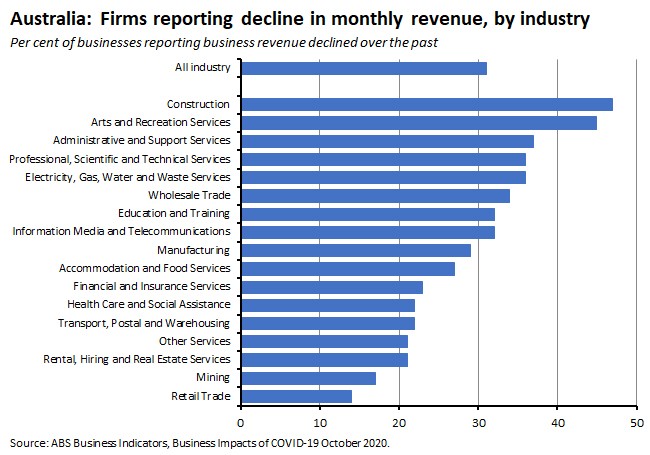
- Fewer businesses reported a revenue decrease in October (31 per cent) compared to July (47 per cent). Firms in the construction (47 per cent), arts and recreation services (45 per cent) and administrative and support services (37 per cent) industries were most likely to report a decline in revenue.
- In October, seven per cent of businesses reported a decrease in the number of employees, down from 13 per cent in July.
- 73 per cent of businesses had not sought additional funds over the last six months. Of that group, 83 per cent said this was because the funds they had were sufficient and 49 per cent did not want to increase debt.
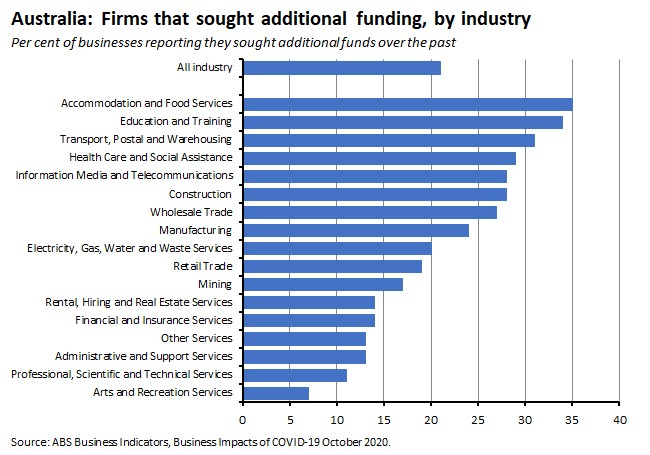
- Of the 21 per cent of businesses that did report seeking additional funds, 72 per cent said they were to cover operating expenses. Businesses in accommodation and food services were the most likely to have sought additional funds (35 per cent), while businesses in arts and recreation services were the least likely (seven per cent).
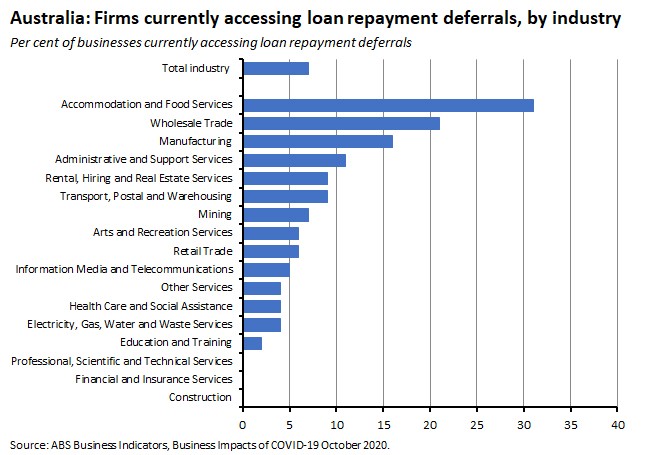
- In October, seven per cent of businesses reported they were deferring loan repayments. That was down from 16 per cent of businesses in May. Businesses in accommodation and food services (31 per cent), wholesale trade (21 per cent) and manufacturing (16 per cent) were most likely to report they were deferring loan repayments.
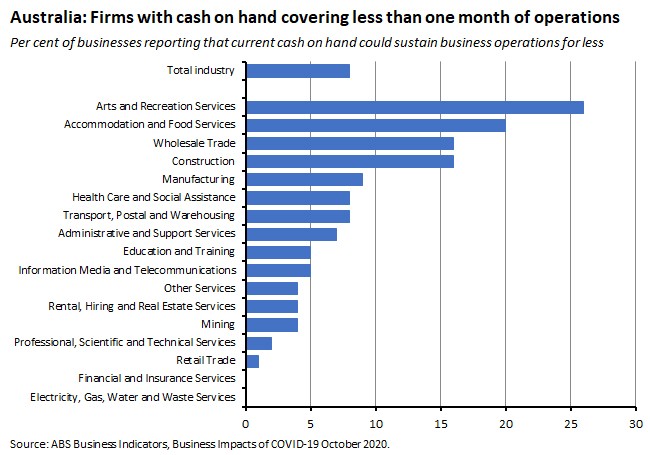
- Twenty-nine per cent of businesses reported that cash on hand could sustain operations for less than three months, with eight per cent saying they could sustain operations for less than one month. By industry, that share varied from 26 per cent for arts and recreation services businesses to zero per cent for finance and utility businesses.
Why it matters:
October’s survey results depict an improving picture for Australian businesses relative to previous survey findings: there were declines in the share of businesses reporting a fall in monthly revenue (down every month from July to October); in the share of businesses reporting a fall in employment; and in the share of businesses reporting that they had sought a deferral of loan repayments.
. . . and what I’ve been following in the global economy
What happened:
The CPB Netherlands World Trade Monitor reported that world trade volumes increased 2.5 per cent over the month in August, down from five per cent monthly growth in July.
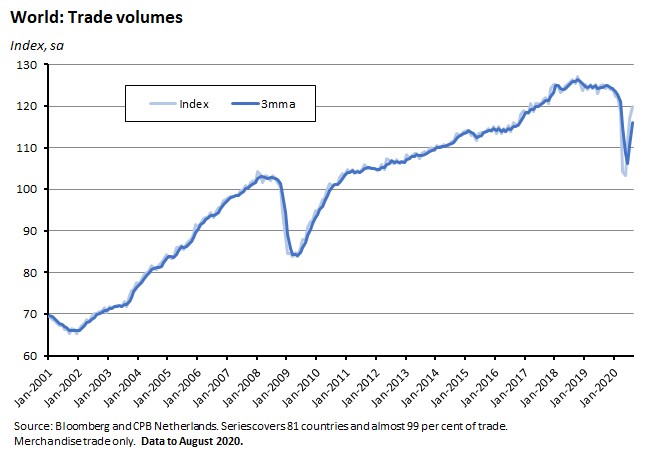
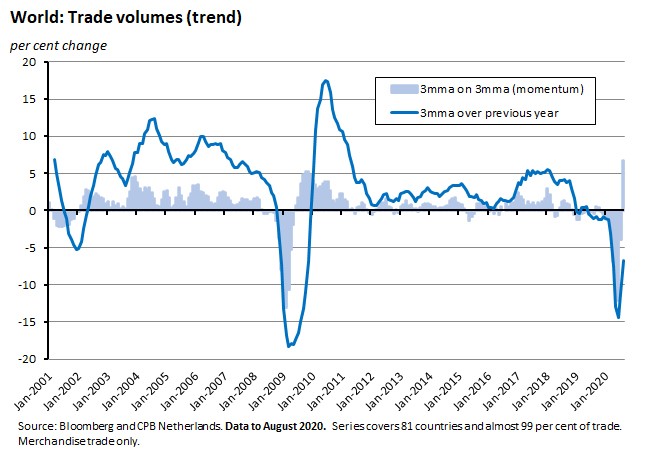
The CPB’s measure of world trade momentum (the change in the average growth over the three months up to the report month over average of the preceding three months) rose to 6.8 per cent. In annual terms, the rate of change remains deep in negative territory, however.
Why it matters:
August marked the first positive reading for global trade momentum since October 2019, ending a run of nine consecutive months of negative results and indicating that the recovery in global economic activity seen in June and July extended into August.
Interestingly, some of the growth in trade was also directly related to demand created by the pandemic, reflecting strong growth in PPE, pharmaceuticals and trade in information technology goods and services (although growth in PPE was particularly strong during the second quarter when other trade flows were contracting).
The recent run of stronger monthly trade outcomes has prompted some revision to trade forecasts. Earlier this month, the WTO upgraded its projection for world merchandise (goods) trade volumes this year to a decline of 9.2 per cent. That was up from its earlier forecast for a drop of at least 12.9 per cent. Although the WTO now anticipates a 7.2 per cent increase in merchandise trade volumes in 2021, which represents a more modest recovery for next year than it had earlier predicted. The IMF has also revised its own forecasts for world trade this year and next. The Fund now sees world volumes of goods and services trade shrinking by 10.4 per cent in 2020 instead of the 11.9 per cent slump it was expecting in June. Unlike the WTO, the Fund has also edged up its trade forecast for 2021, where it now sees volumes up 8.3 per cent instead of eight per cent. (Note that the WTO and IMF are forecasting different concepts, with the former’s forecasts only covering goods trade while the IMF numbers include goods and services).
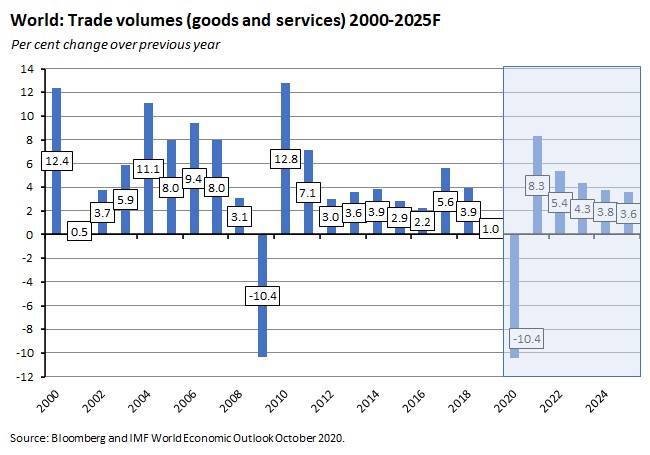
The WTO has pointed out that while the absolute size of the trade decline during the COVID-19 pandemic looks similar in magnitude to the trade decline suffered during the global financial crisis (GFC) the economic context is very different, with the contraction in global GDP during the pandemic much stronger than that suffered during the GFC. As a result, the WTO’s forecast, for example, implies that the volume of world merchandise trade will only decline by around twice as much as the contraction in world GDP (measured at market exchange rates), rather than decline by six times as much seen during the GFC.
What explains this big difference in trade performance relative to GDP? Mainly, the nature of both the pandemic and the policy response (in the form of government lockdowns and travel restrictions) it triggered, both of which have taken an unusually heavy toll on services, both traded and non-traded. At the same time, fiscal and monetary policy have helped support incomes which allowed a recovery in consumption and import demand once lockdown restrictions had been eased.
What I’ve been reading . . .
The ABS has released provisional mortality statistics that include changes in the patterns of mortality during the COVID-19 pandemic and recovery period. According to the ABS:
- Australia had 682 COVID-19 deaths by the end of August, of which 73 per cent were associated with pre-existing conditions. That total includes eight deaths that were suspected as being due to COVID-19, with the virus not confirmed in a laboratory, but excludes a further 18 deaths, where an individual died with COVID-19, but it was not the underlying cause of death.
- The overall Case Fatality Rate (CFR - which measures the ratio of deaths to confirmed infections) for Australia for COVID-19 was 2.7 per cent.
- By demographic sub-groups, CFRs range from 39 per cent for males over 90 to just 0.04 per cent for females aged between 0 and 59.
- The Bureau also looks at the concept of excess mortality, defined as the difference between the actual, observed number of deaths in a specified time period and the expected numbers of deaths in that same time period. The ABS proxies expected deaths by the average number of deaths recorded over the previous five years (2015-2019).
- There were 79,878 doctor certified deaths over the period from 1 January through to 28 July which were registered by 31 August. This compares to a baseline average of 79,590 deaths over the past 5 years.
- Different sub-periods show different patterns. For example, over this period the peak number of COVID cases were recorded from mid-March to mid-April. Case numbers were then low through to mid-June before rising throughout June and July as infection rates in Victoria increased.
- Over the four weeks from 18 March to 14 April there were a total of 11,047 deaths, 914 more than the historic average for 2015-19.
- On the other hand, deaths have been below historical averages since mid-May and largely below even the minimum range of deaths over the 2015-19 period throughout June and July. Between 3 June and 28 July, for example, there were 21,595 deaths which was 1,838 less than the five-year average of 23,433 deaths.
CommSec’s October 2020 State of the States report is now available. According to the report, Tasmania remains Australia’s best performing economy (topping the rankings for a third consecutive quarter) with the ACT climbing into second place and Victoria slipping to third. In terms of the scores underlying the rankings, the ACT, South Australia and Western Australia all saw marked gains over the past quarter while the biggest falls were for Victoria, New South Wales and Queensland.
NAB’s Q3 Business survey shows business conditions rose sharply in the September quarter, climbing 22 points to a reading of minus four index points. Business confidence increased by a much more modest five points to minus 10 index points, with confidence remaining in negative territory across all industries. Overall, the results tell the story of a strong rebound in the third quarter, but one that still has a long way to go before business returns to pre-pandemic levels. That’s a message that’s pretty similar to the one delivered by the AICD’s own Director Sentiment Index (DSI) that we reviewed last week.
Also from NAB, the Q3 SME Business Survey has been released. SME business conditions improved by a strong 16 points over the quarter while business confidence was also up quite sharply. But once again, that still leaves the absolute level of conditions and confidence looking weak.
A sample of Australian economists score October’s budget. ‘C’ followed by ‘B’ were the most popular grades.
A new ASPI report by David Uren claims that economic coercion is an increasingly common feature of the geopolitical and geo-economic landscape, suggesting that ‘the growing use of economic coercion by both China and the United States is an emerging risk for business and undermines the world trading system.’ It also recommends that the ‘potential for China to apply economic boycotts or other forms of coercion should be incorporated into the planning of any organisation aiming to sell into that market.’
Greg Earl looks at Japanese foreign investment and the Toll Group, and considers the implications for Australia’s foreign investment strategy.
Michele Bullock, RBA Assistant Governor (Financial System) gave a speech on financial stability in uncertain times, which provides a nice summary of the main themes covered in more detail in the recent Financial Stability Review.
Related, writing for ANZ Bluenotes, Andrew Cornell reviews the factors shaping the share of bad loans in banks’ portfolios. (And see also the BIS Bulletin piece linked below.)
Grattan worries that the government is trimming funding for the institutions that help deliver government accountability.
A report for the Ethics Centre by Deloitte Access Economics claims that ‘An increase in ethical behaviour could raise Australians’ average income by $1,800 a year, lifting GDP by $45 billion. An increase in a company’s performance based on ethical perceptions can increase return on assets by about 7 per cent.’ The channels for this economic gain include: improvements in mental health, a positive correlation between a measure (perceptions of) business ethics and return on assets, improved productivity leading to improved wages, and higher ethical standards leading to higher levels of trust and therefore lower costs associated with regulation and compliance.
The US Tax Foundation have released their 2020 International Tax Competitiveness Index. The index ranks the competitiveness of the tax systems of 36 OECD members, with Estonia in first spot and Italy at #36. Australia is ranked ninth overall, with high rankings for property and consumption taxes, a mid-range ranking 17 for personal taxes and a lowly ranking of 30 for corporate taxes.
In the FT, Tim Harford argues that we ‘should all spend more time thinking about the prospect of failure and what we might do about it.’ Potential gains from doing so include an improvement in contingency planning, enhanced scope for rapid learning, and just making it less likely that we adopt projects that look doomed to fail.
This Brookings Institution report analyses China’s role in the global middle class. More than 20 per cent of the world’s middle class now live in China, and with the country experiencing the fastest expansion of the middle class the world has ever seen, the report’s authors estimate that by 2027, 1.2 billion Chinese will be in the middle class, making up one quarter of the world total.
A WSJ essay on how textiles have changed the world.
The BIS Bulletin examines the relationship between bankruptcies, unemployment and the reallocation of resources triggered by the pandemic.
Eric Lonergan and Mark Blyth make the case for a strategy of radical conditionality using the example of their proposal for citizen wealth funds.
This Bloomberg piece digs into the relationship between the US stock market, the rising importance of intangibles and the squeeze on US workers. Sticking with the US stock market, here is Morningstar on how
COVID-19 is changing both consumer behaviour and company valuations.
Another one from Bloomberg. John Authers explores some of the implications of the US election for financial markets. He notes that many global macro investors have – at least until recently – been betting on the idea of a so-called Blue Wave (the Democrats take both the Presidency and the Senate) they have seen as a ‘reflation trade’ – bringing the return of both growth and inflation. But Authers cautions that markets could be underestimating both the chances of major uncertainty around the outcome and of a Trump win. He also draws on some interesting research that contrasts what would constitute a ‘Democrat’ portfolio, one weighted towards infrastructure, renewable energy, managed healthcare and cannabis stocks, companies that would benefit from a change in trade policy and gun stocks (as sales could rise with a Democrat win) with a ‘Republican’ portfolio that would include energy, defence, financial stocks, for-profit prison and education groups, plus other equities that would benefit from Republican healthcare policies, and from deregulation and lower taxes.
Living up to his ‘Dr Doom’ nickname, Nouriel Roubini on the potential for US electoral chaos.
The Economist assesses the Great Barrington plan.
Related, the BMJ on Covid-19’s known unknowns.
Paul Krugman’s thoughts on US trade policy under President Trump, which he argues appears to have failed in its objectives of reducing the overall and manufacturing trade deficits and reversing the decline in manufacturing employment, mainly because of a design failure in the tariffs used: they were levied on intermediate goods (that is, inputs into downstream production) rather than on final products, which ended up acting as negative effective protection for downstream industries.
How US economic policy post-COVID could influence global economic stability.
Martin Ravallion presents a (very) short history of the idea of ending poverty.
Last week included a link to HSBC’s Stephen King writing on MMT. He followed that piece up with a column in the FT. Subsequently, and as noted by FT Alphaville, his intervention has triggered some pushback.
Finally, two podcast episodes. The first is from Intelligence Squared: John Micklethwait and Adrian Wooldridge are interviewed about their new book The Wake Up Call: Why the Pandemic Has Exposed the Weakness of the West – and How to Fix it. (Note that at the time of writing the IQ2 website hadn’t updated their podcast list to include this latest one, but it’s already on apple and other providers, so should be on its way). Second, an Ezra Klein interview with 538’s Nate Silver which provides a deep dive into polling, probabilities, uncertainty and what’s different between the 2016 and 2020 US presidential elections.
Latest news
Already a member?
Login to view this content


