As the data calendar winds down for 2021, this week brought the final RBA meeting of the year, several updates on the state of the labour market and yet more numbers on the pace of Australian house price appreciation.
There were no big surprises from the December monetary policy meeting, with the RBA leaving the main settings of monetary policy in place: the cash rate ends the year still anchored at its record low of 0.1 per cent and the central bank has pledged to continue with its $4 billion per week program of asset purchases until at least mid-February next year. Still, there were several points worth noting. First, the RBA’s current forecast / educated guess is that the Omicron variant will not derail Australia’s recovery. Second, Martin Place reminded us of the criteria which it will use to judge the future of its asset purchase program next year. And third, the remaining elements of calendar-based forward guidance were junked as the governor’s statement excised any mention of a likely date for the first change in the cash rate.
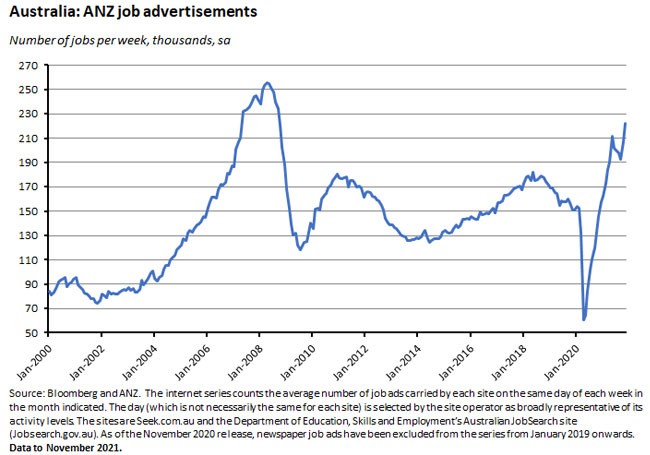
Turning to the labour market, the latest payroll jobs data showed the pace of the post-lockdown jobs recovery slowing, with payroll jobs up just 0.2 per cent over the fortnight to 13 November, although they were still up 1.7 per cent over the full month. More optimistically, ANZ job ads jumped 7.4 per cent over the month in November to be a record 44.2 per cent above pre-pandemic levels, suggesting that there remains ample scope for further labour market gains in the absence of any new downside shocks. Meanwhile, the September quarter labour account numbers provided a reminder of the ability of the pandemic – in this case in the form of the Delta variant and the subsequent public health measures – to have a significant adverse impact on employment outcomes: the economy lost more than 405,000 total jobs and about 378,000 filled jobs over the third quarter, taking the total number of filled jobs back down to below pre-pandemic levels. There’s a lot more on the labour account numbers in our updated labour market chart pack.
ABS data on residential house prices in the September quarter reported the fastest annual rate of growth of property prices in the history of the current series. The September quarter 2021 also marks the first time that the value of the Australian housing stock has exceeded $9 trillion. An updated housing market chart pack is also now available.
This week’s linkage includes new ABS data on Australia’s declining fertility rate, the latest RBA bulletin, Productivity Commission research on the growing magnitude of wealth transfers in Australia, updated APRA statistics on banks’ property exposures, the latest IMF assessment of the Australian economy, the OECD on missing entrepreneurs, the global supply chain mess, yet more on the US inflation debate, what’s happening with global labour markets, the World Inequality Report 2022, and a conversation on market risk.
Listen and subscribe to our podcast: Apple Podcasts | Google Podcasts | Spotify
What I’ve been following in Australia . . .
What happened:
At its monetary policy meeting on 7 December 2021, the RBA Board said that it would leave the cash rate target unchanged at 10bp and continue to purchase government securities at a rate of $4 billion a week until at least mid-February. The accompanying statement noted that the Australian economy continued to recover from the Delta-driven setback to activity, with a strong rebound in household consumption, and improving business confidence. It also pointed to positive leading indicators from the Australian labour market including high levels of job ads (see below) and some pick up in wage growth, albeit only to the relatively low rates prevailing pre-pandemic.
Governor Lowe said that the ‘emergence of the Omicron strain is a new source of uncertainty, but it is not expected to derail the recovery.’
The statement also reminded readers that the February meeting next year will see the RBA Board ‘consider the bond purchase program’, noting that by the middle of that month, the RBA will hold a total of $350 billion of bonds issued by the Australian government and the states and territories.
In term of the future trajectory for the cash rate, the statement said:
‘The Board will not increase the cash rate until actual inflation is sustainably within the two to three per cent target range. This will require the labour market to be tight enough to generate wages growth that is materially higher than it is currently. This is likely to take some time and the Board is prepared to be patient.’
The RBA also once again emphasised that although inflation has picked up in Australia, ‘it remains low in underlying terms’ and that inflationary pressures in Australia are lower than in other economies, partly reflecting still-modest wage growth.
Why it matters:
In the last monetary policy meeting of the year, the RBA left the key settings of policy unchanged: the cash rate remains pegged at near-zero and the central bank’s program of asset purchases will continue until at least February 2022. It also saw the RBA sticking with its pledge not to move on the cash rate until inflation is ‘sustainably’ back in the target band, and with its assessment that this will require ‘materially higher’ wage growth which will ‘take some time.’ All of which was as expected and therefore generated little excitement.
That said, there were three points of interest to take from the December statement.
- First, we learned that the RBA’s initial take on the impact of the new Omicron variant is that it will not derail the recovery, with the economy still ‘expected to return to its pre-Delta path in the first half of 2022.’
- Second, there was a reminder that when Martin Place considers the future of the asset purchase program next February, the three criteria under consideration will be (1) the actions of other central banks; (2) the functioning of the Australian bond market; and (3) progress towards the goals of full employment and inflation consistent with the inflation target.If the RBA’s forecasts stay on track, and in particular if Omicron doesn’t prove too disruptive, there’s a good chance that the RBA will decide to end the program, or at minimum will further scale back (‘taper’) the value of purchases.
- Third, the RBA scrapped any mention of a date for the likely first increase in the cash rate. As recently as the 5 October 2021 monetary policy meeting, the RBA statement had included the guidance that:
‘The Board…will not increase the cash rate until actual inflation is sustainably within the two to three per cent target range. The central scenario for the economy is that this condition will not be met before 2024.’
A variant of that guidance had appeared in every previous statement this year, albeit with the statements earlier in the year up until July being even more dovish, by including the phrase ‘until 2024 at the earliest’ (emphasis added). Last month, we noted that November’s meeting had removed the long-standing qualification that the conditions for an increase in the cash rate were unlikely to be met before 2024, citing only the RBA’s inflation forecasts for end 2023, and in separate comments Governor Lowe had conceded that ‘it is now…plausible that a lift in the cash rate could be appropriate in 2023.’ Now, December’s statement has now seen any mention of a date scrapped altogether.
That third point is interesting for a couple of reasons. First, it points to the increased uncertainty around the likely timing of a change in the cash rate, and in particular whether it is likely to come earlier than the central bank has been indicating. That’s a debate that we’ve covered in extensive detail in the weekly note and on the Dismal Science podcast over recent months. Second, and related, it also points to an ongoing shift in emphasis in the central bank’s forward guidance.
‘Forward guidance’ is how a central bank provides information about its future monetary policy intentions. Typically, forward guidance is classified as falling into one of three categories: open-ended forward guidance, which provides a purely qualitative statement about the future path for the policy rate (e.g. the cash rate is likely to remain low for an extended period of time); data-based or state-based forward guidance, which sets out a policy path conditional on economic outcomes (e.g. the cash rate will remain at its current level for as long as required to return inflation to its target range); and calendar-based forward guidance (e.g. the cash rate will remain at its current level until the second half of next year). On the surface, the RBA’s messaging for much of this year has appeared to combine both data-based and calendar-based forward guidance, with the former captured by the guidance that an increase in the cash rate would not come until actual inflation was sustainably within the target range and the latter by the comment that this condition was unlikely to be met before 2024.
The RBA, however, has been increasingly uncomfortable with this perception. We noted following the 6 July 2021 monetary policy meeting and Governor Lowe’s speech on the same day that the Governor had stressed:
‘the condition for an increase in the cash rate depends upon the data, not the date; it is based on inflation outcomes, not the calendar.’
That is, the RBA was then stressing that data- (or state-) based forward guidance was the thing to focus on, giving the RBA space to act before 2024 should the data warrant it. December’s statement takes this logic one step further by abolishing the mention of 2024, or even 2023, altogether, and placing all the emphasis on the outcomes (inflation, wages) seen in the data.
What happened:
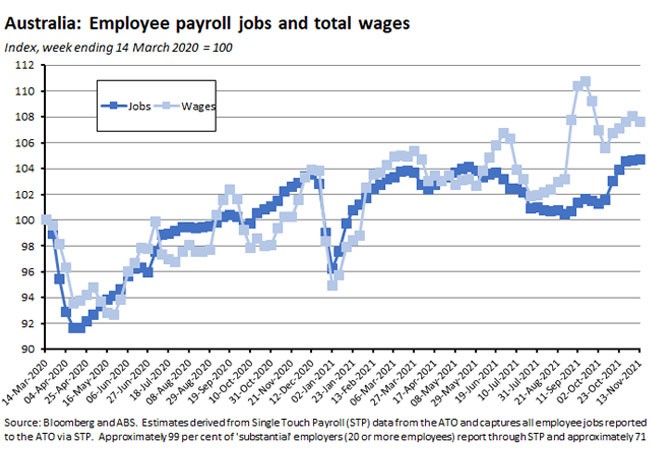
According to the ABS, the number of payroll jobs rose by 0.2 per cent over the fortnight to 13 November 2021 after having risen 1.5 per cent over the previous fortnight. Jobs are up 1.7 per cent over the past month and 2.4 per cent over the past year. Total wages paid were unchanged over the latest two weeks of data but were up 0.8 per cent over the month and up 7.3 per cent in annual terms.
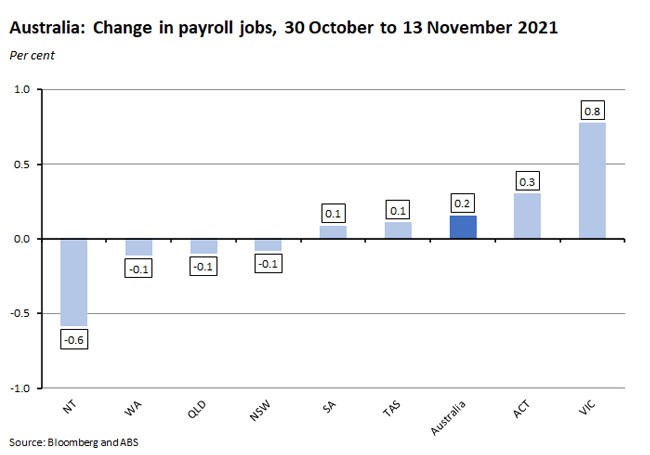
By state and territory, the change in job numbers over the two weeks to 13 November ranged from a fall of 0.6 per cent in the Northern Territory to a gain of 0.8 per cent in Victoria.
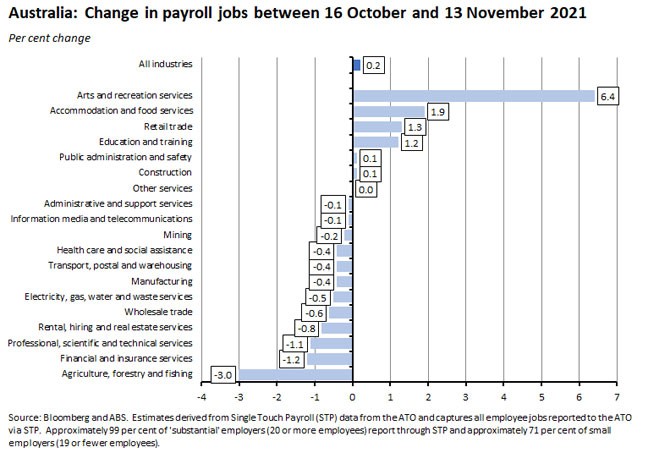
By industry, over the past fortnight there was a large increase in jobs numbers in arts and recreation services (up 6.4 per cent) and more modest gains for accommodation and food services (up 1.9 per cent), retail trade (up 1.3 per cent) and education and training (up 1.2 per cent).
For more payroll jobs data and charts, please see the updated Labour market chart pack.
Why it matters:
The latest payroll jobs numbers depict a slowdown in the pace of job recovery: after strong weekly growth during the last three weeks of October, the most recent fortnight of data has been much more subdued. In the case of Victoria, for example, the weekly rate of payroll job gains has now slowed to around 0.4 per cent from a high of 1.8 per cent in late October, while in the case of New South Wales, job numbers were actually down 0.1 per cent over the most recent week, compared to a high of a weekly gain of more than two per cent in mid-October.
The ABS also highlighted the key role played by the arts and recreation services and accommodation and food services industries. These two industries have suffered the largest falls in job numbers during the pandemic in general and particularly during lockdowns, and the recovery in jobs post-lockdown in these two industries has also driven the overall rise in job numbers over recent months.
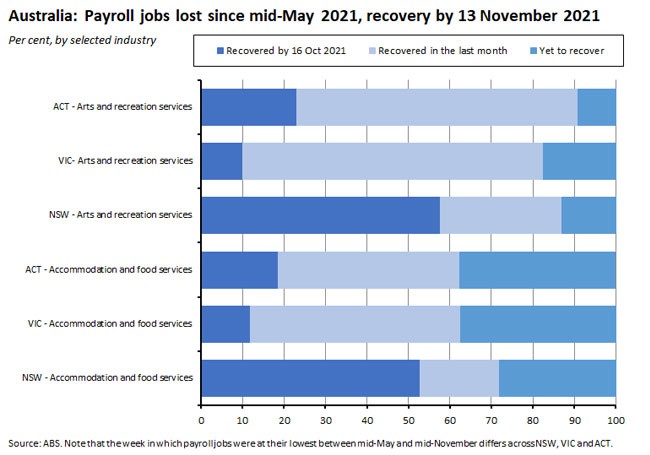
The Bureau notes that despite this recovery, jobs in both industries are yet to return to their mid-May levels in New South Wales, Victoria and the ACT.
What happened:
ANZ Australian Job Ads jumped 7.4 per cent month-on-month in November 2021 to 222,093.
Why it matters:
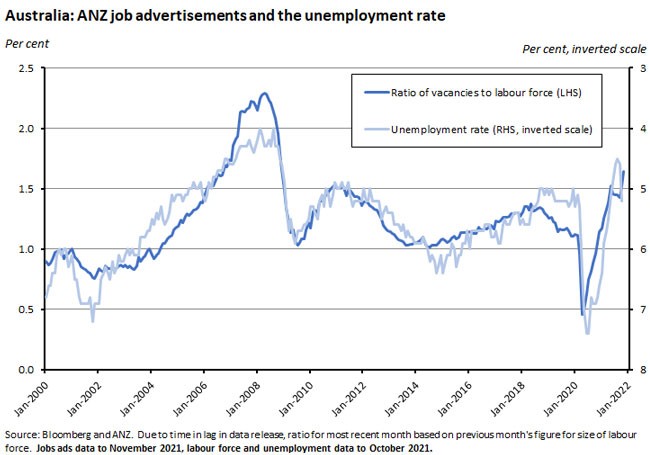
Job ads are now a record 44.2 per cent above pre-pandemic levels, suggesting that a strong labour market recovery is likely, absent any further adverse shocks, with current levels of job ads consistent with an unemployment rate heading back below five per cent.
What happened:
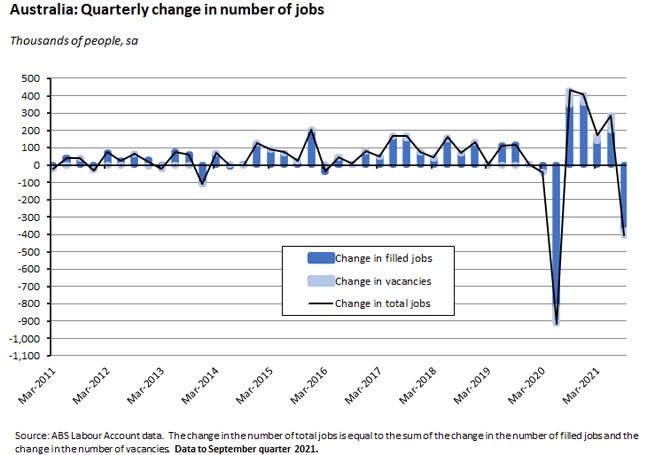
The ABS said that the Australian Labour Account showed total jobs fell by 405,500 (2.7 per cent) in the September quarter 2021, seasonally adjusted, but were still up 3.3 per cent over the year. Filled jobs fell 377,900 (2.6 per cent) over the quarter but rose 2.4 per cent over the year while the number of job vacancies fell by 27,600 (7.4 per cent) over the quarter but jumped 62.4 per cent in annual terms.
The Labour Account data also showed that the number of multiple job holders fell 7.8 per cent, reflecting a fall in secondary jobs of 7.5 per cent. Hours worked fell 4.7 per cent and the number of employed people fell 2.3 per cent.
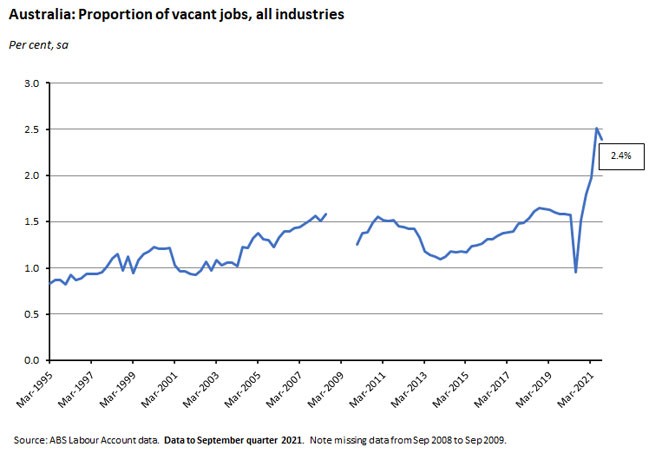
The share of vacant jobs edged down to 2.4 per cent in the September quarter this year from a (revised) record high of 2.5 per cent in the June quarter, but remains elevated by past standards.
For more detail on the labour account release, please see our updated Labour Market Chart Pack.
Why it matters:
The Labour Account provides an alternative perspective on the labour market from the monthly Labour Force Survey (LFS) releases on employment and unemployment. In particular, the ABS says that it considers the Labour Account to be the best source of headline information on employment by industry. The Labour Account also includes a broader definition of those employed in Australia than the LFS, as unlike the latter it also includes (1) non-residents, (2) ADF personnel and (3) employed people under the age of 15.
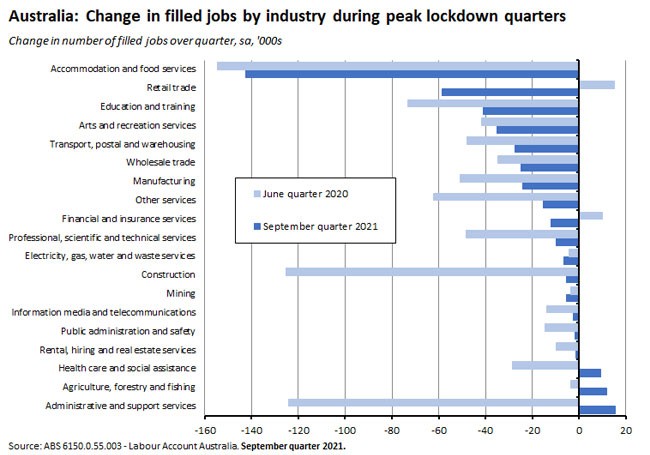
The September quarter Labour Account numbers capture the impact of the Delta variant and the associated public health restrictions. This showed up in the fall of more than 405,000 in total jobs and of about 378,000 in filled jobs, which left the total number of filled jobs back below pre-pandemic levels. The consequences of state lockdowns were also visible in the pattern of job losses, with 16 of 19 industries suffering a fall in filled job numbers over the quarter and with particularly big declines in percentage terms in filled jobs in accommodation and food services and arts and recreation services.
Interestingly, there was some shift in the pattern of absolute job losses in the September quarter of this year compared to that seen in the June quarter of last year during the initial round of lockdowns. So, for example, while both quarters saw a large decline in accommodation and food services, job numbers rose in retail trade in the June 2020 quarter but fell in the September 2021 quarter. And while construction jobs and administrative and support services jobs both slumped in the June 2020 quarter, the former suffered only a small decline in the September 2021 quarter while the latter increased.
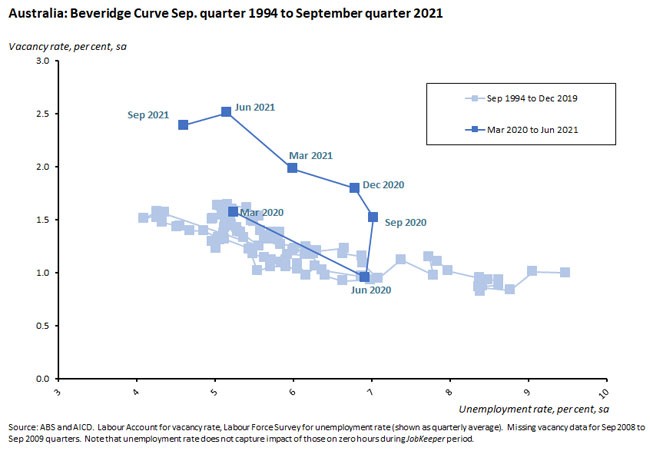
Although the vacancy rate fell slightly in the latest quarterly numbers, it remains very high by historical standard as the relationship between job vacancies and the unemployment rate continues to be distorted by the impact of the pandemic, as reflected in the shift in the so-called Beveridge Curve we’ve discussed in previous weekly notes.
Finally, the September 2021 labour account data also included a series of significant revisions. One change was the introduction of a new model to estimate the number of short-term/temporary non-residents who are employed in Australia. The new method is based on newly derived stock estimates of short-term visitor arrivals who have a visa giving the right to work in Australia, of which a proportion are then estimated to be employed. The revised data now reflects that prior to the start of the pandemic there were generally between 100,000 and 150,000 employed short-term non-residents in Australia each quarter. Over the pandemic, this fell to around 5,000 as a result of border restrictions. Another key revision is that the ABS cut the estimate of child workers (those aged under 15) employed by around 60,000 in the June quarter of last year.
What happened:
ANZ-Roy Morgan Consumer Confidence rose 1.4 per cent over the week to 5 December. Confidence rose in New South Wales, Queensland and Western Australia but fell in in Victoria and South Australia.
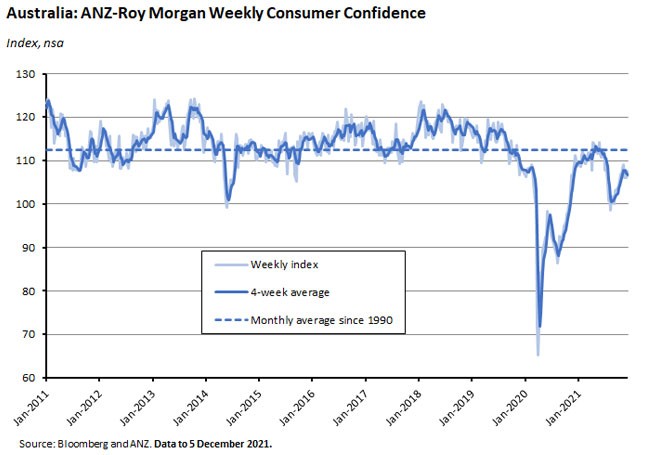
Four of the five confidence subindices rose over the week, with increases for current and future financial conditions and current and future economic conditions. Only ‘time to buy a major household item’ fell.
Weekly inflation expectations edged up to 4.9 per cent.
Why it matters:
After slipping backwards the previous week (a fall of 1.3 per cent), confidence has recovered, suggesting that – for now at least – consumers are taking news of the Omicron variant in their stride. That’s consistent with the RBA’s view noted above, that it doesn’t expect the variant to derail Australia’s economic recovery.
Inflation expectations are still a little below their 14 November 2021 and 24 October 2021 readings of five per cent. Prior to those two results, the last time weekly inflation expectations started with a ‘five’ was in December 2014.
What happened:
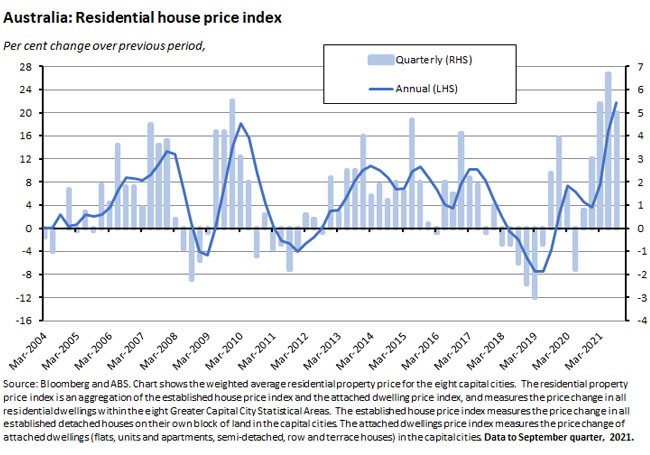
The ABS said that the weighted average of its eight capital cities Residential Property Price Index rose five per cent over the September quarter 2021 to be up 21.7 per cent over the year.
The total value of residential dwellings in Australia rose $487 billion to $9,259.2 billion in the second quarter.
The ABS noted that all of Australia’s capital cities recorded rises in residential property prices over the quarter and the year, with annual growth rates in each case either setting new records or reaching levels not seen in many years: in particular, Hobart, Sydney and Canberra recorded their largest rises in the history of the series.
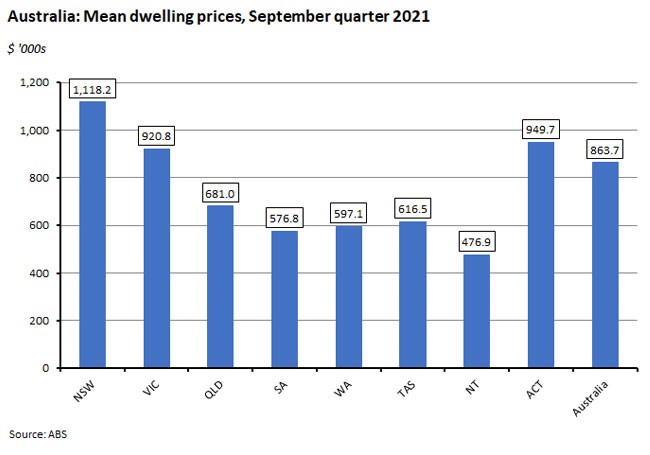
The mean price of residential dwellings across Australia rose by $42,000 to $863,700, with the mean price by state and territory ranging from a high of $1,118.2 thousand in New South Wales to a low of $476.9 thousand in the Northern Territory.
For more detail, see the updated Housing Market Chart Pack.
Why it matters:
While there was a moderation in the quarterly rate of price increase following last quarter’s series record, the annual rate of growth of property prices in the September quarter was the fastest in the history of the current residential price series, which starts in the September quarter of 2003.
The September quarter 2021 result also marks the first time that the value of the Australian housing stock has exceeded $9 trillion. In an indication of the pace of the current housing market upturn, that value rose by nearly $1 trillion over the past sixth months, with the ABS pointing out that the previous increase of around $1 trillion took 15 months, between the December quarter of 2019 and the March quarter of 2021.
The impact of lockdowns in New South Wales, Victoria and the ACT in Q3:2021 was visible in a decline in the number of residential property transactions across Sydney, Melbourne and Canberra, with Melbourne the most affected.
. . . and what I’ve been following in the global economy
What happened:
The J P Morgan Global Composite PMI (pdf) edged up to 54.8 in November from 54.5 in October.
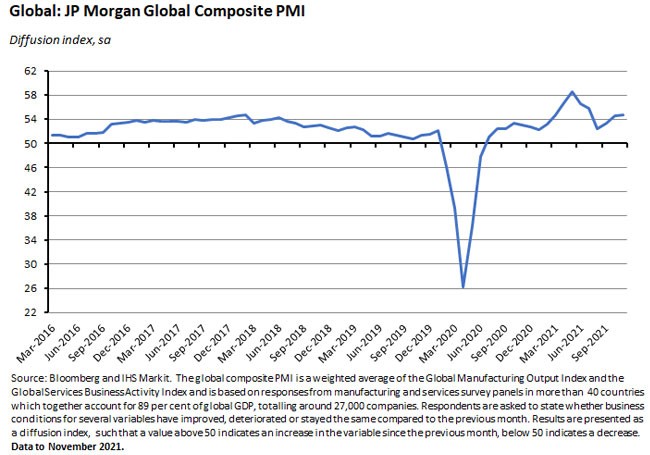
All six of the subsectors covered by the Composite PMI reported rising economic activity over the month, with financial services and business services performing particularly well. According to IHS Markit, growth in November was underpinned by rising intakes of new business, stronger inflows of new export business and continued job creation. At the same time, growth in input costs and output charges remained elevated and close to recent highs.
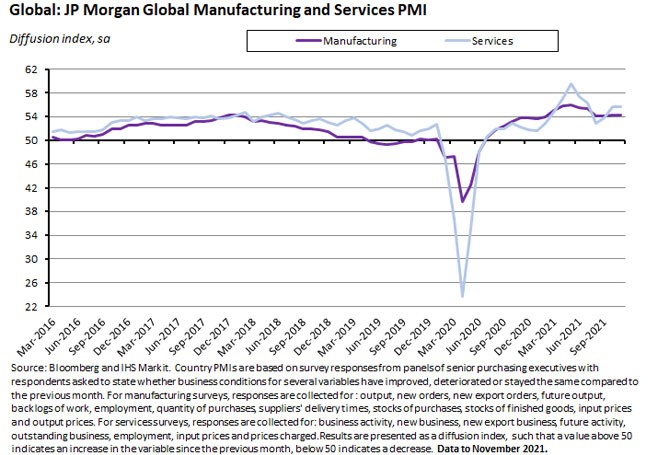
The Global Services Business Activity Index was unchanged in November at 55.6 while the Global Manufacturing PMI slipped slightly, edging down from 54.3 in October to 54.2 in November but remaining comfortably in positive territory.
Why it matters:
The global Composite index hit a four-month high in November and has now been in positive territory for 17 consecutive months with business activity continuing to expand in both services and manufacturing. That’s consistent with a global economy in decent shape before the arrival of the Omicron variant, although supplier delays, increased backlogs of work and high input costs all continued to signal the presence of important constraints on the supply side last month.
Linkage . . .
- New ABS data on births and fertility rates in Australia report that there were 294,369 registered births in 2020, a fall of 3.7 per cent from 2019. The total fertility rate (TFR) for Australian women has fallen from 1.95 in 2010 to 1.58 in 2020, with the latter a record low. The TFR has been below the replacement rate since 1976. The ABS also notes that the fall in the TFR has been largest for women aged 15 to 19, followed by those aged 20 to 24. In contrast, TFRs for older mothers has been rising, which the ABS says reflects a shift towards later childbearing.
- Also from the ABS, a report on a feasibility study for an Australian Defence Industry Account. The report also includes estimates of gross value added (GVA – the value of output less the value of intermediate consumption) and employment from Defence expenditure. The estimated GVA from Defence spending has risen from $6.4 billion in 2015-16 to $9.7 billion in 2019-20 while estimated employment has increased from 57,000 to 80,000 over the same period.
- The December 2021 RBA Bulletin is online. It includes articles on which firms drive (non-mining) business investment (the top one per cent of Australian firms account for around half of all non-mining investment, and for about 80 per cent in the variation in that investment) why investment hurdle rates are so sticky, and a look at recent changes to the RBA’s liquidity operations.
- Also from the RBA: Governor Philip Lowe gave a speech on the future of the payments system and the December 2021 chart pack is now available.
- A new Productivity Commission (PC) Research Report looks at wealth transfers and their economic effects. According to the PC, wealth transfers in Australia are large and growing with more than $120 billion passed on in 2018. Their real value has more than doubled since 2002. Inheritances, which account for around 90 per cent of all transfers, have grown in line with the wealth of older Australians, including housing wealth. The PC also projects wealth transfers to rise in the future, increasing fourfold between 2020 and 2050.
- Recently released APRA bank lending and property exposure statistics (pdf) show that new residential mortgage loans funded totalled $167.8 billion in the September 2021 quarter, an increase of 7.7 per cent over the quarter and 48.2 per cent over the year. Growth in in new lending to investors (13.6 per cent over the quarter) exceeded growth in new lending to owner-occupiers (5.1 per cent) for the first time since the December 2019 quarter. New lending at high loan-to-valuation ratios (LVRs) fell for a third consecutive quarter but new lending at high debt-to-income ratios (DTIs) greater than six rose to 23.8 per cent.
- Adam Triggs argues that Australia’s policy approach to housing affordability needs to be more innovative.
- The latest IMF Article IV Staff Report for Australia says that Australia will grow 3.5 per cent this year and 4.1 per cent in 2022. It thinks that underlying inflation will only increase gradually and remain within the target range and says that RBA policy should remain ‘data-dependent in a highly uncertain environment.’ On the housing market, the report notes that ‘affordability has deteriorated, and financial risks are building’ and comments that ‘further macroprudential tightening may be warranted if housing debt continues to outpace income growth and the rise in housing prices leads to increased riskiness of mortgage lending.’ The IMF also argues for structural reforms to the housing sector, including more efficient planning, zoning and better infrastructure on the supply side and also canvasses the expansion of social housing and tax reforms to discourage leveraged housing investment. On structural reform more generally, the Fund warns that productivity-enhancing investments have declined, and measures of competition have deteriorated, and flags that energy and climate change policies remain challenging areas. There are familiar calls to lower the corporate income tax burden and rely more on the GST, to transition from stamp duty to a land tax, and to implement broad-based carbon pricing. An accompanying IMF Selected Issues paper looks at Australia’s productivity performance in more detail.
- The OECD’s Revenue Statistics 2021 reports that tax revenues across the OECD last year ranged from 17.9 per cent in Mexico to 45.3 per cent in France, with an OECD average of 33.1 per cent. Although data for Australia for 2020 are not available, the 2019 ratio was 27.7 per cent of GDP, comfortably below the average OECD ratio of 33.4 per cent that year. The country summary for Australia (pdf) ranks us 30th out of 38 OECD countries in terms of the tax to GDP ratio. It also highlights that Australia’s tax structure looks very different to the average OECD member, with a substantially higher reliance on income and company taxes, payroll taxes, and property taxes and a lower reliance on revenues from value added / goods and services tax.
- Also from the OECD, an estimate that there are 35 million ‘missing entrepreneurs’ across the OECD as a result of limitations in access to finance, skills and networks.
- The Economist’s Free Exchange column argues that the rise of ‘stablecoins’ is reviving a debate that ran during the ‘free banking’ era in the Nineteenth Century United States.
- Greg Ip in the WSJ says US inflation is the product of an unusual combination of strong demand and restricted supply that hasn’t been seen since (perhaps) the end of the Second World War.
- And yet another piece on the US inflation debate, this time from Jonathan Kirshner.
- Daron Acemoglu on the global supply chain mess.
- The 2021 Update to the DHL Global Connectedness Index. It argues that globalisation has proved relatively resilient through the pandemic.
- Some evidence using US data that financial incentives and other nudges don’t encourage the vaccine hesitant to get jabbed. But see also this piece based on Swedish data that finds while ‘nudges’ mightn’t work, monetary incentives do.
- The World Inequality Report 2022.
- Brad Delong on the Great US Labour Market Shakeup. Related, Bloomberg BusinessWeek on workers opting out. Meanwhile, the Economist says evidence for a Great Resignation is hard to come by.
- The Odd Lots podcast talks to Richard Bookstaber on financial market risk. I was struck by the argument that many ‘investors’ are now treating at least some asset purchases as akin to buying a lottery ticket.
Latest news
Already a member?
Login to view this content


