
Phil Ruthven examines the distribution of incomes, wealth and taxes across Australia’s households and comes up with some surprises.
Averages are always just that and they can disguise the often polarised distribution of all sorts of things important in an economy and society. And yet, both the averages and distributions tell us a lot when it comes to household incomes, how we spend them, our wealth and our taxes. Indeed, they can often surprise us.
Starting with average household income and spending, Figure 1 shows the picture in 2014. The first surprise is the average income, a staggering $145,400 across the nation’s 9.3 million households.
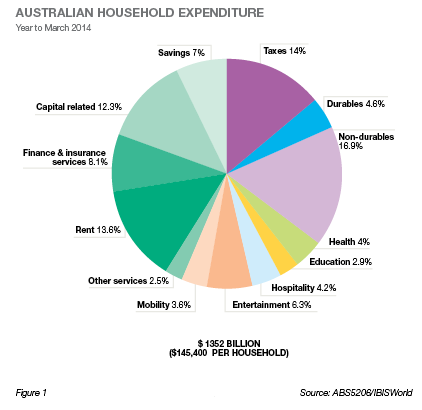
This income of around $1.4 trillion is made up of wages, mixed incomes (of unincorporated businesses), investment incomes, welfare payments, other incomes and the imputed rent value of home ownership. We return later to look at the polarised distribution of these incomes between the rich and poor.
Savings, including superannuation, is currently around seven per cent of income, having been negative through the middle of the last decade, well before the the global financial crisis which was a wake-up call to recalcitrant and spendthrift households. Taxes are a surprisingly modest one-seventh of gross incomes, as is rent (including actual and the imputed rent of home owners). Non-durables, being retail spending on goods consumed within the year, is the single biggest outlay at 17 per cent of total incomes. And yet, in 2014, we are spending more on outsourced household services and functions ($34,600 per household) than on retail spending. These outsourced services include meals, holidays, cleaning, child minding, entertainment, financial advice, health services, gardening, car maintenance and a myriad of other chores and functions.
The industrial age of DIY household functions and chores is now a distant memory for more and more households in the new age of service providers. And we have only surrendered one third of these DIY functions so far in favour of DIFM (do-it-for-me). At a price, of course.
Indeed, spending on all goods, including durables (cars, furniture, electricals etc), now accounts for barely more than a fifth of household incomes. Of course, the four-fifths spending on services includes taxes (returned to us as health, education and other services), capital related products (interest on housing and other loans) and financial services.
Figure 2 reveals the extraordinary change in the way we spend our incomes compared with the distant past. There have been many changes over the past 12 decades. They begin with the dramatic reduction in the proportion of spending on goods from 62 per cent of total incomes down to a third of that at 21 per cent due to lower and lower real prices through manufacturing productivity, more recently cheaper imports and near consumer saturation.
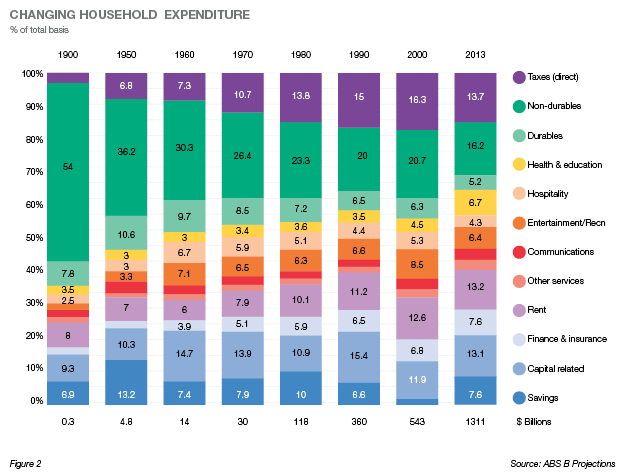
A second stand-out change has been the increase in direct taxes, from a modest two per cent of incomes in 1900 to 14 per cent today, not including indirect taxes (GST) embedded in the other items in Figure 2. As mentioned earlier, these taxes are returned in the form of services such as health, education, defence, policing, law and order, welfare and more. And in large measure, they help to benefit the lower income households.
Savings have been lumpy, sometimes negative as previously mentioned, and rarely at the desirable level of around 10-12 per cent of gross incomes that can ensure a dignified and comfortable retirement of around one-third of average household incomes per household. Nevertheless, the wealth, or net worth, of households has continued to climb. In the middle of this year total household wealth has passed $7.8 trillion or around $790,000 per household — on average — across the young and old, rich and poor cohorts.
For the first time in living memory, property — in the form of homes, investment housing and other property — dropped below half this average net worth in favour of superannuation and other financial products (shares, deposits etc) in 2014. This is a positive in terms of income generation.
All this begs the question: What is the distribution of incomes, wealth and taxes across the nation’s households?
Figure 3 adds to the reality check of household finances.
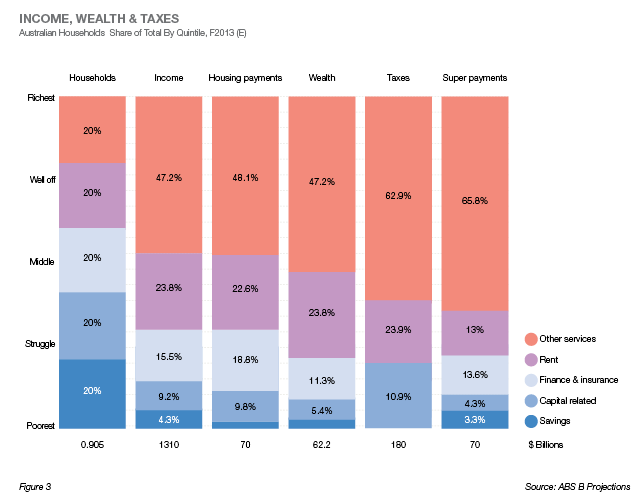
Yes, there is polarisation, but this polarisation is not quite as extreme as it might appear when incomes are equivalised by adding back government benefits to the lower income households.
It is, of course, always important to remember that a lot of the “poor” households are inhabited by students, inbound visa holders and religious workers, not just the unemployed and pensioner households.
Interestingly, the polarisation has increased only marginally over more than a decade, unlike other developed nations such as the US. Further, the polarisation is far less than most in the OECD and other developing economies for that matter.
Not to be forgotten is that while the richest and well off quintiles are dominant in incomes and wealth, they are taxed much more heavily, as Figure 3 highlights. If we are not egalitarian, then we are at least fairer than most economies, including those that claim to be egalitarian or socialist. And we can do better; but simply taxing more heavily to give to the poor is not necessarily the only or even best way to do that. Helping the poor to help themselves is a good start; daunting as that task usually is.
Latest news
Already a member?
Login to view this content