Phil Ruthven examines the three markets that affect Australia’s economy.
Half a century ago, advanced economies began a seismic shift from being producer-dominated to the market-oriented stance we take for granted today. Buyers are the kings and queens most of the time, although occasional shortages can mean temporary returns to a sellers’ market rather than a buyers’ market.
So these days, economies tend to be pulled by markets rather than pushed by production.
But what are the markets?
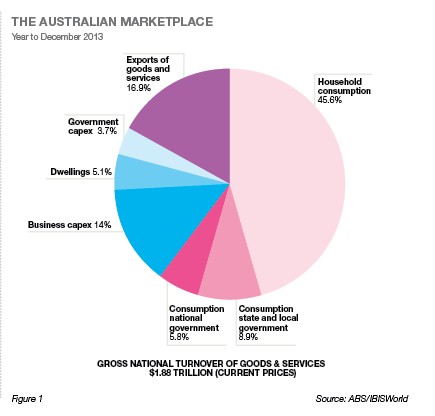
Figure 1 reveals there are basically three final markets – consumption markets, capital markets and export markets.

It should be pointed out, however, that the intermediate markets (including all the double and multiple accounting along the input-output chains in the economy) are huge, totalling over $2.5 trillion. But we are only looking at final or end markets in this analysis.
In 2013, consumption dominated, by accounting for 60 per cent of the overall market value of $1.9 trillion. Capital investment came in second at 23 per cent and exports third with 17 per cent.
Of course each market subdivides into many subsectors.
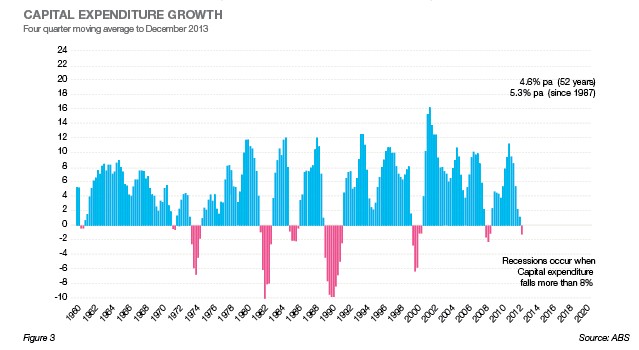
Historically, only one of these three markets can trigger a recession: capital expenditure.
It is the most volatile and can fall by such force that it becomes virtually impossible for consumption growth or export growth to offset the damage.
This is the reason why our new federal government is looking for “dig-ready” and other opportunities to offset the decline in mining investment that has single-handedly accounted for up to 25 per cent of all investment spending recently.
Only the massive investment in utilities (electricity, gas, water and telephony) matched this dominance way back in the 1960s.
The most reliable market, and the biggest, is consumption expenditure. That said, its growth over the past half century has slowed from an average 4.4 per cent a year in the first half of that period to 3 per cent per annum over the past 25 to 26 years and is now the slowest growing of the three markets. But it has never experienced negative growth in the lifetime of Australians born after World War II.

So, contrary to conventional wisdom, consumers do not go into reverse gear, stop spending with their cheque books or credit cards and cause recessions. It simply does not happen.
There are two subsectors in this market: households and government (federal and state).
Households represent three-quarters and government (mainly states) the other quarter, using our taxes to supply consumables such as health, education and other services. Interestingly, households spend most of their incomes on services too (including servicing mortgages and other loans with interest payments). The purchase of goods – be they durables or non-durable – only uses up a fifth of the average household income of $149,000 per household across the nine million households in 2013.
Thus, like all advanced economies, Australia’s economy is pulled along much more by services than goods nowadays, due in part to consumer near-saturation consumption on a per capita basis.
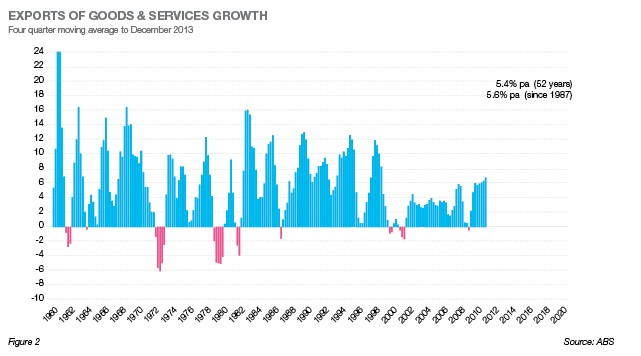
The fastest growing and second most stable market is exports. It was the smallest market in 2013 at 17 per cent of the total final market. Yes, it has its occasional negative growth dip, but it is neither often nor serious.
In the 21st century, minerals have come to dominate exports and in 2013, accounted for 49 per cent of all exports (57 per cent, if we include smelted metals).
Manufactures came in second, having not long ago been our major export. Tourism and other services were third and could overtake mineral exports by the end of the next decade. In last place were agricultural exports, at just 8 per cent, having dominated our export drive for almost two centuries.
The other major change in our export market is destinations. The UK and Western Europe had been our main destinations for most of our modern history, bolstered by North America in the post-World War II years.
However, in 2013, Asia absorbed over three quarters of our $319 billion receipts, led by China, a slowing Japan and rising other Asia Pacific nations.
The third market is the investment (capital expenditure) market. It is the most volatile of the three markets, the second biggest and yet the vital one that pulls the economy along with new and more productive capacity.
Its growth has averaged a very strong 5.3 per cent a year over the past quarter century, as shown in Figure 3.

However, as mentioned earlier, it is this market’s habit of sharp dives in investment that can trigger a recession.
These dives happen on a cycle of some eight and a half years (the long business cycle).
The most severe falls occurred in the 1983 and 1992 financial years with falls of 10 per cent, causing the only two recessions we have had over the past seven decades – although there were near-misses in the 1976 and 2001 financial years.
Heading down the tail end of 2014, into 2015 financial year, the Reserve Bank of Australia suggests some confidence in the economy.
Clearly, recovering consumption expenditure and strong exports are leading the way. All we need to do is make sure our capital expenditure does not fall by eight per cent or more to negate the other two healthy markets of the three – a serious challenge for both company directors and government ministers.
Latest news
Already a member?
Login to view this content


