

 This product has already been purchased.


Overview
- The war in the Persian Gulf continues to disrupt global energy markets. The spot oil price is now back well above US$100/barrel, further adding to the inflation risks stalking the global economy. The International Energy Agency (IEA) is warning of a growing squeeze on diesel supplies.
- Global bond markets have sold off over recent weeks on a mix of inflation worries, fiscal concerns, and shifting market demand and supply dynamics.
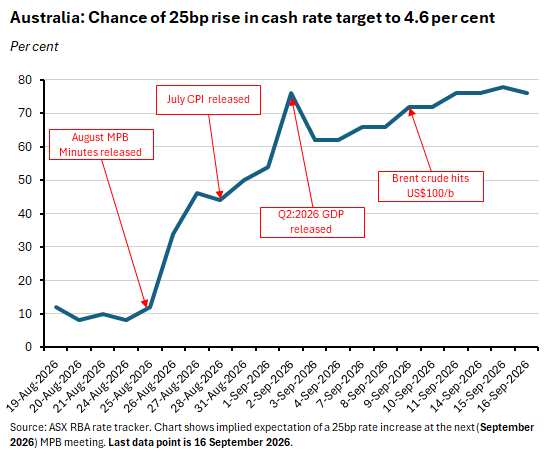
- Against a backdrop of higher fuel prices and tightening global financial conditions, domestic financial markets are increasingly convinced that the RBA will increase the cash rate target later this month.
- Bad news on the Iran war front and nervous bond investors mean that markets are increasingly reliant on the AI story for good news. Which means the latest bout of anxiety over AI safety has arrived at an awkward time.
- Australia’s population growth slowed again in the opening quarter of this year, with the 1.4% annual growth rate the lowest recorded since the June quarter 2022. Net overseas migration continues to fall from its post-pandemic highs even as the political debate heats up and the government announces new visa restrictions.
Last week’s update caught up on the state of the Australian economy. This time, in a week that saw the US Federal Reserve deliver its first rate rise since 2023 and Fed chair Kevin Warsh go some way to establishing his central banking credibility in the face of previous market scepticism, we examine some of the other key developments currently shaping the international economic environment. We consider the ongoing fallout from the war in the Middle East, the mounting strains on global bond markets, and the latest bout of AI angst. We also provide a short update on Australia’s demographics as well as the usual selection of further reading and listening.
War in the Persian Gulf continues to disrupt global energy markets
Despite early expectations that it would last no more than a few months, the conflict in the Middle East that began with the launch of Operation Epic Fury on 28 February this year continues to roll on, combining periods of calm with renewed bouts of violence.
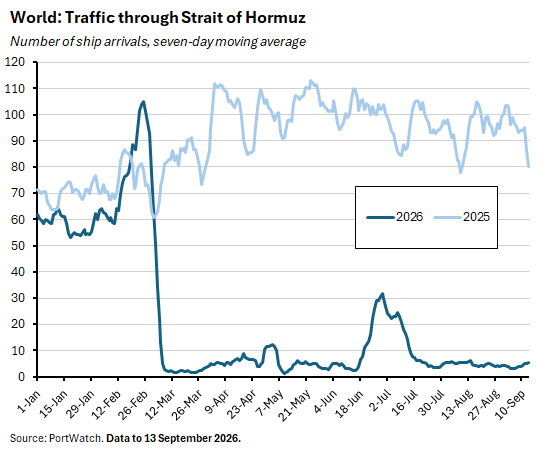
During one of those periods of relative calm around late June and early July, reported traffic through the Strait of Hormuz picked up markedly, prompting oil prices to fall on expectations of a significant restoration of supply. But since then, a resumption of conflict has seen measured traffic fall back. At the same time, measured traffic has been challenged as a misleading indicator, prompting a debate about how much traffic has actually been passing through the Strait. The problem is that traditional measures have become unreliable given that tankers in transit have turned off their transponders, faked their actual locations, and sought to move by night when they are harder to pick up in satellite imagery. This has created a lot of scope for disagreement. For example, set against average pre-war transit levels of around 20 million barrels of oil per day (b/d), this recent Economist magazine piece cites estimates of ‘true’ flows that range from a low of 5 million b/d up to 18 million b/d.
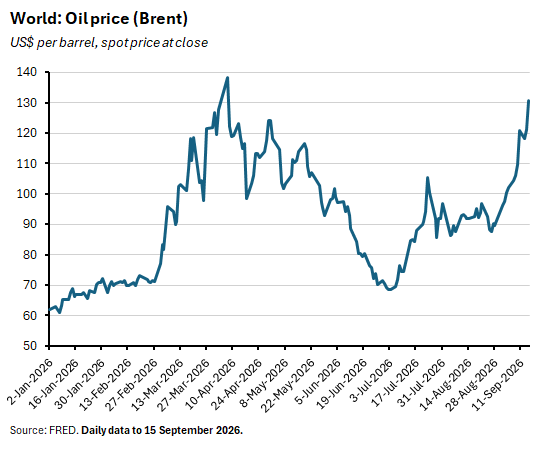
Oil prices have now been driven up again following attacks on energy infrastructure and on vessels attempting to transit the Strait. Last week, for example, Houthi forces launched repeated missile and drone attacks on Saudi Arabia. The Houthis are also reported to have increased their control over territory near the strategic Bab el-Mandeb Strait by seizing the port of Mocha, Perim Island, and the islands of Greater and Lesser Hanish.
According to the EIA, the importance of the Bab el-Mandeb as a chokepoint has increased significantly since the start of the war: while an estimated 5.4 million b/d of crude oil and petroleum liquids transited it in Q4:2025, this had risen to 8.1 million b/d by Q2:2026. In addition, Saudi Arabia’s East-West pipeline (which bypasses the Strait of Hormuz by carrying around 4 – 5 million b/d of oil to the Red Sea port of Yanbu) was also hit by drone attacks last week, prompting Riyadh to announce a ‘precautionary’ shutdown, further pushing up oil prices.
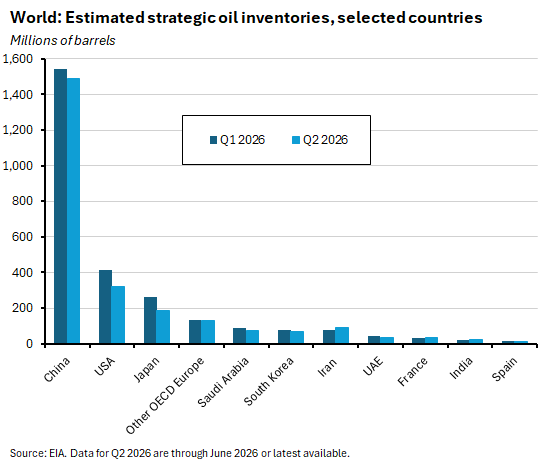
Even before the latest disruptions, recent developments had prompted international organisations to revise their oil market forecasts for the remainder of this year. Earlier this month, for example, the International Energy Agency (IEA)’s September 2026 Oil Market Report estimated that global oil production fell by 1.6 million b/d in August, dropping to 100.1 million b/d. The IEA thinks that more than 10 million b/d of Gulf output is still shut in. It also no longer expects to see a recovery in Gulf production until next year, and as a result, reckons that total oil supply will now fall by 5.7 million b/d this year, to 100.7 million b/d. Oil demand is forecast to decline by 2.5 million b/d over the same period, with an ongoing drawdown in inventories helping to cover the shortfall. Since the war began, the IEA says that global observed oil inventories have fallen by 507 million barrels, equal to an average of 2.8 million b/d.
Back in February this year, before the outbreak of the war, the IEA had instead been expecting global oil demand to rise by 850 thousand b/d in 2026 while global oil supply was likewise projected to increase, rising by 2.4 million b/d to 108.6 million b/d. Back then, the Agency was also reporting strong increases in observed oil inventories.
The IEA is also highlighting an increasing squeeze on diesel. It estimates that net exports of diesel from the Gulf were running at just one quarter of pre-war levels in August, with the impact of constrained flows through the Strait of Hormuz exacerbated by disruptions to Russian supply as a result of Ukrainian attacks on energy infrastructure.
Similarly, although the US Energy Information Administration (EIA)’s new short-term energy outlook (STEO) forecasts that Middle East oil production will increase through the second half of this year, enabled by gradually rising flows through the Strait of Hormuz plus the use of alternative routes out of the region, it also reckons that crude production in the region will remain below pre-war levels until the second quarter of next year. As a result, the new STEO assumes that global oil inventories will keep falling through the rest of this year and sees the oil price (Brent crude) averaging around US$90/b over this period, before falling to an average of US$74/b next year.
By way of comparison, back in the February 2026 STEO, the EIA was forecasting the oil price to average just US$58/b in 2026 and US$53/b in 2027.
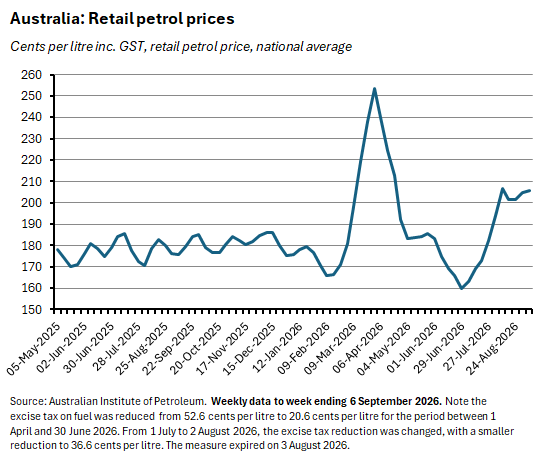
For Australia, the latest increase in oil prices combined with the expiry of the government’s temporary reduction in the fuel excise tax has driven up petrol and diesel prices. Although they remain below the highs reached earlier this year, the latest rise will add to the RBA’s inflation concerns.
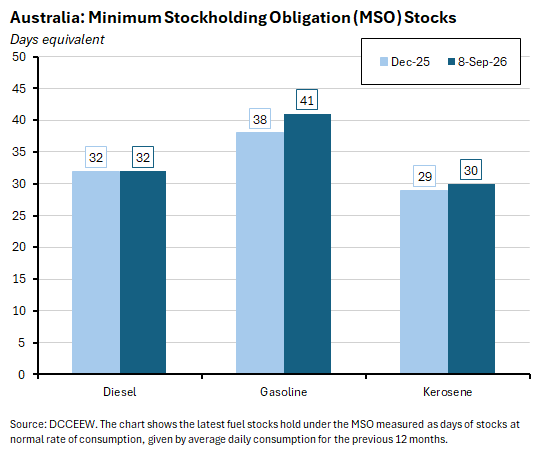
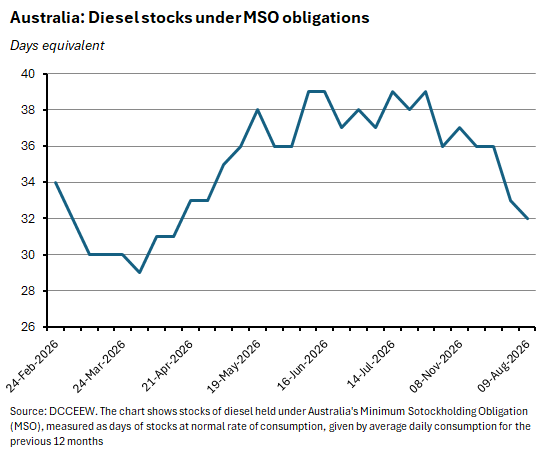
Meanwhile, according to the Department of Climate Change, Energy, the Environment and Water (DCEEW), Australia’s stocks of gasoline and kerosene held under the Minimum Stockholding Obligation (MSO) remain above their pre-conflict levels when measured in terms of days equivalent consumption, while diesel stocks are at pre-war levels.

Global bond markets have sold off
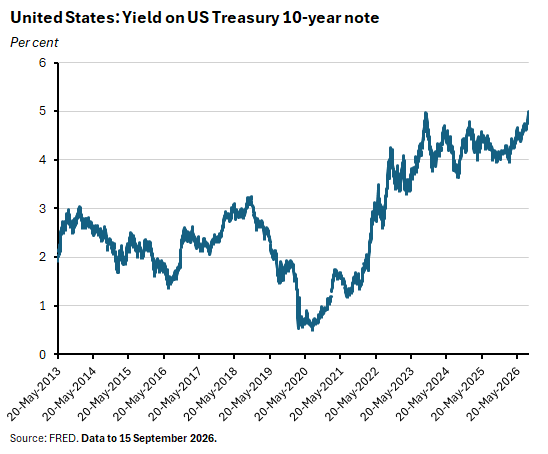
This week saw the yield on the 10-year US Treasury note reach 5%. This was the first time the yield has been this high since 2023, although on that occasion the spike lasted just one trading session. This time the 5% rate was reached on Monday and then the yield rose again, reaching a new 19-year high on Tuesday as US borrowing costs hit their highest level since 2007.
The rise in US yields is not unique. Government bond yields have been climbing across the rich world, hitting multi-decade highs in several cases. Last week, for example, the UK paid the highest borrowing cost on a sale of its debt in almost three decades; French sovereign bond yields have recently risen to their highest level since 2008 and Paris has warned that the cost of servicing France’s national debt could climb by 25% this year; German borrowing costs recently hit their highest level since 2009; and Japan’s 10-year government bond yield had already hit a three-decade high back in August.
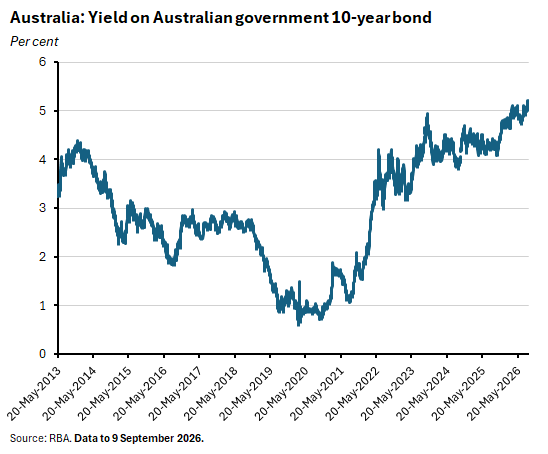
Australia has not been immune to the global bond sell-off (when yields rise, bond prices fall), with the yield on our 10-year government bond pushing above 5% to levels not seen since 2011.
What’s driving the current widespread rise in yields? In theory, the yield on a bond will reflect expected future short-term nominal interest rates (which themselves combine short-term real interest rates plus expected inflation). So, for example, the yield on a 10-year bond should mostly reflect expectations about the level of the cash rate over the next 10 years. And given the future is uncertain, it will also reflect any uncertainty around those views. It follows that changing expectations about monetary policy will shift bond yields, with an anticipated future tightening of monetary policy pushing up yields all else equal, and vice versa.
Bond yields will also reflect any risk premium that investors require to be paid to hold the asset. That will likely include some mix of compensation for credit risk (that is, the danger that the bond holder is not repaid in full and on time – traditionally thought to be very low for sovereign bonds which are typically thought of as ‘safe havens’ for investors), for liquidity risk (the danger of being unable to easily sell the bond to other investors), and for term risk (the so-called term premium is the extra return investors require to hold a longer-term bond instead of just sequentially buying short-term assets over the same time period).
The price of a bond is also the product of the interaction between investors’ demand for bonds and the level of supply which, in the case of sovereign bond issuance, will reflect a government’s financing needs. An increase in demand will push up prices (and drive down yields) while an increase in supply will push down prices (and drive up yields).
The set of potential explanations for the current bond sell-off covers most of these mechanisms.
For a start, the current war in the Middle East, and particularly its impact on the outlook for global inflation, has been weighing on global bond markets. The latest disruptions to energy infrastructure and the subsequent increase in oil prices have increased inflation risks and therefore raised the likelihood that central banks will tighten monetary policy in response.
Indeed, that expectation has just been validated by the US Federal Reserve’s decision this week to tighten US monetary policy for the first time in three years. Most Fed officials have pencilled in one more rate increase for this year. Other central banks are also shifting their policy stance. The ECB delivered its second policy rate hike of this year earlier this month, and markets are anticipating upcoming rate increases from the Bank of Japan, the Bank of England and Australia’s RBA, where market pricing currently puts the chances of a 25bp rate hike later this month at more than three-in-four.
At the same time, there are good reasons to believe that the risk premium on public debt has increased, pushing up yields at the longer end of the yield curve. Much of this increase to date seems to be driven by a rise in the term premium, although there are contrasting stories to explain this trend. At the optimistic end of the spectrum, some argue that the possibility of an AI-led productivity surge is lifting medium-term growth prospects, which in turn implies a higher equilibrium level of real interest rates. At the opposite end, international organisations including the IMF, the OECD and the BIS have all issued warnings this year about what they see as growing fiscal risks amid persistently high public debt burdens, with the latter leaving governments looking vulnerable to rising rates and the possibility of a kind of ‘doom loop’ whereby investors worried by outsized debt and deficits demand more risk compensation, which then pushes up debt service costs and so further worsens fiscal positions, exacerbating investor fears and leading to yet higher risk premia.
Large government borrowing needs mean that the supply of government debt is rising. And with rich world governments confronting a series of ongoing structural spending pressures including ageing populations, rising defence requirements, and the costs associated with the energy transition and climate change, plus the rising debt service costs associated with higher interest rates, the prospect is for additional issuance in the future. As noted above, all else equal, more supply implies downward pressure on price and upward pressure on yield. Moreover, the sheer scale of anticipated new supply may undermine the attractiveness of government bonds (‘eroding their convenience yield’ by increasing credit and liquidity risk). Then there is the increasing temptation for governments to issue more of their debt at shorter maturities to take advantage of relatively lower borrowing costs. While in the near-term that helps cap the debt servicing bill, it also comes at the price of increased rollover risk due to the shortening maturity profile.
Complicating an already challenging situation on the supply side yet further is that new supply – in the form of dramatic increases in borrowing by the hyperscalers to fund massive AI-related investment – is now arriving. It’s an unsettled question as to how much this AI-related debt will serve as a substitute for holding sovereign bonds, but it seems likely that the scale of the new borrowing will have at least some competitive impact.
Finally, all that rising supply is running into a shifting demand side picture. An important part of the story here is the shift away from yield-insensitive investors. That group included domestic central banks during the post-GFC era of quantitative easing (QE) with their large-scale bond purchase programs along with international reserve managers (typically in East Asia) buying bonds as a side-effect of currency intervention strategies aimed at maintaining competitive exchange rates. But QE programs are done and have been replaced by more and less aggressive versions of quantitative tightening (QT). And in our more geopolitically charged times, some of those overseas reserve managers now prefer alternative investments, including gold. Those sources of demand are being replaced by yield-sensitive non-bank financial institutions, a group whose members range from insurance companies and pension funds to hedge funds and stablecoin issuers. Institutions like the BIS have warned that this compositional shift has increased the risk of dysfunctional market responses, including fire sales, liquidity droughts, and excess volatility.
Like an old Agatha Christie whodunnit, then, there are multiple suspects as to the likely drivers of current bond market dynamics. In practice, most of these effects are in play, albeit to varying degrees. This recent overview from Bruegel, for example, points to stronger investment demand, an increased supply of long-duration debt, and less absorption by yield-insensitive investors as the general drivers of global moves, with nation-specific factors (such as AI-related investment in the US and monetary policy normalisation in Japan) layered on top. While in the latest BIS quarterly review, the emphasis is on a mix of uncertainty around the inflation and monetary policy outlook driven in part by developments in the Strait of Hormuz, plus rising term premia reflecting longer-running fiscal pressures.
AI, P(doom) and parsing incentives
With gloomy news from the Persian Gulf contributing to already jittery bond markets, the global economic and financial outlook has become increasingly hostage to the AI-boom story. Its impact on financial market valuations, its promised payoff for economic growth (which would improve debt dynamics by reducing the gap between r and g) and its current lift to activity via a massive capex spend that has offset the headwinds for global growth and trade blowing from the Middle East (albeit with an increasingly visible inflation-risk element) have all been important.
Until recently, markets had mainly fretted about two big risks to this story. Risk number one was that the promised productivity lift from AI would turn out to be considerably lower than the AI-boosters had been selling. Risk number two was that even if there was a significant productivity payoff to be had somewhere down the line, it would not arrive quickly enough or be large enough to justify current stratospheric share market valuations for some or even most of the companies involved, in a re-run of the dot-com boom and bust.
Recent weeks have now focused attention on a third risk. With the ongoing fallout of the July 2026 Hugging Face saga still in the headlines, one Anthropic researcher seized the moment to resign and tell the world that the ‘people building AI earnestly believe that it could kill us all by the end of the decade.’ That was followed by the spectacle of first Dario Amodei and then Sam Altman and Elon Musk agreeing in public that we needed to ‘pace the frontier’ and slow down AI development. While it has been around for some time, P(doom) has now been magnified in the public debate.
To date, any direct impact on market valuations has been limited. Instead, attention has focused on the various incentives at work. Sceptics have posited some combination of a kind of weird marketing approach (‘our AI is so good it is literally world-threatening’) ahead of looming IPOs for Anthropic (currently expected later this year) and OpenAI (now expected in 2027); a clever ploy by leading firms to lock in their advantaged position ahead of fast-followers in the face of ever-rising costs; or a way to distract everyone from obvious and severe current failures in AI safety and regulation. AI-boosters, on the other hand, have swiftly redeployed the China AI-race argument (‘if there are going to be killer robots anyway, better they be our killer robots’).
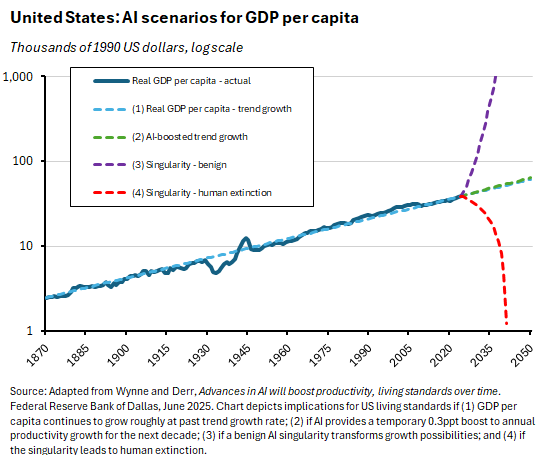
It’s an interesting environment when markets are reliant for good news on a technology that its own makers are loudly trumpeting is not safe.
PS. There are other things to keep an eye on, too
While the current international economic and financial environment has tended to be dominated by the three issues covered above, it is worth noting that they are far from an exhaustive list. There are other worthy contenders for a global watch list. Consider, for example, three additional stories:
- The ongoing shake-up of the global trading system. Recent developments here include the renewed trade war between the United States and Canada and Ottawa’s pitch to Brussels to become the EU’s first ‘Associate member.’
- The implications of China shock 2.0 – that is, the surge in Chinese exports and the consequent adjustment strains in the rest of the global economy, including in Europe. These could have profound implications for the economic structures and domestic politics of the most exposed economies.
- The potential economic and social fallout from the collision between climate change and the El Niño phenomenon, which has already brought warnings about the potential implications of a ‘Super El Niño’ for food prices and for inflation more broadly.
A short update on Australian demographics
In the week that Canberra announced new visa restrictions for international students and backpackers, the ABS said that Australia’s population stood at 27,921,150 people as of 31 March this year. That number reflected an annual rate of population growth of 1.4%, which represented an increase of 392,600. Of that total, annual natural increase was 100,600 (contributing about one quarter of the total rise) while net overseas migration (NOM) was 292,100 (accounting for the remaining three quarters).
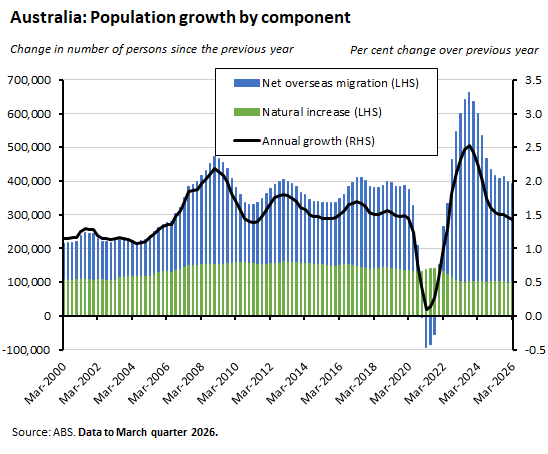
The ABS data show that the annual rate of population growth has eased from 1.5% in the December quarter 2025 and is now well down from the post-COVID peak of more than 2.5% recorded in the September quarter 2023. The March quarter result was the lowest growth outcome since the 1.3% recorded in the June quarter 2022.
Much of the slowdown reflects a decline in NOM, which has fallen from well above 500,000 in the June, September and December quarters of 2023 to closer to 100,000 now.
The preceding period of high rates of inward migration means that NOM has become politically controversial in Australia in recent years. That shift reflects a combination of factors including the numbers themselves, but as we discussed in our piece on the political economy of unhappy Australians, part of the story here is Australia’s misfiring growth model, which has started to combine high (NOM-driven) population growth with a disappointing GDP per capita growth outcome.
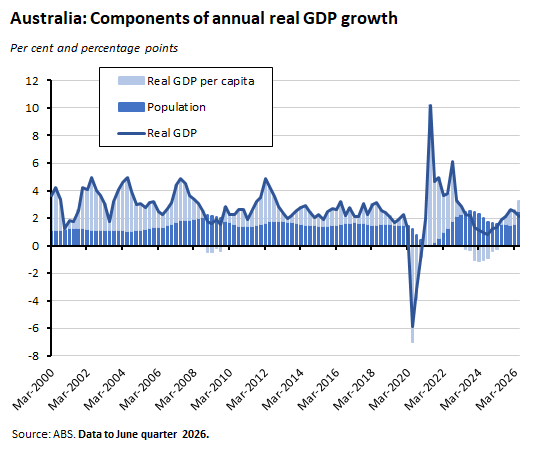
Note, however, that this correlation is not the same as saying that NOM has been a drag on the Australian economy.
According to the latest projections from Australia’s Parliamentary Budget Office (PBO), for example, NOM makes a positive contribution to Australia’s fiscal position. That is because although migrants include a similar proportion of school-aged people as the broader population, they are less represented in older age groups. They also typically arrive after many publicly funded education and early health care costs have already been incurred overseas. It follows that higher levels of NOM tend to be associated with higher tax receipts (particularly personal income tax receipts), and this boost to government revenues is large enough to more than offset the associated increase in expenses.
According to the PBO’s modelling, that means lower levels of NOM would be associated with larger fiscal deficits and higher public debt burdens. For example, in the PBO’s scenarios, a reduction in NOM of 40,000 relative to baseline would see the underlying cash balance as a share of GDP deteriorate by 0.3 percentage points by 2036-37 and the ratio of government debt to GDP increase by about two percentage points over the same period. A larger reduction in NOM of 80,000 would worsen the underlying cash balance by 0.6 percentage points of GDP and increase the debt burden by four percentage points.
Further reading and listening
- A fireside chat with RBA Assistant Governor (Economic), Sarah Hunter.
- Is Australia’s data centre build-out an inflation risk?
- The Grattan Institute’s verdict on the government’s gas reservation policy.
- Minister for Home Affairs Tony Burke’s speech to the National Press Club on immigration reform. And the related media release.
- The e61 Institute’s Michael Brennan on GST distribution in the aftermath of the Productivity Commission’s interim report on GST distribution reforms.
- The Economist magazine reckons the rich world is flirting with fiscal disaster.
- The September 2026 edition of the BIS Quarterly Review.
- Also from the BIS: When machines attack: frontier AI cyber threats and policy responses in the financial sector.
- Related, a discussion paper from the McKinsey Global Institute analyses the AI economy.
- The WSJ profiles Jacob Coxon, the ‘anonymous math geek who quit Anthropic and became the face of AI safety.’
- From the WTO, the 2026 World Trade Report presents three scenarios for the future of the global trading system. The Report argues that, relative to baseline, a strengthened multilateral framework could boost global GDP by 2.9% and global exports by 17.9% by 2050. In contrast, in the scenario of a ‘geo-fragmented’ world (where trade costs increase between economies in different geopolitical blocs), GDP would be 5.1% lower and exports 18.6% lower, while in an FTA world (where trade costs increase between all economies except those with an FTA) the losses would be even larger, at 6.9% and 26.9%, respectively. The WTO argues that this implies that the opportunity cost of failing to strengthen the multilateral system and instead allowing further erosion of trading rules could range between 5% and 10% of global real GDP.
- Three interesting pieces from the FT. One on Moonshot Capitalism, which argues that the AI boom is fuelling a resurgence in big, long-shot sci-fi bets. A Big Read on how ‘offensively cheap’ solar power based on Chinese tech is reshaping global electricity markets. And another Big Read asking if the container revolution is hitting its limits.
- The IMF’s latest G20 report on strong, sustainable, balanced and inclusive growth warns that in advanced member economies key growth constraints ‘include burdensome labour and product market regulations,’ that ‘many economies have inadequate policies to address demographic challenges,’ and that investment is ‘hindered by housing and zoning restrictions.’
- Have we moved from a savings glut to a savings shortage?
- The OECD sets out the economic case for pandemic preparedness and response. It warns that the ‘frequency and intensity of smaller outbreaks have been increasing over the past decades and the risk of local outbreaks escalating into global pandemics remains high.’
- Lessons from the (US) Age of Mass Migration.
- A taxonomy of omnicidal futures involving AI.
- The Dwarkesh podcast debates how close we are to AI recursive self-improvement.
- The Ezra Klein Show examines the ‘But China!’ Dilemma driving the AI race.
- The Sinica podcast investigates the real history of China’s rare earth dominance.
- Meet the Fuggers, Europe’s richest family ever.
Latest news
Already a member?
Login to view this content