Martin Place delivered an early – if widely expected – Christmas present this week when the RBA Board decided to leave the cash rate target unchanged at 4.35 per cent. The decision to hold fire reflects not just last week’s softer-than-expected October inflation reading but also the more general absence of any ‘inflationary shock’-style outcomes in the data since November’s 25bp rate hike. The Board will next meet on 6 February 2024 under the new post-Review framework. By then, the central bank will have had the opportunity to consider new data on inflation, the labour market and consumer spending.
It might also take into account the message delivered by the September quarter 2023 national accounts numbers which were published by the ABS the day after the RBA Board meeting. Economists had been anticipating a 0.5 per cent quarterly growth print, so the actual outcome of just 0.2 per cent was markedly weaker than expected. Typically, the dated nature of the GDP numbers means that they are seen as of limited relevance to the kind of forward-looking evaluations usually expected to guide monetary policy decisions. But in this case, the news that total household consumption is flat-lining (albeit subject to the caveat that the numbers were influenced by government policies that to some extent substituted public for private expenditure), that consumption per head is going backwards, that disposable income is suffering a ferocious three-way squeeze from interest rates, taxes, and higher prices and that Australia remains in a ‘per capita recession’ together confirm not just the wisdom of this month’s policy pause but also serve as a reminder that the RBA now needs to carefully consider downside risks to activity alongside its ongoing focus on upside risks to inflation.
More detail on this week’s RBA meeting and the GDP numbers as well as last week’s inflation reading below, along with a broader data roundup that covers a busy week and a bit in terms of economic releases.
RBA leaves cash rate target unchanged at 4.35 per cent
At its meeting on 5 December 2023, the RBA Board decided to leave the cash rate target unchanged at 4.35 per cent. That was in line both with market pricing (which had put the probability of a rate hike this week at just five per cent) and the expectations of most RBA watchers.
The accompanying statement explained that the decision to return to a pause after November’s 25bp rate hike reflected the central bank’s judgement that the ‘limited information received since the November meeting has been broadly in line with expectations.’ In particular:
- Last week’s monthly CPI reading for October ‘suggested that inflation is continuing to moderate, driven by the goods sector…[although]…the inflation update did not…provide much more information on services inflation.’ (For more on the October inflation numbers, see the discussion below).
- Inflation expectations ‘remain consistent with the inflation target.’
- Despite the acceleration in the annual rate of wage (WPI) increases in the September quarter 2023 to four per cent, ‘this was expected given that it captured the earlier Fair Work Commission decision on award wages.’ Moreover, the RBA thinks that ‘Wages growth is not expected to increase much further and remains consistent with the inflation target, provided productivity growth picks up.’
- And with the unemployment rate edging up to 3.7 per cent in October, the RBA’s take was that ‘Conditions in the labour market also continued to ease gradually, although they remain tight.’
Given the absence of any compelling data-driven case for a rate increase, plus the knowledge that 13 previous rate increases (and higher prices) are now squeezing household incomes in a quite significant way, it makes sense that the RBA has returned to the broad logic underpinning the four-month policy pause between July and August this year:
‘Holding the cash rate steady at this meeting will allow time to assess the impact of the increases in interest rates on demand, inflation and the labour market.’
What will drive that assessment? The next RBA Board meeting will be held on 5 – 6 February next year (and as outlined here, will be the first meeting under the new, post-Review format). The message from Martin Place this week is that any future decision on the cash rate will continue to be data- and risk-driven:
‘Whether further tightening of monetary policy is required to ensure that inflation returns to target in a reasonable timeframe will depend upon the data and the evolving assessment of risks. In making its decisions, the Board will continue to pay close attention to developments in the global economy, trends in domestic demand, and the outlook for inflation and the labour market.’
That means key domestic data points to watch between now and the February 2024 meeting will be new numbers on inflation (the monthly CPI indicator for November 2023 will be published on 10 January 2024 and the number for December 2023 will be out on 31 January 2024, while the December quarter 2023 CPI will also be released on that date), on employment and unemployment outcomes (the Labour force release for November 2023 is out on 14 December 2023 while the December 2023 figures will be published on 18 January 2024), and retail trade (November 2023 data out on 9 January 2024 and December 2023 data on 30 January 2024). The inflation numbers will be particularly important as they will provide more detailed readings on services inflation, which is currently the main source of concern for Martin Place.
Moreover, the message from the weaker-than-expected Q3:2023 GDP release (next story) will have served to remind the central bank of the mounting downside risks to activity that must also be managed.
GDP growth disappoints in the September quarter 2023
According to the ABS, Australia’s real GDP rose by just 0.2 per cent in the September quarter of this year (seasonally adjusted). That was the softest quarterly growth outcome since the September quarter of 2022 and means that quarterly growth has decelerated from 0.9 per cent in the final quarter of last year, 0.5 per cent in the March quarter of this year and 0.4 per cent in the June quarter 2023. It was also much softer than market expectations for a 0.5 per cent quarterly growth rate in Q3:2023
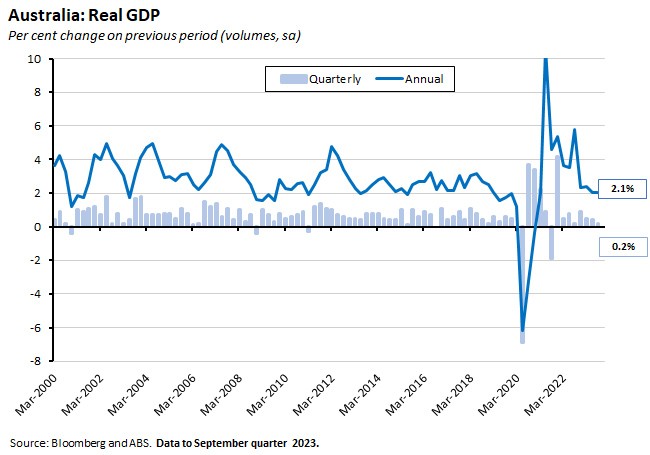
The pace of annual GDP growth was little changed at 2.1 per cent. That was above the median forecast of 1.9 per cent, but this reflected ABS revisions to back data.
On a per capita basis, real GDP shrank by 0.5 per cent over the quarter following a 0.1 per cent contraction in the June quarter 2023. GDP per capita also fell 0.3 per cent over the year. In other words, only a rising population has kept the economy growing during recent quarters.
In more positive news, labour productivity as measured by GDP per hour worked rose 0.9 per cent over the quarter in Q3:2023 after having fallen for five consecutive quarters before that. Even so, it was still down 2.1 per cent over the year.
Nominal GDP growth was 1.2 per cent quarter-on-quarter and 4.5 per cent year-on-year while the terms of trade fell 2.6 per cent over the quarter and dropped nine per cent over the year.
Turning to the detail, by expenditure component, GDP growth over the third quarter was driven by government consumption, gross fixed capital formation and a change in inventories. The rise in government consumption was due to contributions from various state and federal support programs (mainly the Energy Bill Relief Fund and the expansion of the Child Care Subsidy) as well as a lift in defence expenditure related to large scale international training exercises that were held in Australia last quarter.
Higher investment was led by private non-dwelling construction with a smaller contribution from intellectual property products, while a sharp rise in quarterly investment by public corporations was largely offset by a quarterly decline in general government investment.
The change in inventories reflected a drop in the rate of decline in inventories, which only fell by $0.5 billion in the September quarter after having fallen by $2.8 billion in the June quarter. (Remember that for the change in GDP it is the change in net inventory investment that matters, where inventory investment is the change in the stock of inventory. That means that a smaller decline in the current period than in the preceding period drives increase in GDP.) The difference between the two quarters mainly related to the mining industry where falls in exports of coal, iron ore and LNG exceeded declines in the corresponding production volumes, leading to a build-up of stocks.
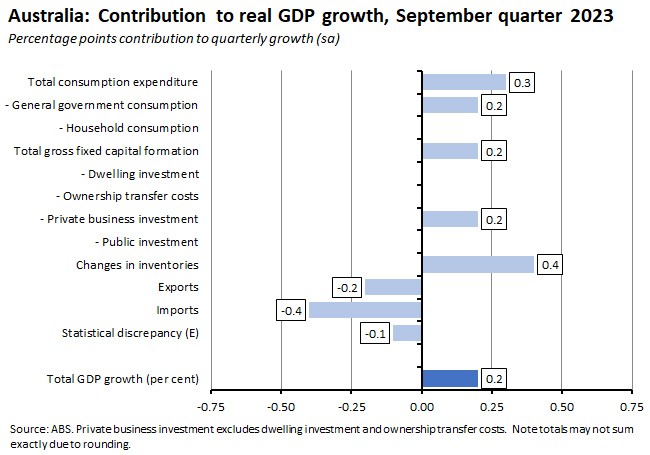
Net trade subtracted 0.6 percentage points from quarterly GDP growth, reflecting the combined impact of a fall in exports and a rise in imports.
The key story in this quarter’s results was the weakness in household consumption, which was unchanged over the quarter, making no contribution to quarterly GDP growth, and which was up just 0.4 per cent over the year (and down in per capita terms). That 0.4 per cent annual growth rate was the weakest result since a COVID-hit March quarter 2021.
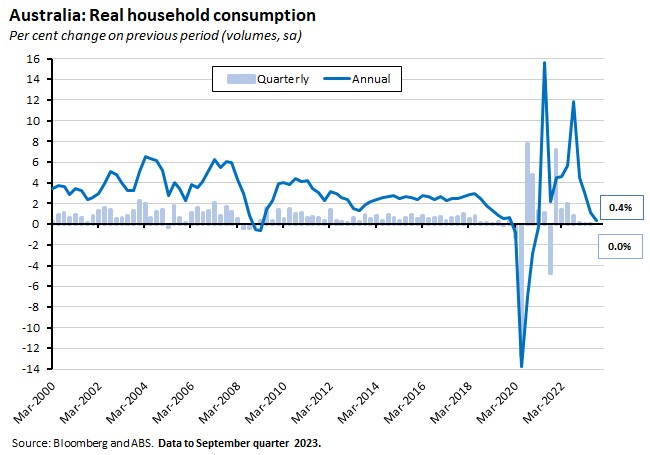
The ABS said that one important part of the story here was the impact of those supportive government policies relating to electricity and childcare noted above, which in effect meant that increased government consumption substituted for household consumption.
But another important part of the story was the squeeze on household disposable income due to higher income tax payments (with the end of the Low and Middle Income Tax Offset (LMITO) and the impact of inflation-driven bracket creep), and higher payments on mortgages due to the expiration of fixed rate arrangements (recall that the cash rate was unchanged over Q3:2023).
If we look at growth in nominal (before inflation) household incomes over the third quarter, the data show that although labour income in the form of compensation to employees contributed two percentage points to growth in household disposable income (and non-labour income contributed a further 0.4 percentage points), this was almost fully offset by a 2.4 percentage point decline due to higher income payable. The net impact was that household gross disposable income only rose by a meagre 0.1 per cent over the September quarter and by just one per cent over the year.
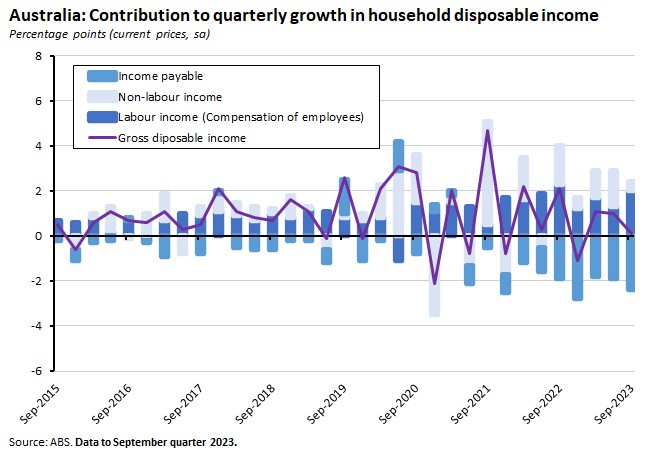
Indeed, growth in income payable (up 6.3 per cent over the quarter and 27.9 per cent over the year) saw the strongest annual growth since the September quarter 1977, propelled by a 7.6 per cent quarterly increase in income taxes paid and a similarly sized increase in interest paid on mortgages. As a result, households were compelled to further reduce their rate of savings to sustain consumption spending, sending the household savings ratio down to 1.1 per cent and its lowest level since the December quarter 2007.
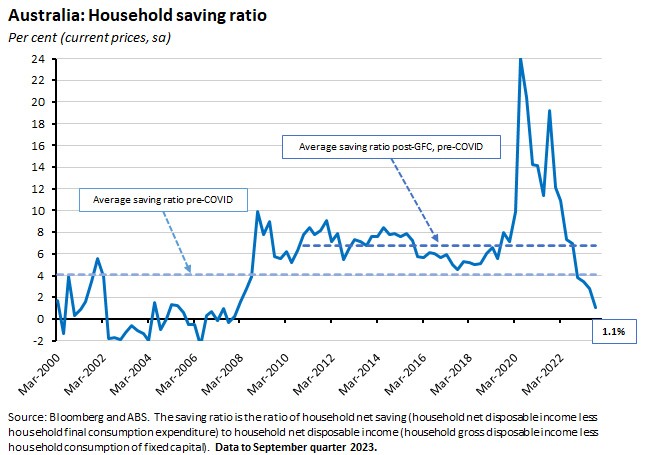
Furthermore, note that these numbers are in nominal terms. With inflation running at an annual rate of 5.4 per cent in the September quarter, real disposable household income went backwards.
The rise in the burden on households from debt service and taxation has been dramatic. Back in the final quarter of 2019, pre-pandemic, interest payments on dwellings amounted to about 3.3 per cent of total gross household income. As of the September quarter of this year, they had risen to about 5.6 per cent. Income tax payments over the same period have climbed from about 14.5 per cent of gross income to around 17.2 per cent. That latter figure is good news for the fiscal bottom line. It also means that fiscal policy is – contrary to some earlier fears – doing some work to cool the economy. But it is also likely to present the government with an interesting policy dilemma at the time of next year’s budget when households will be looking for some cost-of-living relief.
Inflation surprisingly low in October 2023
Last week, the ABS said that Australia’s monthly Consumer Price Index (CPI) Indicator rose 4.9 per cent over the year to October 2023. That was down quite sharply from a 5.6 per cent print for the monthly indicator in September 2023. It also came in below the consensus forecast, which had anticipated a rate of 5.2 per cent.
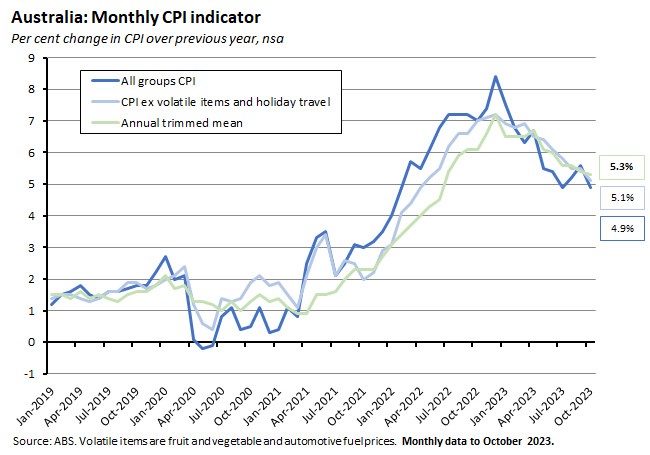
Underlying measures of inflation were stronger than the headline rate: the annual trimmed mean rose by 5.3 per cent while the CPI excluding volatile items and holiday travel increased by 5.1 per cent. Still, both were again down from their September 2023 rates (5.4 per cent and 5.5 per cent, respectively), although the pace of disinflation was slower than that experienced by the headline CPI.
The disinflation in the annual rate of CPI increase in October was largely driven by slowdowns in four categories: housing; transport; recreation and culture; and clothing and footwear.
- In the case of the housing category, the rate of price increase eased from 7.2 per cent in September to 6.1 per cent in October. That was partly due to a slowdown in the rate of new dwelling price increases from 4.9 per cent to 4.7 per cent, with the latter result the slowest annual rate reported since August 2021, as improved supply conditions relieved some of the pressure on building material costs. The rate of rental price inflation also eased from 7.6 per cent in September to 6.6 per cent in October. This mostly reflected an increase in Commonwealth Rent Assistance that took effect from 20 September, however. Absent this impact, rents would instead have risen 8.3 per cent. Another contributing factor was electricity prices, which rose 10.1 per cent in the year to October after having jumped by 18 per cent over the year in September. In this case, base effects were important, reflecting the large monthly increase in October 2022, while prices also continue to be influenced by the shifting impact of government support measures: the ABS noted that while electricity prices have risen 8.4 per cent since June 2023, in the absence of Energy Bill Relief Fund rebates, they would have risen by 18.8 per cent.
- Inflation in the transport category fell from 7.2 per cent in September to 6.1 per cent in October, pulled down by a significant slowing in the rate of increase in automotive fuel prices, which fell 2.9 per cent over the month after having risen by 3.3 per cent in September. On an annual basis, the rate of fuel price increases tumbled from 19.7 per cent to 8.6 per cent in October, mainly due to base effects arising from the reinstatement of the full fuel excise tax from 30 September last year. That had produced a seven per cent monthly rise in fuel prices last October, with that effect dropping out of the annual calculations this year.
- The rate of price increases in recreation and culture eased from 3.5 per cent in September to 2.7 per cent in October, reflecting a slowdown in holiday travel and accommodation price gains (from 1.9 per cent to 1.3 per cent, with the ABS highlighting that the latter was the lowest annual increase since February 2022 and well down from the December 2022 peak of 29.3 per cent). Prices fell seven per cent over the month, due to a fall in demand for domestic and international holiday travel with the end of the school holiday period and the passing of the peak European travel season.
- Finally, inflation in the furnishings, household equipment and services sector dropped from 2.3 per cent to just 0.4 per cent, reflecting outright deflation in some goods categories.
The better-than-expected inflation result likely contributed to the RBA’s decision to hold the cash rate target unchanged this week (see above), although it should be noted that much of the large fall in the headline rate reflected developments volatile items such as automotive fuel and holiday transport. As already mentioned, measures of underlying inflation showed a much more modest pace of disinflation.
Further, the RBA has cautioned that the October inflation numbers did not provide much additional information on services inflation, which is where the central bank’s attention is most focussed. This is a product of the way that the monthly CPI indicator is constructed: not all prices are updated every month, but instead are updated as the data become available over the course of the quarter. For example, in the first month of each quarter (October in this case) there are no updates to prices for restaurant meals, takeaway and fast foods, hairdressing and personal grooming, other household services, other recreational sports and cultural services and medical and dental services. That means that there are no updates for many of the so-called ‘market services’ which the RBA has emphasised are of particular concern at the moment, which will arrive later in the quarter.
National Home values record high in November 2023
CoreLogic’s national Home Value Index (HVI) rose 0.6 per cent over the month in November 2023 to be up seven per cent over the year. While that tenth consecutive monthly rise was enough to propel the national HVI to a new record high, it was also the smallest monthly increase recorded since house prices started rising in February this year.
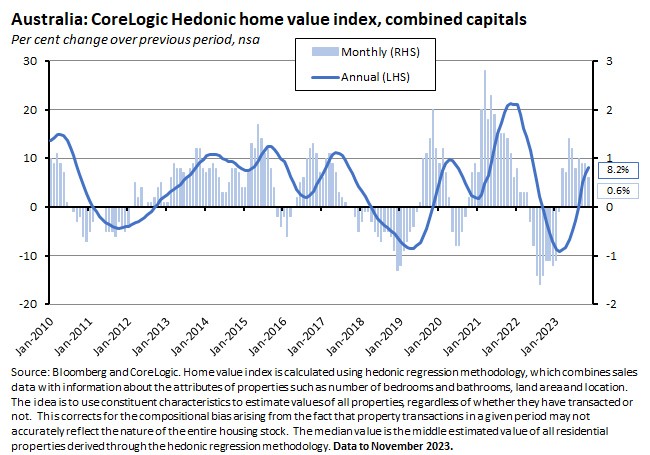
Combined capitals dwelling values were also up 0.6 per cent over the month and were 8.2 per cent higher over the year. Values rose strongly over the month in Perth (up 1.9 per cent), Brisbane (1.3 per cent), and Adelaide (1.2 per cent) but rose more modestly in Canberra (0.5 per cent) and Sydney (0.3 per cent). Values fell over November in Darwin (down 0.3 per cent), Hobart and Melbourne (both down 0.1 per cent).
According to CoreLogic, the softening in the monthly growth rate is a sign that the RBA’s November rate hike has ‘taken some heat out of the market.’ The data provider also cited further market headwinds in the form of rising advertised stock levels, deteriorating affordability metrics and low household sentiment.
On those adverse affordability metrics, CoreLogic said that the median dwelling value to income ratio has now risen to 7.5 while the share of household income needed to service a new mortgage is close to record highs at 46.6 per cent. Moreover, it now takes households an average of about ten years to save a 20 per cent deposit. Given these headwinds, the data provider reckons that ‘the housing market is moving through a new inflection point, with the rate of growth in home values becoming more diverse, but generally weakening.’
CoreLogic also reported that rental markets remained extremely tight last month, with capital city vacancy rates down at just one per cent, and particularly low in Adelaide (0.3 per cent), Perth (0.6 per cent) and Melbourne (0.8 per cent). Rental affordability is being squeezed: the share of household income dedicated to rental payments has climbed to 31 per cent.
What else has happened on the Australian data front?
Australia ran a small current account deficit of $0.2 billion (seasonally adjusted) in the September quarter 2023, down from a surplus of $7.8 billion in the preceding June quarter. According to the ABS, the move to a current account deficit mainly reflected a sharp fall in the surplus on goods and services trade, which narrowed by $8 billion, falling from $30.9 billion in the June quarter of this year to $22.9 billion in the September quarter. This was only partially offset by a modest narrowing of the net primary income deficit by around $0.4 billion as mining companies reduced their dividend payments to overseas investors on the back of lower profits. The shift in the trade balance was driven in large part by a fall in the price of some key commodity exports including for coal and LNG alongside a rise in some import prices including the price of oil. As a result, the terms of trade for net goods and services trade fell 2.6 per cent over the quarter and nine per cent over the year. The fall in the overall trade surplus also reflected a shift into deficit on services trade, where the increase in services imports outpaced growth in services exports as Australians continued to spend heavily on overseas travel.
The ABS said that the seasonally adjusted balance on goods trade rose by $0.9 billion in October 2023 to a surplus of $7.1 billion, reflecting a $0.2 billion rise in exports (driven by metal ores and minerals) and a $0.8 billion decline in imports (due to a drop in purchases of industrial transport equipment.
The ABS published Government Finance Statistics for the September quarter 2023. The general government net operating balance fell $42.1 billion over the quarter to record a deficit of $9.8 billion. Total general government expenses fell 1.7 per cent over the quarter while total general government revenues dropped by 17.4 per cent, due to a 20.4 per cent fall in taxation revenue. See also ABS Insights into Government Finance Statistics for a more detailed look at developments on the expenditure side of the fiscal accounts.
The total value of residential dwellings in Australia rose by $261 billion to $10,267.4 billion in the September quarter 2023. The ABS also said that the number of residential dwellings rose by 52,300 to 11,094,500. As a result, the mean price of residential dwellings rose by $19,200 to $925,400. By state and territory, the mean price ranges from a high of $1,187,200 in New South Wales to a low of $525,900 in the Northern Territory.
The ABS’s latest Tourism Satellite Accounts estimate that tourism GDP jumped by 60.1 per cent to $57.1 billion (chain volume terms) in 2022-23 while its contribution to the economy rose to 2.5 per cent of GDP. Despite the growth, the tourism sector is still smaller than pre-COVID (it hit a peak of $63.4 billion in 2018-19) and accounts for a smaller share of the economy than it held then (3.1 per cent in the same year).
Payroll jobs for the week ending 11 November 2023 were down 0.2 per cent over the month but up 2.2 per cent in annual terms. The ABS said that the number of jobs has ‘remained relatively steady over the past couple of months’ and that the rate of annual growth has slowed relative to earlier in the year.
According to the ABS, new loan commitments for housing rose 5.4 per cent over the month (seasonally adjusted) in October 2023 to be up 4.9 per cent in annual terms. Lending to owner-occupiers was 5.6 per cent higher month-on-month and 1.4 per cent higher year-on-year while the corresponding growth rates for lending to investors were five per cent and 12.1 per cent, respectively. The ABS commented that the growth in the value (and number) of new owner-occupier loans has been relatively strong in trend terms since February of this year, due to a combination of demand for housing and rising home prices.
The ABS published its set of Business Indicators for the September quarter 2023. Company gross operating profits fell 1.3 per cent over the quarter (current prices, seasonally adjusted) while wages and salaries were up 2.7 per cent.
The ABS Monthly Household Spending Indicator rose 2.7 per cent over the year in October 2023 (current price, calendar adjusted basis). Spending on services was up seven per cent year-on-year while spending on goods fell 1.9 per cent. Non-discretionary spending rose seven per cent relative to October 2022 and discretionary spending was down two per cent. The annual rate of growth in spending has slowed from 5.2 per cent in August and 4.3 per cent in September with October’s 2.7 per cent the weakest annual growth rate reported since February 2021.
The ABS said that retail turnover was down 0.2 per cent month-on-month (seasonally adjusted) in October 2023, and was up just 1.2 per cent relative to October 2022. The monthly outcome was a little weaker than the market’s expectation for a 0.1 per cent increase. Turnover was down over the month in every category except food retailing, with the Bureau noting that ‘It looks like consumers hit the pause button on some discretionary spending in October, likely waiting to take advantage of discounts during Black Friday sales events in November.’ The ABS added that this pattern associated with Black Friday sales had developed in line with the growing popularity of the former over recent years. The annual rate of growth in October was the weakest recorded since August 2021 during the pandemic. And after adjusting for population growth (which has been running comfortably above two per cent), the per capita spend looks to have gone backwards again.
ANZ-Indeed Australian Job Ads fell 4.6 per cent over the month in November 2023. According to ANZ, the number of Ads has fallen by a cumulative 8.4 per cent over the past three months and the series is down 16.8 per cent from its peak in November 2022. Last month’s drop was also the largest monthly decline (outside the pandemic period) since June 2018. All of which is consistent with a degree of labour market cooling. Even so, the series remains elevated in historical terms – up 36.7 per cent relative to its pre-COVID February 2020 level.
The ANZ Roy Morgan Consumer Confidence Index slipped by 0.3 points to an index reading of 76.4 for the week ending 3 December 2023. The index has now spent a record 44 consecutive weeks below a reading of 85, indicating ongoing weakness. Weekly inflation expectations rose 0.2 percentage points to 5.6 per cent.
ABS data on Jobs in Australia for 2020-21. There were 20.8 million jobs in that financial year, of which 5.5 million were held by migrants (what had arrived in Australia since 2000).
ABS data on Personal Income in Australia shows that median personal income in 2019-20 was $54,890, up 4.9 per cent on 2019-20. Median employee income was $56,547.
The ABS forecasts Australia’s population to rise from 26 million in 2022 to between 34.3 million and 45.8 million by 2071. Net overseas migration is doing the work here, with the ABS scenarios projecting net gains of between 9.2 million and 14.1 million over the projection period. If net overseas migration were instead zero, the related ABS scenario shows population falling to 23.9 million by 2071.
Last week, the ABS said that the total number of dwellings approved in October 2023 rose 7.5 per cent over the month (seasonally adjusted) to 14,223. Approvals for private sector houses rose 2.2 per cent to 8,505 while approvals for private sector dwellings excluding houses jumped 19.5 per cent to 5,554. The Bureau noted that despite October’s increase, the total number of approvals has been relatively low over the current financial year: there were 55,029 approvals between July and October 2023 (original basis) compared to 65,599 approvals over the corresponding period last year.
Also last week, the ABS released new numbers on private new capital expenditure (‘capex’) and expected capital expenditure for the September quarter 2023. Total new capex was up 0.6 per cent over the quarter (seasonally adjusted) and 10.7 per cent higher over the year. That was just a bit softer than the market consensus forecast, which had predicted quarterly growth of one per cent. Capex on buildings and structures was up 0.7 per cent in quarterly terms and 13.7 per cent in annual terms, while capex on equipment, plant and machinery rose 0.5 per cent over the quarter and 7.4 per cent over the year. According to the ABS, the mining sector was the main driver of investment spending over the quarter (up 5.6 per cent) reflecting in part the impact of spending on iron ore projects and battery-related mineral developments, as well as new purchases of vehicles and machinery. At the same time, non-mining capex fell 1.3 per cent, albeit after a sequence of large increases over the previous four quarters.
The fourth survey estimate for total capex in 2023-24 was $171.2 billion. That was up 8.5 per cent from Estimate 3 with the Bureau highlighting ‘a particularly large rise’ for the information media and telecommunications industry, due to planned investment in new data centres. It was also more than ten per cent higher than Estimate 4 last year.
One final data point from last week: the ABS said that total construction work done in the September quarter 2023 rose 1.3 per cent (seasonally adjusted) to stand 8.5 per cent higher than in Q3:2022. Building work done rose 0.2 per cent over the quarter and 3.4 per cent over the year, driven by residential construction which was up 1.3 per cent quarter-on-quarter and 4.4 per cent year-on-year, while non-residential construction fell 1.6 per cent in quarterly terms but was still 1.9 per cent higher over the year. Engineering work done was up 2.6 per cent in quarterly terms and 14.9 per cent on an annual basis.
Australia’s Energy Account (published by the ABS at the end of last month) shows that in the 2021-22 financial year, solar and wind energy supply exceeded household electricity use for the first time.
Other things to note . . .
- From the ABS, 11 things that happened in the Australian economy during the September quarter 2023.
- An ABS essay setting out the history of the CPI to mark the 75-year milestone of the series as the official measure of Australian inflation. The Bureau is promising that a full monthly CPI indicator will be available by the end of 2025.
- Also from ABS, the Bureau will stop publishing data on retail trade from August 2025. The series will be replaced by the Bureau’s new Monthly Household Spending Indictor. The new measure covers around 68 per cent of household consumption compared to 33 per cent coverage for the retail trade series.
- The new RBA chart pack.
- Considering the government’s decision to surrender its veto power over the RBA. (Some historical background to the current set up.)
- On the 40th anniversary of floating the AUD.
- A new report evaluating the barriers for small and medium businesses to commercialise innovative ideas in Australia.
- The Grattan Institute looks at the potential for hydrogen.
- In the AFR, Danielle Wood and Alex Robson of the Productivity Commission (PC) say that we should not be too worried (yet) about Australia’s recent poor productivity performance, arguing that ‘a good deal’ of the plunge in productivity growth can be explained by the COVID-19 lockdowns and the economic cycle, rather than indicating a structural problem. Longer-term performance (over the past 15 years) might be a different matter, however.
- Two new draft reports from the PC. The first sets out some draft findings and recommendations relating to philanthropic giving in Australia and the second presents the same but relating to access to early childhood education and care services.
- In the latest Quarterly Essay, Alan Kohler delivers a deep dive into ‘Australia’s housing mess and how to fix it’.
- The November 2023 OECD Economic Outlook. And the Australia country outlook. For Australia, the OECD sees real GDP growth slowing from 1.9 per cent this year to just 1.4 per cent in 2024, before recovering to 2.1 per cent in 2025. Headline consumer price inflation is forecast to slow from 5.6 per cent this year to 3.4 per cent next year and 2.8 per cent the year after. And the unemployment rate is projected to increase gradually from 3.7 per cent to 4.1 per cent to 4.3 per cent over the same period.
- The BIS Quarterly Bulletin December 2023.
- Why it’s easier to fight inflation now than it was in the 1970s and 1980s.
- The heads of the IMF, European Commission and WTO make the case for carbon pricing in the FT.
- On the doom loop linking insurance markets and climate change.
- A WSJ long read on Argentina’s ‘El Loco’.
- The decline of US power has been greatly exaggerated.
- The new economics of industrial policy.
- Two new Peterson Institute working papers. The first asks, now that trade hyperglobalisation is dead, what comes next? And the second considers green innovation and the transition toward a clean economy.
- The outlook for the global trend interest rate (global R*).
- Evidence from the world’s largest test of basic income on lump sum vs regular payments finds that ‘by almost every financial metric’ the former approach does better. On the other hand, those who received monthly payments tended be generally happier and report better mental health.
- Tracking trends in billionaire inheritance.
The December 2023 issue of the IMF’s Finance & Development magazine includes a series of essays on Artificial Intelligence (AI) including Brynjolfsson and Unger on the macroeconomics of AI, Acemoglu and Johnson on rebalancing AI, and Korinek on scenario planning for an A(G)I future.
Latest news
Already a member?
Login to view this content


