

 This product has already been purchased.


Overview
- As widely expected, the RBA’s Monetary Policy Board (MPB) voted this week to increase the cash rate target by 25bp to 4.6%. The vote was unanimous.
- The consensus expects that monetary policy will have to tighten further from here but is less sure on the precise timing.
- The August inflation numbers that followed the MPB meeting showed headline inflation back up at 4% and so further away from target while underlying inflation remained stuck at 3.6%. There was nothing in the data to suggest that the MPB got this week’s decision wrong.
- House prices continue to slide, with National dwelling values falling for a sixth consecutive month in September. They are now more than 5% below their March 2026 high. Prices are dropping in almost every capital city while turnover is down and inventory is up.
- The final budget outcome for 2025-26 showed lower debt and deficit numbers than had been projected by Budget 2026. Despite a marked increase in the debt burden over recent years, Australia’s debt position continues to look superior to many of its peers.
Australia continues to struggle with above-target inflation. In response, the RBA’s Monetary Policy Board (MPB) increased the cash rate target for a fourth time this week, taking the policy rate up to 4.6% and to its highest level in 15 years. A mix of higher fuel prices due to the war in the Persian Gulf, the impact of the AI boom on already-stretched domestic capacity, and the presence of longer-running constraints and price pressures in the domestic economy all drove the need to tighten policy. The next-day release of August 2026 inflation numbers promptly validated the MPB’s decision, with the headline inflation rate returning to 4% while underlying inflation remained stuck at 3.6%. The probability of further policy tightening remains high.
This week also brought news of further weakness in the Australian housing market along with better-than-expected debt and deficit data for 2025-26. We dig into all this in more detail below, summarise some of the week’s other data releases, and provide the usual list of suggestions for further reading and listening. Oh, and that global bond market disruption we discussed a little while back? Still underway.
The cash rate is now at a 15-year high
In a widely anticipated move (just ahead of the meeting, market pricing had assigned a greater than 90% probability to a hike) the MPB voted unanimously this week to increase the cash rate target by 25bp to 4.6%. That marked a fourth rate rise in the current monetary policy tightening cycle and took the policy rate up from 3.6% at the start of this year, past the peak of the previous tightening cycle (4.35%), and on to its highest rate since late 2011.
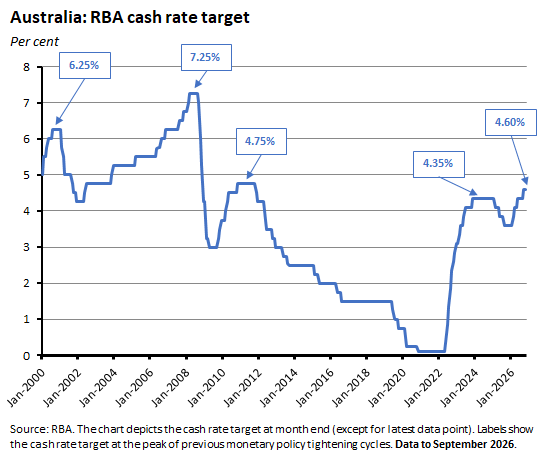
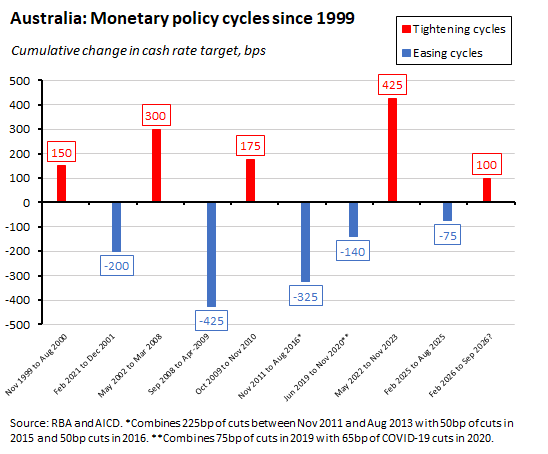
At the time of writing, markets were still anticipating one or two more rate rises by the first half of next year. Another 25bp would take the cash rate target to 4.85%, the highest rate since late 2008 and a new high for post-GFC Australia. That said, at either 100bp or 125bp, the current tightening cycle would still look quite shallow relative to its predecessors.
This week’s vote to tighten policy reflects the combination of three inflation risk factors.
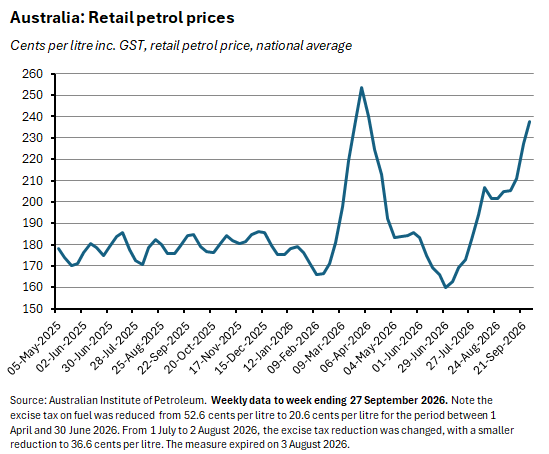
First, developments in the Middle East conflict have further disrupted global oil supply. The RBA worries this disruption ‘could last longer than anticipated and cause energy price pressures to last for longer than we previously assumed.’ Higher oil prices have already boosted fuel prices, and the latter have ‘partially been passed through to prices of other goods and services.’
Second, an ‘AI boom is also adding to demand in the Australian economy at a time when we already have capacity pressures.’
And third, recent data have suggested that ‘growth and inflation in Australia have been higher than expected.’
As a result, the danger was that ‘inflationary pressures will persist for longer than previously expected.’
Given this risk environment, is the market right to expect more rate increases? The statement accompanying this week’s rate decision did warn that:
‘The Board will continue to do what it considers necessary to bring inflation sustainably back to target, including increasing the cash rate target further if needed.’
And in her opening remarks at the post-meeting press conference, Governor Bullock began by telling her audience:
‘The Board will increase interest rates again if that’s what’s needed to get inflation down.’
All of which sounded quite hawkish. At the same time, some of her later responses during the Q&A session sounded a little more dovish. For example, she reminded her audience that:
‘If it turns out that the restrictiveness that we’ve introduced by these interest rate rises is enough to bring some of those inflationary pressures back, then maybe there doesn’t need to be any more interest rate rises.’
And when asked about the need for further rate increases, she explained:
‘I think it comes back down again to the lags in the way monetary policy works…we raised between February and May…that’s not very long for interest rates to work their way through the economy…It doesn’t happen overnight…Our estimates suggest that it can take 12, perhaps even 18 months in some sense for the full effect of interest rates to come through…the point I want to make is that we’ve got to see how these four interest rate rises feed through.’
So, another rate hike is not quite cut and dried. But given the current environment and the RBA’s assessment of the balance of risks, it remains highly likely. And as set out below, the inflation data that followed the MPB meeting will have done nothing to change the Board’s mind regarding its decision.

Inflation has a four in front of it again
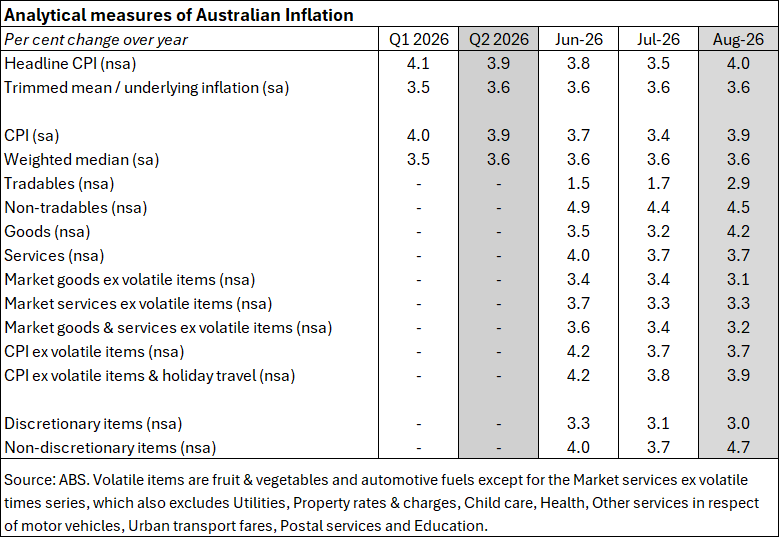
The ABS said that Australia’s Consumer Price Index (CPI) rose 0.4% over the month (original basis) and 4% over the year in August 2026, up from July’s 3.5% annual rate. That was a slightly softer outcome than the market consensus forecast, which had expected 0.5% month-on-month and 4.1% year-on-year. But it was still the strongest result since May this year and means that across the eight months since January 2026, headline inflation has now had a ‘four’ in front of it four times.
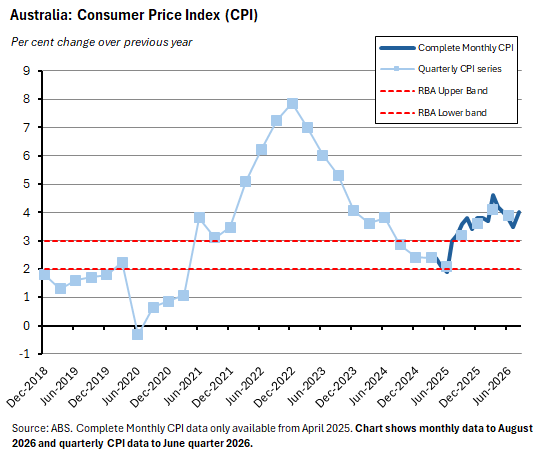
The Bureau noted that the two biggest contributors to the jump in the annual headline rate in August were the Housing (1.2ppt) and Transport (0.6ppt) groups. The annual rate of Housing inflation rose to 5.7% from 5% in July. That reflected a 5.4% increase for New dwellings as project home builders lifted their prices to pass through higher labour and materials costs; a 13.2% rise for electricity largely reflecting the timing of the end of Commonwealth electricity rebates last year; and a 3.6% increase for rents. The Transport group reported a 5.6% increase, driven in large part by a 13.5% increase for automotive fuel prices. The latter also jumped 14.8% over the month to August, driven by higher world oil prices and the expiration of the government’s remaining fuel excise relief measures.
The annual rate of underlying inflation as measured by the trimmed mean was unchanged for a third consecutive month at 3.6% following a 0.2% increase over the month. That was close to market expectations of a 0.3% month-on-month increase and a 3.6% year-on-year rise.
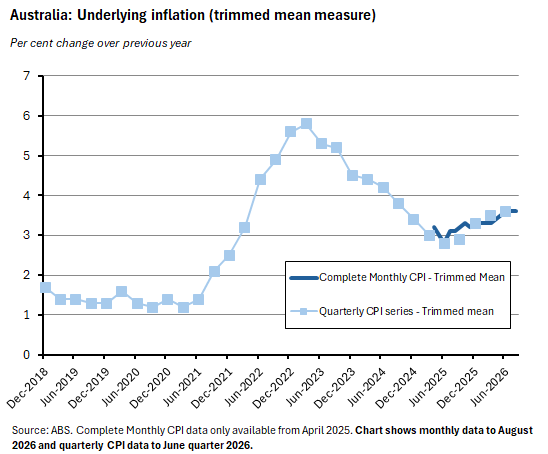
Other indicators of underlying inflation sent a similar signal, with the weighted median measure of underlying inflation also printing at 3.6% for a third straight month. The annual rate of increase in the CPI excluding volatile items and holiday travel nudged up to 3.9% in August from 3.8% in July.
Most other analytical measures of inflation continued to rise at an annual rate of 3% or more, while the annual rate of tradables inflation rose from 1.7% in July to 2.9% due to higher energy prices. Higher energy prices also helped lift the rate of goods inflation from 3.2% to 4.2% over the same period. Notably, the annual rate of increase for non-discretionary items (essentials) has now jumped to 4.7%, implying additional pressure on living costs.
House prices keep on falling
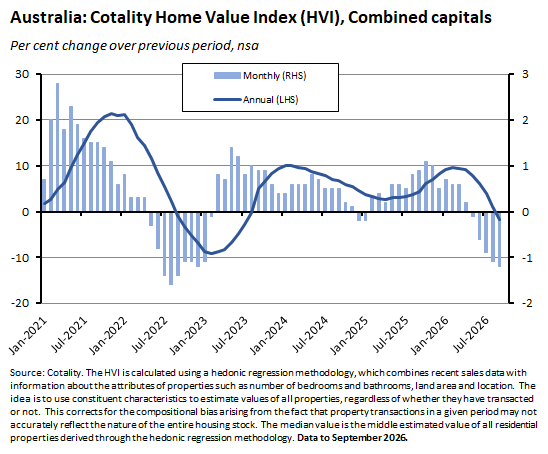
Cotality’s National Home Value Index fell 1.1% over the month in September, recording a sixth consecutive decline. This latest drop means that the national index is now flat over the year, with dwelling values 5.2% below their March 2026 record high. The Combined capitals index fell 1.2% over the month and dropped 1.8% over the year.
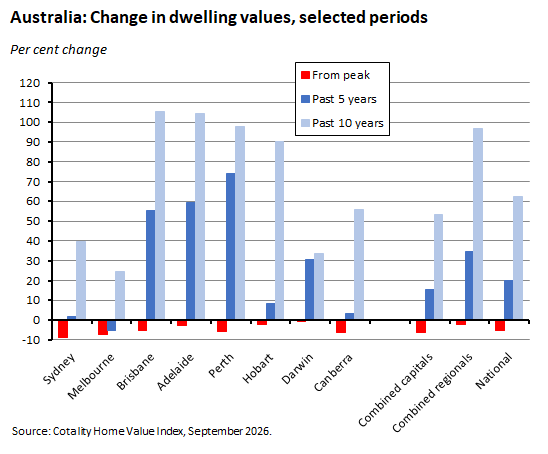
Every capital city except Darwin (up 0.4%) recorded a fall in values last month, with the size of the decline ranging from a 1.5% drop in Brisbane to a 0.7% fall in Melbourne. Sydney values are now 8.6% below their February 2026 peak while Melbourne values are 7.5% below their March 2022 record high.
According to Cotality, housing turnover has also eased, with estimates of the number of home sales over the past three months tracking 19.1% below the same period last year, and 13.3% below the previous five-year average. Capital city homes are taking a median 39 days to sell, up from 23 days a year ago. That softening in demand has been met with a reduced flow of new listings (down 9.2% over the year across the combined capitals). Even so, total inventory levels have also risen sharply.
Meanwhile, rental markets are now seeing rising vacancy rates and slowing rental growth. The national vacancy rate rose to 2% in September, up from this February’s record low of 1.5%, for example. But while this marks the highest vacancy rate since January last year, it remains well below the pre-COVID decade average of 3.3%. Monthly rental growth eased to just 0.3% in September, recording its lowest monthly rise since May 2025. On an annual basis, rental growth is now running at 5.5%.
The fiscal outcome for 2025-26 was better than expected
The Treasurer released the final budget outcome for 2025-26 this week (full report (pdf) here). The deficit on the underlying cash balance (UCB) was $22.3 billion (0.8% of GDP), which is $6 billion smaller than the $28.3 billion (1% of GDP) deficit estimated in Budget 2026. That reflected payments that were $1.4 billion lower than the Budget had projected while receipts were $4.6 billion higher.
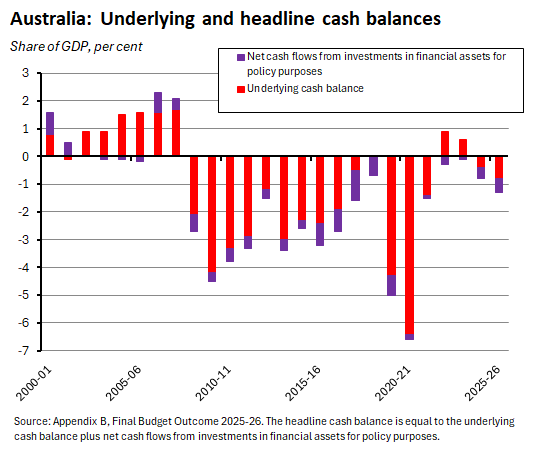
The deficit on the headline cash balance (which consists of the deficit on the UCB plus net cash flows from investments in financial assets for policy purposes – such as Clean Energy Finance Corporation loans and equity investments) was $36.1 billion (1.2% of GDP). That was $11.8 billion lower than the $47.9 billion (1.6% of GDP) shortfall anticipated in Budget 2026. As well as the improvement in the UCB noted above, cash outflows for investments were also lower than projected, mainly due to lower flows associated with Housing Australia, the Clean Energy Finance Corporation, and student loan programs.
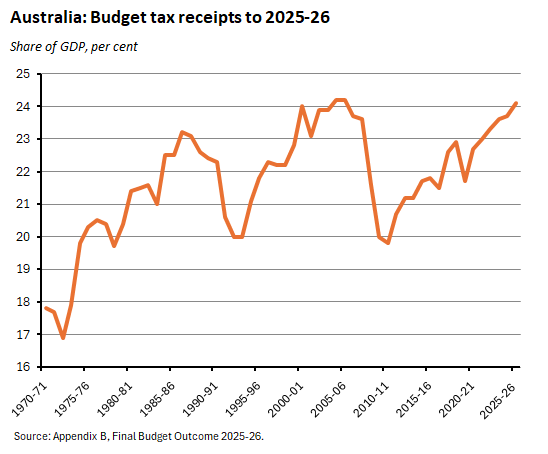
Commentary on the budget numbers has noted that the government’s tax take as a share of the economy rose to 24.1% of GDP in 2025-26. That is the highest share since 2005-06, when it reached 24.2%. Note, however, that in both 2004-05 and 2005-06, that 24.2% tax take was paired with surpluses on the UCB of 1.5% and 1.6% of GDP, respectively.
Australia’s debt position also ended 2025-26 looking better than expected. Gross debt was $971.4 billion (33.2% of GDP), which was $10.6 billion lower than the projection for $982 billion (33.1% of GDP) set out in Budget 2026, albeit slightly larger as a share of GDP. Likewise, net debt ended up at $550 billion (18.8% of GDP), $6 billion lower than Budget 2026’s projection of $556 billion (also 18.8% of GDP).
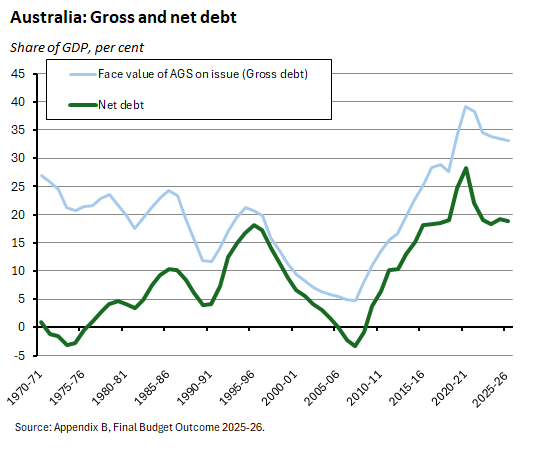
The debt story looks different depending on whether the focus is on change or on levels. The increase in the gross debt-to-GDP ratio has been quite dramatic in recent years. It rose from less than 5% of GDP in 2007-08 to a peak of more than 39% of GDP in 2020-21. Granted, that debt ratio has now fallen back by almost 6ppt. But even after taking that recent improvement into account, the Commonwealth has still seen this ratio grow by nearly 29ppt in the years since 2007-08.
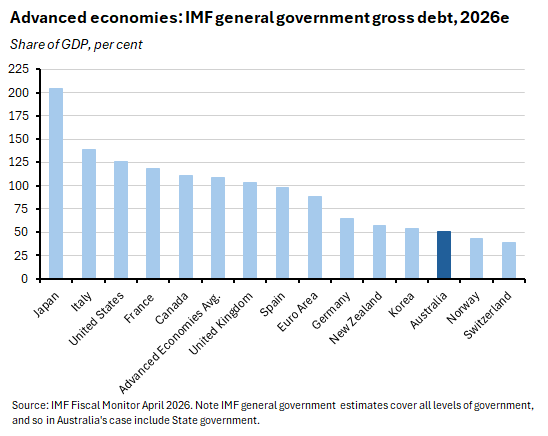
On the other hand, in terms of levels that debt burden still looks quite low when set against the position of Australia’s peers. Consider the estimates in the latest IMF Fiscal Monitor (due to be updated next week). These pull together debt across central, state and local government in a broadly consistent manner (so the numbers are higher than the gross debt figures cited above, which refer to the Commonwealth government alone) and show that Australia is carrying much less government debt relative to GDP than the average advanced economy.
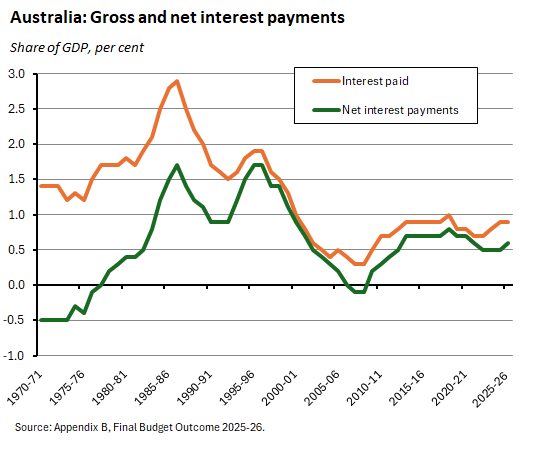
One last point on debt and deficits. Despite the large increase in Australia’s debt stock in recent years, the associated increase in the debt service burden as a share of GDP has been relatively more modest. According to the final budget estimates, gross interest paid on Australian Government Securities (AGS) in 2025-26 was about 0.9% of GDP, up from 0.3% in 2007-08. Over the same period, net interest paid has risen to 0.6% of GDP from -0.1%.
But borrowing costs are rising. The assumed weighted average cost of borrowing (WACB) across each Budget’s forward estimates has risen in recent years, suggesting upside risks to future debt service costs. Since the WACB hit a pandemic-era low of just 0.8% in Budget 2020-21, projected borrowing costs have risen by 4ppt, with a projected WACB of 4.8% in Budget 2026-27.
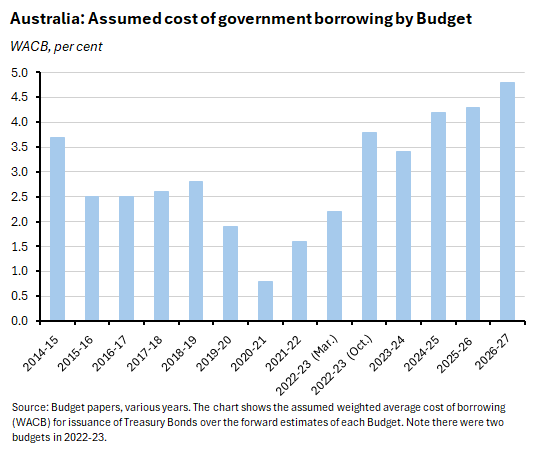
The increase may not be done, bringing us neatly back to the global bond market sell-off.
Other Australian data points to note
The ABS Monthly Household Spending Indicator was flat over the month in August 2026 (current price, seasonally adjusted basis) but was 6.8% higher over the year. Behind the static headline number were monthly falls in spending on Recreation and culture (down 1.4%), clothing and footwear and Alcoholic beverages and tobacco (both down 1%), and Health (down 0.9%) along with smaller declines for Furnishings and for Food. Those falls were offset by a large 2.3% rise in spending on Transport and more modest increases for Hotels, cafes and restaurants and for Miscellaneous goods and services. That outsized rise in spending on Transport was powered by an 8.1% jump in fuel spending along with increased purchases of new vehicles, especially EVs. According to the Bureau, if not for the rise in fuel spending, total household consumption would instead have fallen 0.3% in August.
According to the ABS, total dwelling units approved in August 2026 fell 6.1% (seasonally adjusted) to 16,953. That was up 10.3% on the same month last year. Approvals for private sector houses were up 3.7% over the month and rose 18.4% over the year to stand at 10,885, with the Bureau noting that this was the eighth consecutive month in which house approvals exceeded 10,000 units. In contrast, approvals for private sector dwellings excluding houses slumped by 21.2% in monthly terms and were 2.1% lower on an annual basis.
Engineering construction work done fell 4.7% over the June quarter 2026 (seasonally adjusted, chain volumes) to be 3.7% lower over the year. The ABS reported that work done for the private sector was down 7.4% quarter-on-quarter and fell 4.6% year-on-year while the corresponding declines for public sector work done were 0.8% and 3.7%, respectively.
The ABS said that in August 2026 its measure of job vacancies fell by 3,000, or 0.9% (seasonally adjusted), over the quarter to stand at 325,000, which was 1.3% lower over the year. Private sector vacancies were down 5,800 (2%) over the quarter and 1.5% lower over the year, while public sector vacancies were up 2,800 (7.8%) on a quarterly basis and unchanged over the year. The total level of job vacancies is now more than 31% lower than the series’ May 2022 peak, but vacancy levels remain elevated compared to pre-COVID norms.
Australia’s merchandise trade balance saw its surplus fall by $0.9 billion to $0.5 billion in August 2026. The ABS said that seasonally adjusted goods exports were up $1.7 billion (3.7%) over the month, powered by sales of Non-monetary gold, and Coal, coke and briquettes. Goods imports were up $2.6 billion (5.8%), driven by Automatic Data Processing (ADP) equipment, which includes server infrastructure such as server racks and blades and data storage hardware, as well as by imports of non-monetary gold.
Further reading and listening
- The latest RBA Chart Pack on the Australian economy.Also from the RBA, the October 2026 Financial Stability
- Review. According to the Review, the Australian financial system ‘has a good degree of resilience’ even as ‘threats to global financial stability continue to mount.’ The Review reckons that, alongside growing operational vulnerabilities due to advances in AI, geopolitical tensions and service provider disruptions, external factors are the most prominent threats to Australia’s financial stability. The Review judges that most Australian households with mortgages remain well placed to manage more difficult conditions, including a further sharp drop in house prices. The estimated share of variable-rate owner-occupier borrowers experiencing a cash flow shortfall – where income is not sufficient to cover scheduled mortgage repayments and essential expenses – remains relatively low at around 2%. Likewise, arrears rates remain low despite a recent pickup. The Review also reckons that most Australian businesses should be able to manage elevated cost pressures, although conditions are more challenging in some sectors including hospitality, construction and transport.
- Why China is becoming a tougher export market for Australian business.
- Recent trends for displaced workers in Australia.
- The e61 Institute asks, is compulsory superannuation asking Australians to save too much? According to the authors, the system has done a good job in addressing the two problems it was originally intended to solve which related to ‘undersaving’ by individuals for their retirement and an outlook for slowing productivity and population growth (see last week’s discussion of IGR 2026 for a recent take on this). As a result, Australia has become ‘a world leader in managing the costs of population ageing, with one of the lowest and slowest growing rates of public pension expenditure in the OECD.’ But, the authors argue, this success may have come at the cost of replacing an ‘undersaving’ problem with an ‘oversaving’ one, particularly at a 12% contribution rate.
- Also, from the e61 Institute, a look at insuring the federal government against future crises. The analysis reckons that a geopolitical crisis is currently the biggest threat facing the budget, with a potential fiscal cost of 18% of GDP at its peak and 46% over a decade, for example. Alternatively, a deep recession or bond market breakdown could imply fiscal costs peaking in the range of 3-6% of GDP. Weighted by the likelihood of occurrence, the report thinks that geopolitical and financial risks cost around 0.8% of GDP a year.
- An FT Big Read considers how AI hyperscalers are transforming debt.
- This BIS Bulletin assesses whether AI and automation can offset population ageing.
- And in the WSJ, Greg Ip reckons AI is a regulator’s nightmare.
- How China thinks about AI.
- The Allianz Global Wealth Report 2026.
- From the OECD, Education at a glance 2026 and the accompanying Australia country note. According to the latter, government expenditure on primary to tertiary education (based on initial funds, on educational institutions) in Australia was 4.1% of GDP in 2023, compared to an OECD average of 4%. Private expenditure on education in Australia was 1.4% of GDP compared to an OECD average of 0.6%.
- A short history of a nuclear pipe dream (a sceptical take on small modular reactors, or SMRs).
- A tale of Elves and Orcs.
- We may be entering the era of Bleh.
- Why the Bronze Age collapsed.
- Everything in markets is now moving incredibly fast.
- Bloomberg Australia explains why the RBA could hike again in November while the ABC’s The Economy, Stupid podcast asks, do interest rate rises hurt the wrong people?
- Tyler Cowen talks with economist Luis Garicano about AI and messy jobs, the outlook for Europe, and Spain’s political economy.
- The FT’s The Story of Money podcast on the bloody birth of the bond market
Latest news
Already a member?
Login to view this content