
Overview
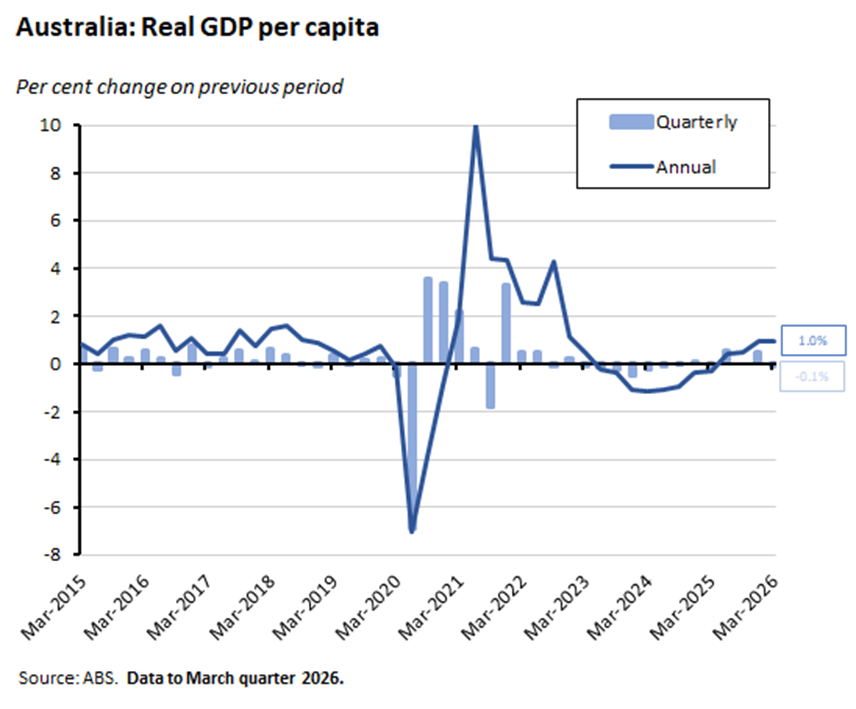
- The March quarter 2026 national accounts depicted an Australian economy that has started to slow, with quarterly growth stepping down from 0.9% the previous quarter to 0.3% last quarter. While headline annual growth was unchanged at 2.5%, real GDP per capita fell 0.1% over the quarter (but rose 1% on an annual basis).
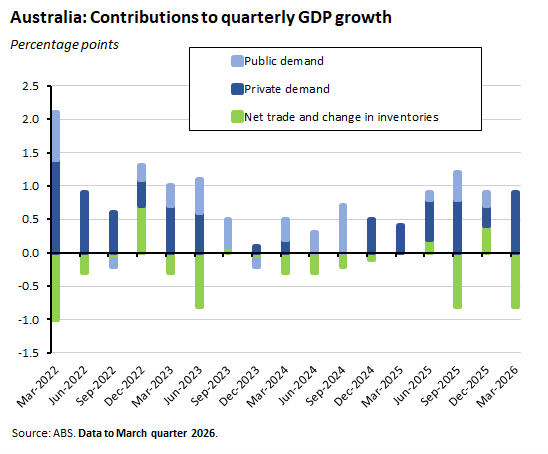
- Economic growth last quarter was powered by private demand, led by private business investment in data centres. Household consumption played a modest supporting role as consumers focused their spending on essentials and cut into their savings rate.
- Labour productivity (GDP per hour worked) fell 0.6% over the quarter and rose by just 0.3% over the year. That was a disappointing result, although the rise in business investment offers hope for a better productivity performance in the future.
- In other Australian data news, our estimated population now exceeds 28 million, the March quarter 2026 balance of payments numbers reported a quarterly deficit on goods and services trade for the first time since 2017, and the Fair Work Commission announced a 4.75% increase for modern award wages.
The March quarter 2026 national accounts captured initial signs of an economy responding to the first month of the ongoing conflict in the Middle East together with the impact on sentiment of the first two 25bp increases (on 3 February and 17 March) of the three consecutive rate hikes that the RBA has delivered to date. The numbers told two main stories.
First, the economy has started to slow. Granted, at 2.5% the headline rate of annual real GDP growth was unchanged from the (revised) December quarter numbers and therefore also remained above the RBA’s 2% estimate of the economy’s potential growth rate. So, this was far from a dramatic downturn. Still, on a quarterly basis, real GDP growth has stepped down from 0.9% to 0.3% and is now running at its slowest pace since March 2025. Moreover, on a per capita basis, real output contracted over the quarter.
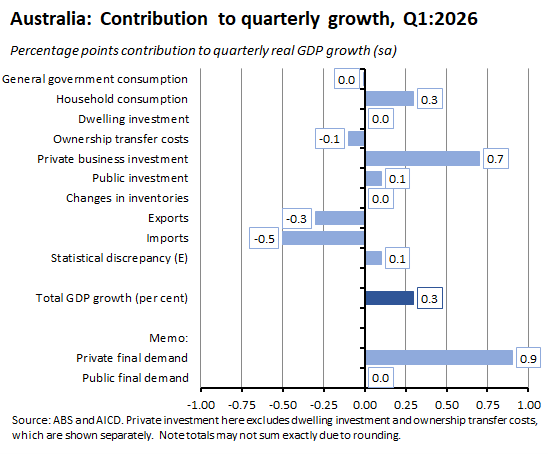
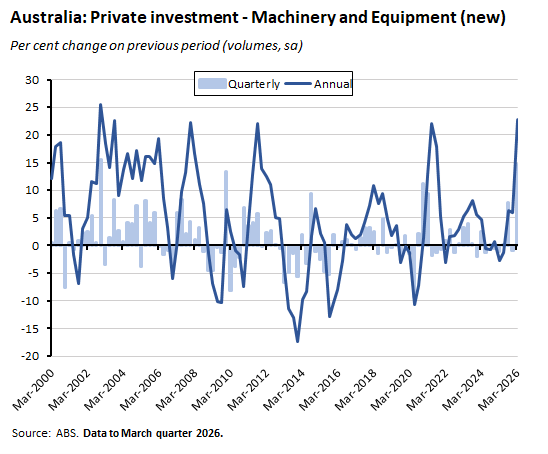
Second, the key growth driver was private business investment in machinery and equipment. That surged by 16.6% quarter-on-quarter and by 23.9% year-on-year, contributing 0.7 percentage points to the quarterly growth rate. Powering that jump in capital expenditure (‘capex’) was spending on data centres. In a context where household consumption contributed only modestly to the March growth outcome (and then mainly in the form of spending on essentials), public demand made no significant net contribution, and both exports and imports served as growth headwinds, the March quarter growth story was largely one of data centre-powered growth. (Although note that the positive lift to growth from higher investment has to be set against the associated rise in imports of capital goods).
We dig into the GDP data in more detail below. We also cast an eye over a slew of other data releases that arrived this week, from house prices to the balance of payments.
Growth eased slightly in the March quarter
The ABS said that Australia recorded real GDP growth of 0.3% over the March quarter of this year (seasonally adjusted), with annual growth running at 2.5%. The quarterly pace of growth was down markedly from the December quarter 2025’s 0.9% rate and represents the lowest quarterly reading since the March quarter of last year. Growth over the year was unchanged from the previous quarter after the Bureau revised the December quarter’s growth to 2.5% from a previous estimate of 2.6%.
The market consensus forecast had anticipated 0.4% quarter-on-quarter and 2.6% year-on-year outcomes, so the actual first quarter result was a little softer than expected. Even so, the annual rate of growth remains above the RBA’s estimate of the economy’s potential rate of growth, which it puts at ‘around 2%.’
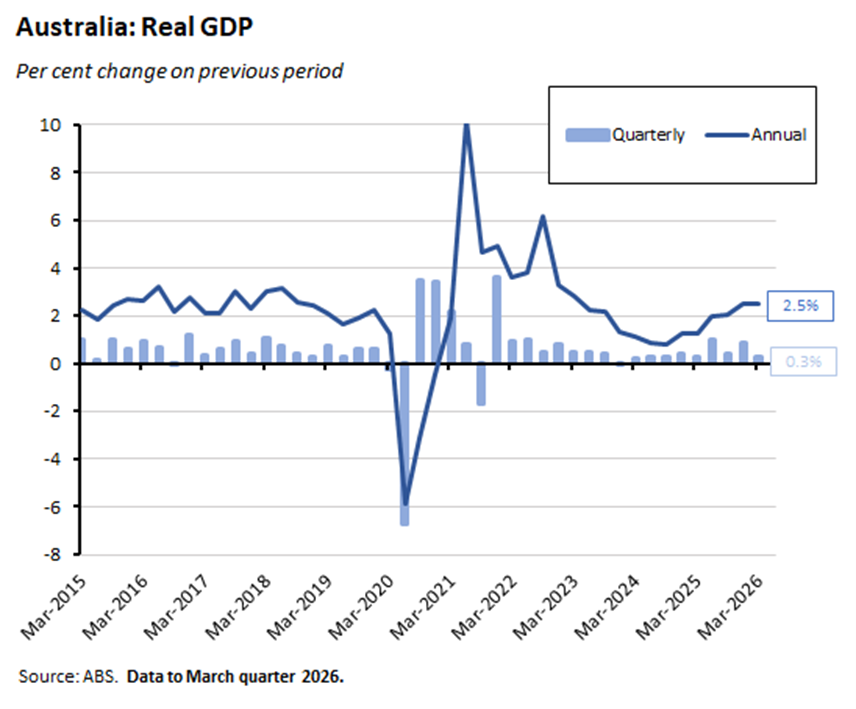
On a per capita basis, real GDP fell 0.1% over the quarter (the first drop since the same quarter last year) although it was still up 1% year-on-year.
Overall, domestic final demand contributed one percentage point to GDP growth, with nearly all of that reflecting private final demand, which contributed 0.9 percentage points. The Bureau said that the slowdown in quarterly real GDP growth reflected a mix of subdued household consumption, limited public sector expenditure, and a sizeable drag from net trade.
Investment-led growth kept the economy moving
Household consumption grew 0.5% over the quarter to be 2.5% higher through the year, contributing a modest 0.3 percentage points to overall GDP growth. Growth in real consumption was little changed from the December quarter, with the annual rate of increase the same and the quarterly growth rate nudging up slightly from 0.4%. Note, however, that spending on essential items was up 0.8% over the March quarter while spending on discretionary items rose by a much more muted 0.1%. The Bureau noted that the rise in essential expenditure was largely driven by an 11.7% increase in spending on electricity, gas and other fuels as government energy rebates expired.
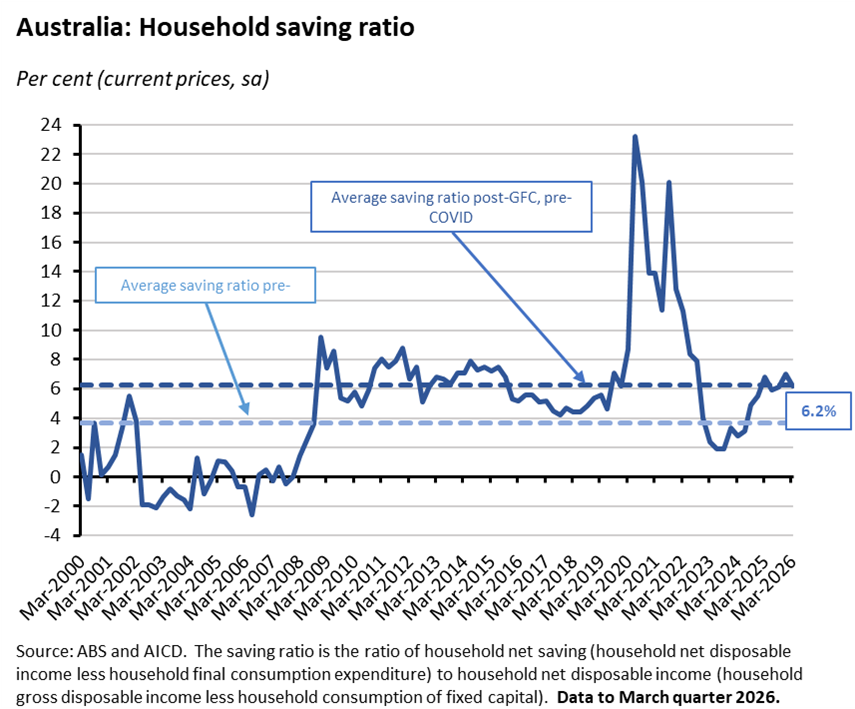
Note also that growth in nominal gross household disposable income was just 0.4% over the quarter. That was less than the 1.1% increase in nominal household consumption. As a result, the household saving ratio fell to 6.2% in the March quarter from 7% in the December quarter.
That shift in the funding of electricity bills was also apparent in the numbers for government consumption, which fell 0.2% over the quarter as state energy bill relief payments expired. This was the weakest result since the September quarter 2022 and largely offset a growth impact from public investment spending (see below), leaving public final demand making no significant net contribution to quarterly growth.
The main growth story last quarter was an increase in private business investment which was up a strong 6% over the quarter and 10.5% over the year, contributing 0.7 percentage points to quarterly growth. Non-mining investment was up 7.7% quarter-on-quarter and 15.1% year-on-year, while mining investment rose by just 0.3% in quarterly terms and fell 3.8% on an annual basis.
Private business investment in the March quarter was powered by machinery and equipment capex, which jumped 16.3% over the quarter and 23.9% over the year. According to the Bureau, the former was the largest quarterly rise in 30 years and mainly reflected spending on data centres in New South Wales and Victoria. The Bureau also said that a significant share of this lift to growth was offset by the associated increase in imports of capital goods, evident in the drag from net trade.
Aside from data centre capex, other investment was more muted: dwelling investment was up 0.7% over the quarter and 3.5% over the year and not large enough to make a significant growth contribution; ownership transfer costs fell 4.1% over the quarter and subtracted 0.1% from quarterly growth; non-dwelling construction edged down by 0.1% over the quarter and again had little impact on aggregate growth; and finally, public investment (led by a mix of defence spending plus state and local government transport and health projects) rose 0.9% quarter-on-quarter and 1.1% year-on-year and contributed an additional 0.1 percentage point to quarterly growth.
As already noted, net trade was a growth headwind last quarter. Exports were down 1.1% – their biggest quarterly drop in two years – as adverse weather disrupted shipments of coal and iron ore while elsewhere lower student numbers meant fewer services exports. Imports were up 2.1%, led by surging imports of capital goods due to record imports of automatic data processing equipment (think server racks for data centres).
Add in the impact of price changes, and nominal GDP grew by 0.6% over the quarter and rose 5.3% on an annual basis. The GDP implicit price deflator rose 0.3% over the quarter and 2.7% over the year, while Australia’s terms of trade were up 1.1% quarter-on-quarter and 0.2% higher year-on-year.
A mixed story on productivity and unit labour costs
As already mentioned, at 2.5% real GDP growth is running above the RBA’s 2025-downgraded estimate for potential growth of around 2%. That downgrade reflected pessimism (realism?) about Australia’s productivity performance, with the central bank suggesting that, at least in the near term, the new normal was annual labour productivity growth of just 0.7%.
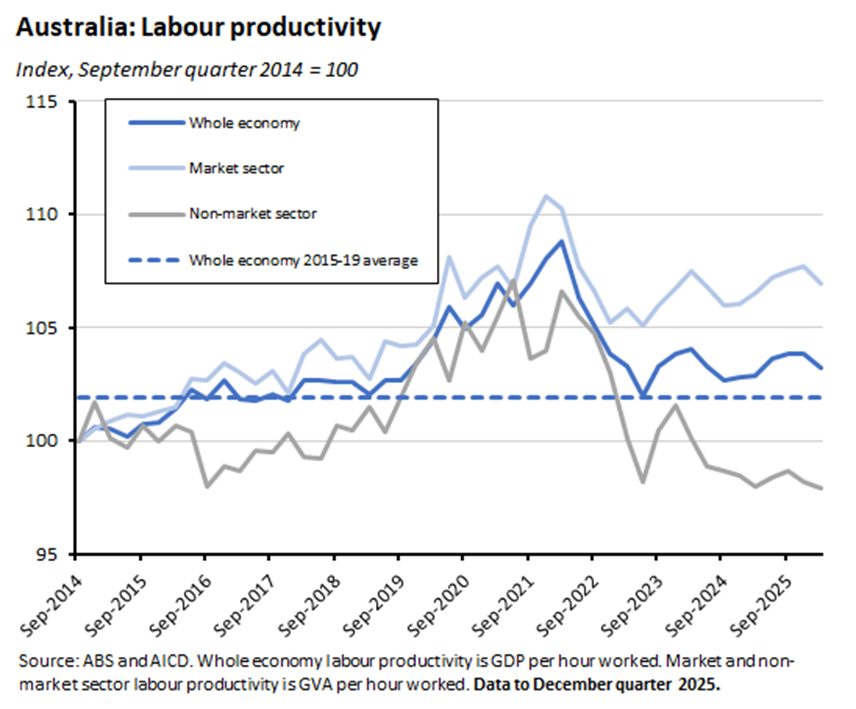
In this context, the immediate message of the March quarter numbers was not encouraging. Labour productivity as measured by GDP per hour worked fell 0.6% over the quarter and was up just 0.3% on an annual basis. The productivity performance of the market sector was also lacklustre, falling 0.7% over the quarter and growing 0.4% year-on-year.
In the previous two sets of national accounts numbers, annual labour productivity growth ran at a rate of around 1%. While noting the volatility of the quarterly data, we’d expressed some cautious optimism that this could indicate that Australia’s recent poor productivity performance may have bottomed out. Originally, we had suggested two possible reasons for that hope. First, that a lift in economic growth could provide a procyclical bump to productivity. And second, that rising business investment could deliver better productivity outcomes in the future.
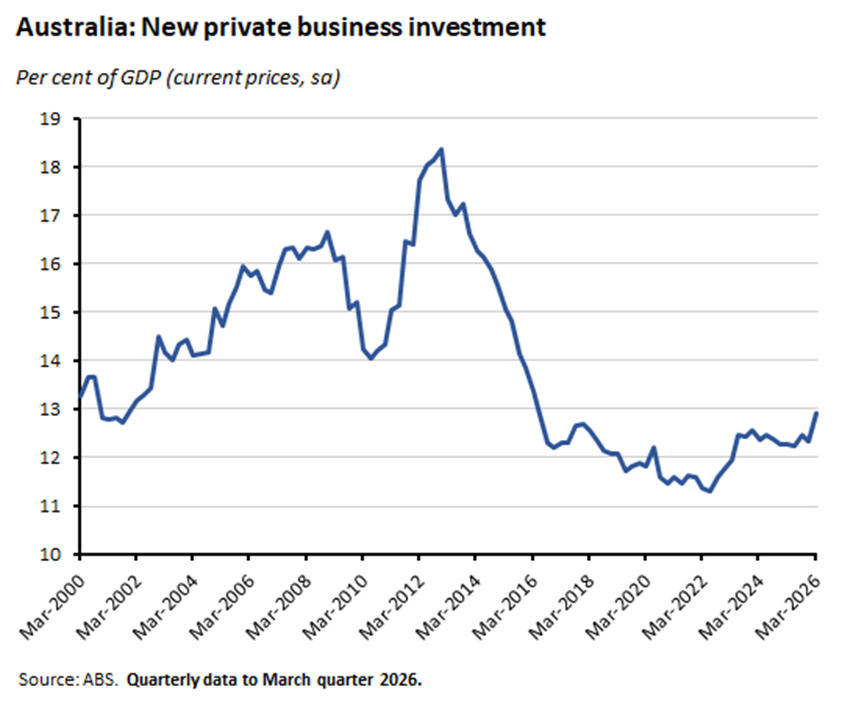
This quarter’s numbers together with the consequences of the war in the Middle East, the associated energy shock, and the RBA’s efforts to slow growth and thereby squeeze inflation all signal that economic growth will slow, not increase, over coming quarters. So, farewell procyclical productivity bump. On the other hand, the March national accounts confirmed that the recent uplift in business investment has been sustained and even gathered pace. New private business investment as a share of nominal GDP has now risen to almost 13%, marking its highest share since mid-2016. Assuming that all this data centre capex is translated into productivity-enhancing AI and related activities, then this should (eventually) be positive for future productivity growth, which in turn should help lift the speed limit for the Australian economy.
Sticking with the theme of speed limits, the March quarter GDP numbers reported that annual wage growth as measured by (non-farm) average earnings per employee slowed from 4% in the December quarter to 3.5% last quarter. With labour productivity growth running at 0.3%, this means that growth in nominal unit labour costs was 3.2% over the year, little changed from the previous quarter’s 3.1% rate.
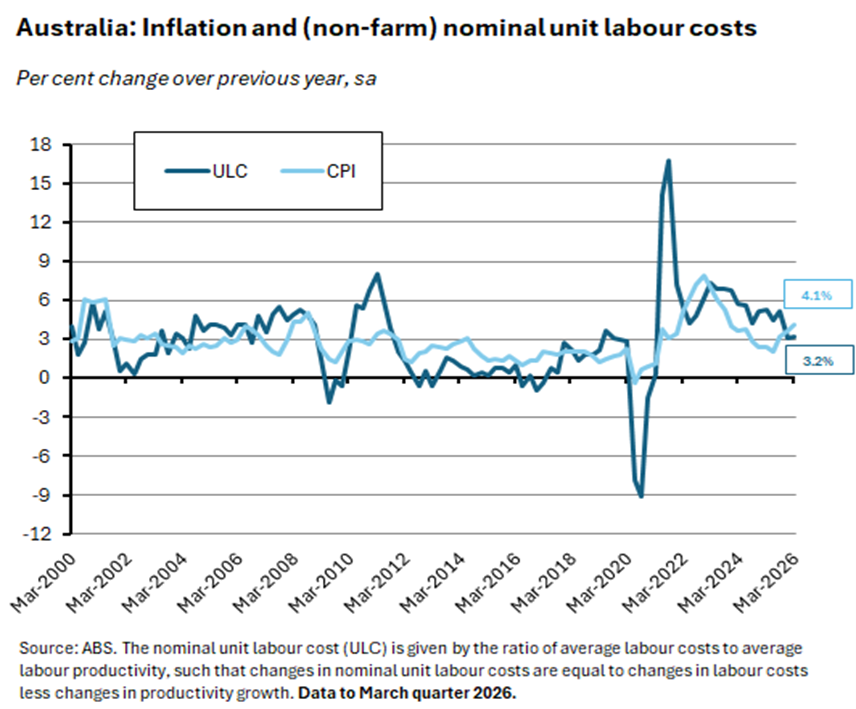
Readers may recall that the RBA reckons that a sustainable rate of medium wage growth based on this national accounts’ measure is around 3.2% (equal to at-target inflation of 2.5% plus 0.7% labour productivity growth). On this basis, current wage growth is still too high and productivity growth too low. Still, the last two quarters of unit labour cost growth have moderated significantly relative to recent years.
Other Australian data points to note
According to the ABS population clock, Australia’s population now exceeds 28 million.
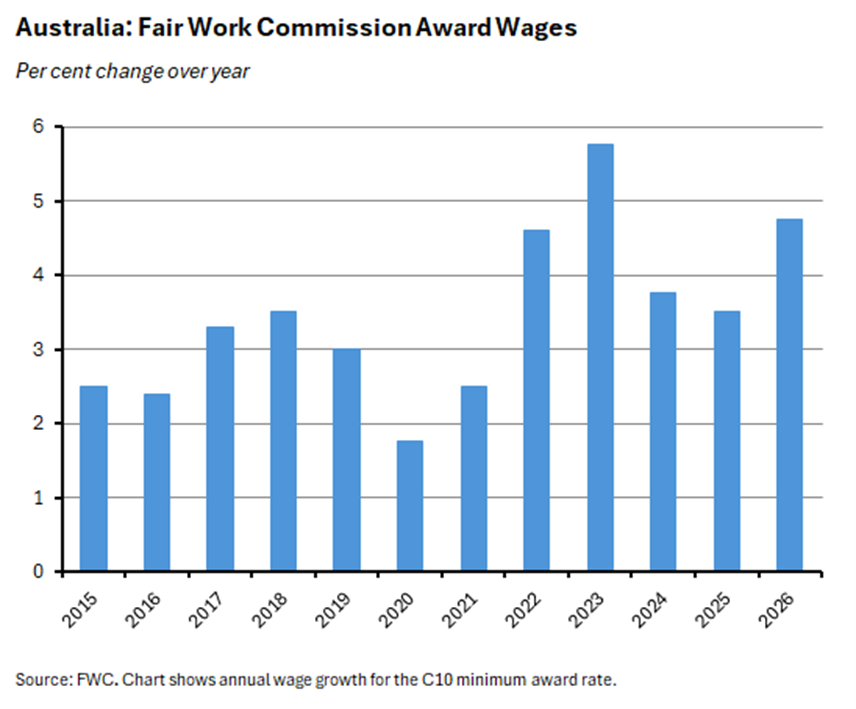
The Fair Work Commission (FWC)’s Annual Wage Review 2026 decision has been announced. The FWC said that it would increase modern award rates by 4.75% with effect from 1 July 2026. The National Minimum Wage will be increased to $1,004.90/week or $26.44/hour with effect from the same date. Regarding modern award wages, the FWC also said that it would make some structural changes at the lowest wage levels. The Commission estimates that while the National Minimum Wage only applies to a ‘negligible’ fraction of the workforce (perhaps 100,000 people), modern awards cover around 22.1% of all employees in Australia, or about 2.8 million people. That said, because most of this award-reliant workforce is both part-time and low paid, its share of the national wage bill is much lower, at around 11.2%. The FWC reckons that each percentage point increase to modern award rates in response to the Review directly increases the Wage Price Index (WPI) by about 0.1 percentage point. The Commission also acknowledged that the determination of this year’s Review had been ‘particularly challenging because of the unusual degree of complexity in the interaction of the matters we are required to take into account’ including above-forecast inflation, tighter monetary policy from the RBA, and war in the Middle East. It also noted that most award-reliant employees were still receiving real wages lower than their July 2021 levels, and with the RBA projecting a headline inflation rate of 4.8% in the June quarter of this year, a wage increase of ‘well over’ 5% would have been needed to close the gap.
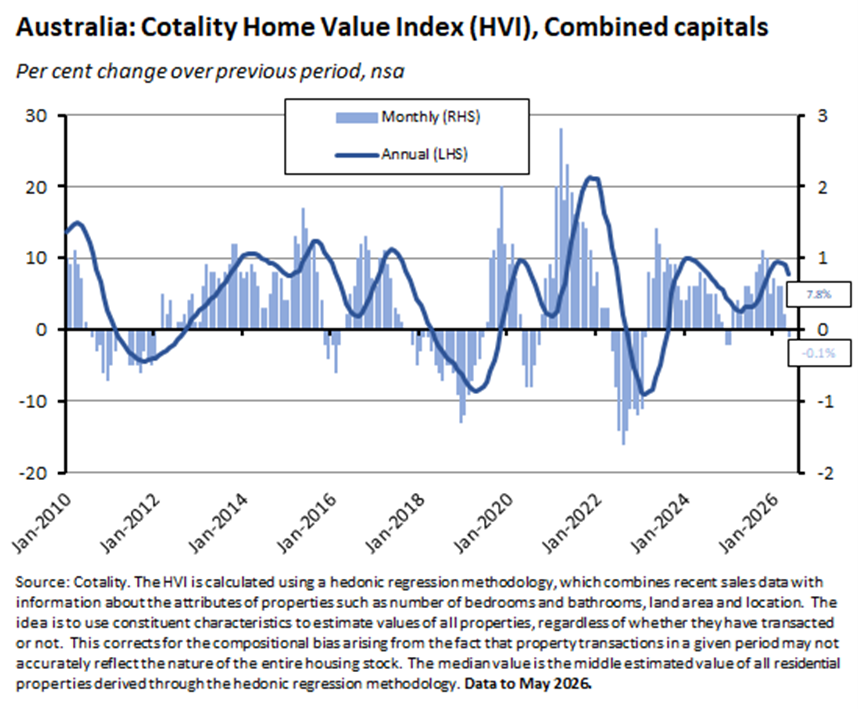
Cotality’s National Home Value Index was unchanged over the month in May 2026, albeit still up 8.8% on an annual basis. The Combined Capitals index fell 0.1% over the month (up 7.8% over the year) with the drop led by monthly declines of 0.9% in Sydney and 0.8% in Melbourne. Prices also fell in Canberra, and while home values continued to rise in the other capitals, the pace of growth has slowed. Alongside these weaker price signals, several demand indicators also continued to soften, with the estimated number of national home sales over the past three months running 2.2% below last year’s rate and 4.1% below the five-year average. Cotality said that while the softness in the Australian housing market has been building for some time due to serviceability and affordability constraints, more recent headwinds include higher interest rates from the RBA, tax changes in the Budget, and the war in the Gulf. Rents were up 0.6% in May – the same growth rate as recorded in April this year – but down from the 0.7% growth seen during the March quarter. The national vacancy rate fell to just 1.5% in May, which is in line with the record lows seen in 2022 and 2023, and this is maintaining upward pressure on rents. At the same time, however, Cotality estimates that renters are now dedicating around a third of their pre-tax income to rental payments – a share which it thinks may mean renters are now approaching a ceiling on how much they can pay.
The ABS reported that the total number of dwellings approved in April 2026 fell 3.4% over the month (seasonally adjusted) to 16,710. That was 10.2% higher than April 2025 approvals. Within that total, approvals for private sector houses (10,088) were down 1% over the month but up 7% over the year while approvals for private sector dwellings excluding houses (6,403) were down 3.6% on March 2026 and up 20.5% on April last year. The Bureau noted that despite their monthly fall, approvals for private sector homes have now exceeded 10,000 for three consecutive months for the first time since the final three months of 2021.
According to new balance of payments data from the ABS, in the March quarter of this year Australia ran its first quarterly trade deficit since the December quarter 2017. The Bureau reckoned that the trade deficit of $2.4 billion was largely the product of a fall in mining exports (due to lower iron ore prices plus lower volumes of iron ore and coal exports as a result of the disruption caused by cyclones Koji and Mitchell) running into increased imports of data centre equipment (such as AI server racks) and of fuels (reflecting higher prices created by the war in the Persian Gulf). Largely as a result, Australia’s current account deficit increased from $23 billion in the December quarter of last year to $27.1 billion in the first quarter of this year.
Australia’s seasonally adjusted goods trade balance rose to a surplus of $1.8 billion in April 2026 (seasonally adjusted). That was up about $2.8 billion from the March monthly deficit of $1 billion and largely reflected a $3.2 billion (7.2%) jump in exports of metal ores and minerals.
ANZ-Indeed Job Ads rose 1.8% month-on-month (seasonally adjusted) in May 2026 to be 2% higher over the year. May’s uptick in job ads follows two consecutive monthly declines but still leaves the index 2% below the 2026 high reached in February this year.
ABS Business Indicators for the March quarter 2026 reported that company gross operating profits fell 1.3% over the quarter (seasonally adjusted) but were up 3.2% over the year. The ABS said the quarterly drop was driven by a 9.1% decline in mining profits, along with a large 9.6% fall for financial and insurance services. In contrast, gross operating profits were up 7.9% in the construction industry. Wages and salaries rose 1.2% quarter-on-quarter and grew 5.5% year-on-year.
ABS Government Finance Statistics for the March quarter 2026 reported a general government net operating deficit of $0.4 billion. That compares to a $1.8 billion deficit in the December quarter 2025 as a 4.5% fall in taxation revenue (and a 3.5% drop in overall revenue) was more than offset by a 4% decline in total expenses. General government net borrowing fell from around $17 billion in the December quarter 2025 to $12.7 billion in the March quarter 2026.
Further reading and listening
- RBA Governor Michele Bullock’s opening statement to the Senate Economics Legislation Committee.
- Related, MPB member Ian Harper gave a speech on Economic conditions and the outlook.
- A new Grattan Institute report on managing the decline of gas in Australia.
- The e61 institute looks at changes to Australia’s migration system.
- The AFR on how batteries transformed Australia’s power grid.
- Secretary to the Treasury Jenny Wilkinson’s much-discussed post-Budget address to the Australian Business Economists. In defence of Budget 2026’s contentious tax reform measures, Wilkinson reckons that since 2000, the combination of existing capital gains tax, negative gearing and trust arrangements delivered more than $700,000 of benefits to the top 1% of lifetime income earners over their working lives compared to benefits of around $10,000 for the median income earner. She also cited e61 Institute work that found for individuals with incomes above $190,000, the relationship between effective tax rates and income breaks down, such that around 10% of income earners with incomes above $300,000 face an average tax rate closer to that of wage and salary earners earning around $50,000. Wilkinson also referenced OECD research suggesting the absence of clear evidence to support the favourable treatment of capital gains to promote investment beyond compensating for inflation – an argument that has since received some pushback.
- Related, the Secretary to the Treasury’s opening statement to the Economics Legislation Committee.
- On testamentary trusts after Budget 2026: ‘The real test of the reform will be whether it can curb tax-driven income splitting without collateral damage to the legitimate protective and succession-planning purposes for which testamentary trusts are often used.’
- An ABS article on the economic data implications of the illicit tobacco market.
- The OECD has published its 2026 Economic Outlook. According to the OECD, ‘the conflict in the Middle East has become the dominant force shaping the global economic outlook.’ The Outlook presents two scenarios: a time-limited disruption scenario (under which energy prices gradually ease from mid-year onwards) and a prolonged disruption scenario (under which the disruption to energy markets persists well into 2027). In the former, global economic growth is forecast to slow from 3.4% last year to 2.8% this year and then recover to 3.1% in 2027. Under the latter the hit to activity is larger, with global growth forecast to fall to 2.1% this year and just 1.8% next year, pushing some economies into or close to recession. The OECD’s projections for Australia have GDP growth projected to slow slightly from 2% last year to 1.9% this year and then down again to 1.8% in 2027. The global energy price spike is projected to push Australia’s headline inflation rate to 4.4% this year, before falling back to about 2.5% in 2027. The unemployment rate is forecast to rise from 4.5% this year to 4.6% next year.
- Greg Ip examines the record divide between US corporate profits and worker pay, which he reckons explains why US public opinion surveys are down even while the stock market is up, and also why the Pope is now worrying aloud about profits, jobs and AI.
- Related, on the transatlantic divide in the labour share of income.
- Interesting debate on US vs European productivity and living standards. Paul Krugman argued a little while back that Europe was doing better than the conventional wisdom suggests, and that the most widely used comparisons of productivity growth were a poor guide to US vs European performance. That prompted a response from economists Philippe Aghion, Antonin Bergeaud and Luis Garciano suggesting that, contra Krugman, using the right metric showed that US outperformance vs Europe was not only present but also increasing. Now Krugman has responded in turn prompting another reply from Aghion et al.
- From the Economist, are Japan, South Korea and Taiwan suffering ‘industrial rot’, whereby booming AI-related exports hide stagnating non-AI industries?
- Also from the Economist, the dangers and temptations of centrists crying ‘Wolf’.
- The BIS says real global house prices have trended downwards over the past four years (with rough stability in advanced economies as a group offset by falling real prices in emerging markets).
- The FT’s Martin Wolf offers a guide for the perplexed on AI.
- Empire suicide watch?
- The Joe Walker podcast interviews Productivity Commission Chair Danielle Wood on what transformative AI could mean for Australia.
- The Bloomberg Australia podcast looks at lessons for Australia from New Zealand’s property slump.
- The FT’s Unhedged podcast considers the wave of tech-related stocks about the hit the US equity market.
- The Odd Lots podcast delves into the relationship between the invention of rope and modern civilisation.
- The Past Present Future podcast explores Aldous Huxley’s Brave New World and its ‘eerily prophetic’ view of 21st century consumer culture.
Latest news
Already a member?
Login to view this content