Payroll jobs fell by one per cent over the month to 8 August, with jobs in Victoria dropping by 2.8 per cent. Private capital expenditure in the June quarter suffered its largest quarterly fall since 2016. The value of construction work done also fell over the quarter. Consumer confidence rose for a second successive week. Preliminary data on merchandise trade showed goods exports down and goods imports up, while preliminary data on retail sales showed another strong monthly rise.
This week’s readings include the latest business survey from the ABS, new RBA research on the risks of household debt, revisions to the PBO’s medium-term net debt projections, the state of Australia’s states, the future of global value chains and the flattening of the Phillips curve.
What I’ve been following in Australia . . .
What happened:
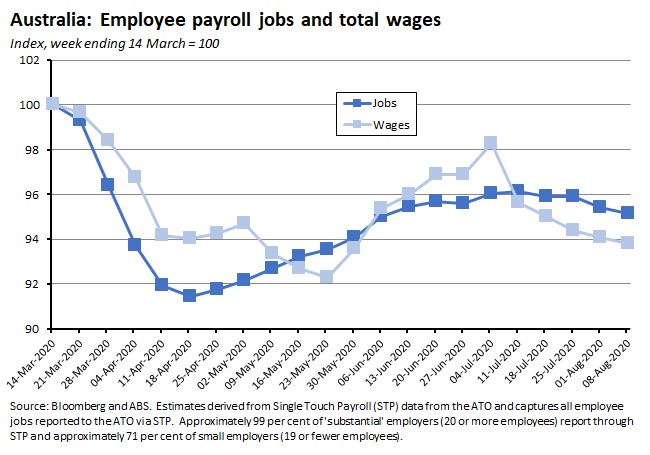
The ABS said that between the week ending 14 March 2020 (the week Australia recorded its 100th confirmed COVID-19 case) and the week ending 8 August 2020, the total number of payroll jobs fell by 4.9 per cent while total wages fell by 6.2 per cent. Payroll jobs fell by one per cent over the month to 8 August, and over the two weeks between 25 July and 8 August, payroll jobs were down 0.8 per cent and wages were down 0.6 per cent.
By state, the largest declines in payroll jobs since the week ending 14 March have been in Victoria (down 7.8 per cent), the ACT (down 5.5 per cent), Tasmania (down five per cent) and New South Wales (down 4.4 per cent). The smallest declines have been in Western Australia (down two per cent) and the NT (down 2.6 per cent).
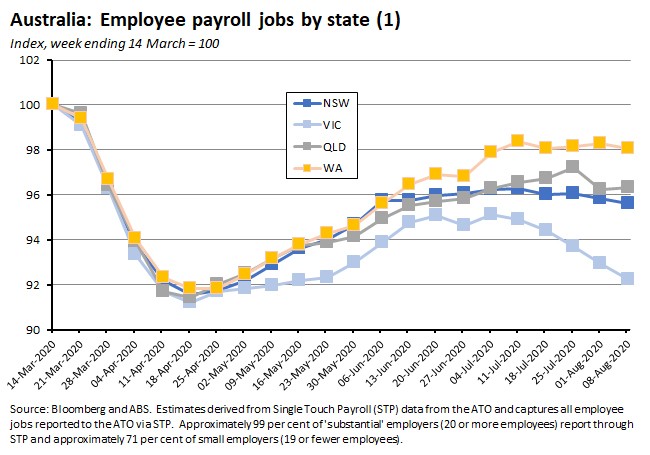
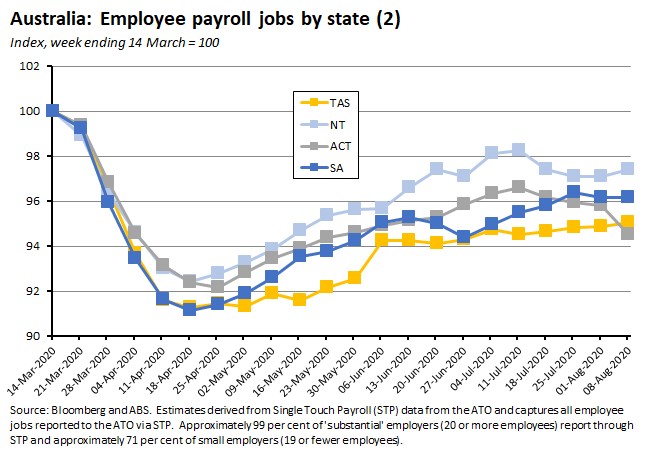
Over the past two weeks, from the week ending 25 July, jobs have fallen in Victoria (down 1.6 per cent), the ACT (down 1.5 per cent), Queensland (down 0.9 per cent) and New South Wales (down 0.4 per cent) along with very small declines in South Australia and Western Australia. Only Tasmania and the NT enjoyed a rise in job numbers over the most recent data period.
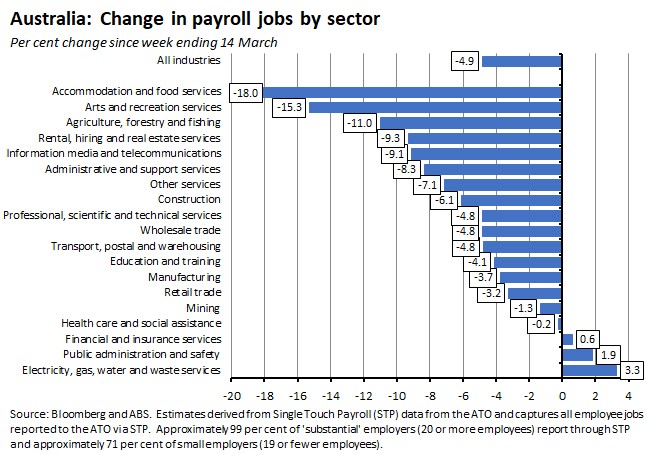
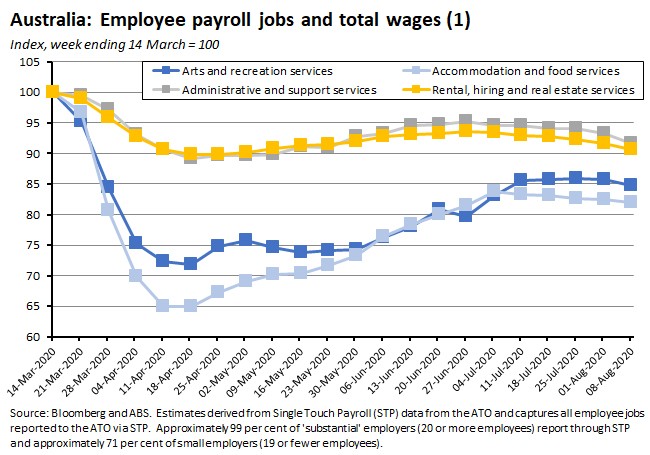
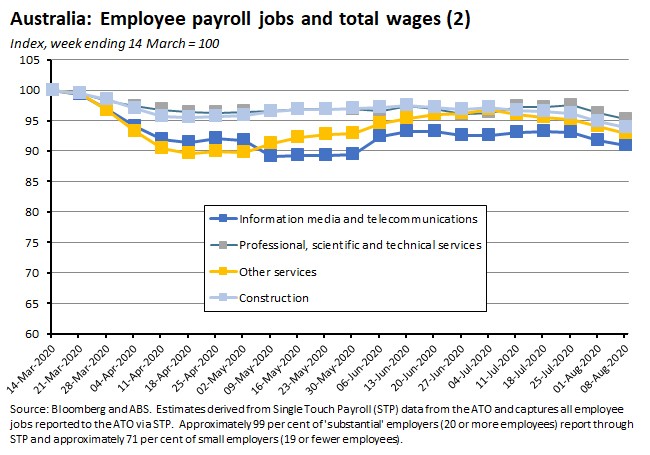
By industry, the biggest falls in jobs over the period since 14 March continue to be in accommodation and food services (down 18 per cent) and arts and recreation services (down 15.3 per cent), followed by agriculture, forestry and fishing and rental, hiring and real estate services.
Why it matters:
There are two main messages from this week’s payroll numbers (subject to the usual caveats about this being a new, experimental and non-seasonally adjusted series that is subject to large revisions).
First, the impact on the Victorian labour market from the shift to tighter restrictions is making itself felt in the data. With stage 4 restrictions in metropolitan Melbourne and stage 3 restrictions in regional Victoria from 5 August, this latest set of data captures the very early days of the new measures, along with the impact of the previous restrictions and the rise in the number of COVID-19 case. The ABS reported that over the month to the week ending 8 August, payroll jobs fell by 2.8 per cent in Victoria. As a result, while around 39 per cent of jobs lost in Victoria by mid-April had been recovered by 27 June, by early August, the share of recovered jobs had fallen back to just 12 per cent.
Second, the national figures continue to tell the story we first identified over a month ago: after an initial period of job recovery between mid-April and mid-June, labour market momentum has slowed markedly. Since then, payroll job numbers have remained stuck between four and five per cent below their mid-March levels.
Finally, the Bureau again provided some additional insights into the differential impact on primary and secondary jobs. (Remember, the number of payroll jobs is not the same as the number of employed people for a range of reasons, including the phenomenon of multiple job holding. Prior to COVID-19, the ABS estimated that around six per cent of employed people worked multiple jobs. And as of the March quarter of this year, it reckoned that around 93 per cent of jobs in the labour market were ‘main jobs’ and around seven per cent of jobs were ‘secondary jobs’ – that is, other jobs worked concurrently by multiple job holders). As noted above, the ABS estimates that the number of payroll jobs in the week ending 8 August was 4.9 per cent lower than the week ending 14 March 2020. Over that period, main jobs fell by 3.6 per cent compared to a 25.7 per cent slump in the number of secondary jobs. Secondary jobs accounted for around 30 per cent of all payroll jobs lost, and as a result the share of secondary jobs in total jobs has fallen from 5.9 per cent at the start of this period to 4.6 per cent as of the week ending 8 August. The ABS also notes that this diverging trend between primary and secondary jobs tells us something about the role of JobKeeper in securing jobs, since the program only covers a single job for an eligible employee and therefore supports main jobs to a greater extent than secondary jobs.
What happened:
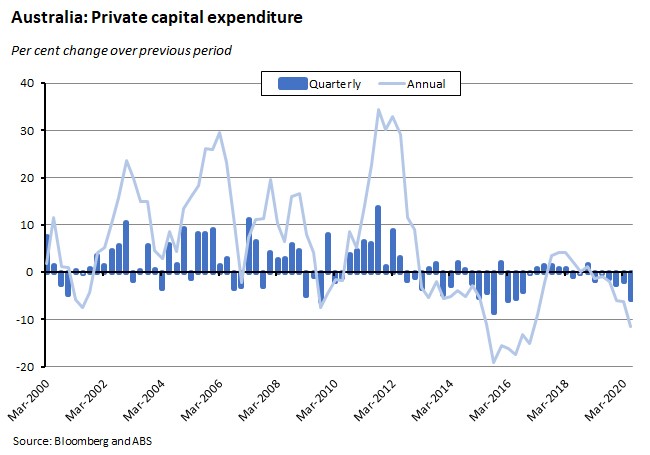
According to the ABS, the volume of private new capital expenditure in the June quarter fell 5.9 per cent in quarterly terms (seasonally adjusted) and dropped 11.5 per cent relative to June 2019. Spending on buildings and structures fell 4.4 per cent over the quarter and 9.4 per cent over the year, while expenditure on equipment, plant and machinery was down 7.6 per cent relative to the March quarter and down 13.8 per cent relative to Q2:2019.
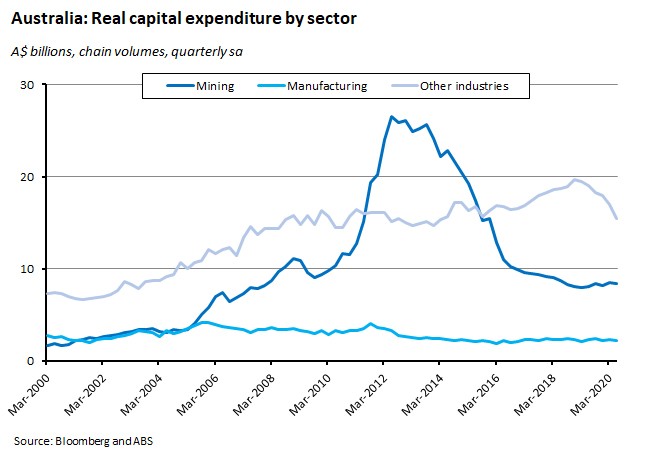
By sector, mining capex fell 1.2 per cent over the quarter, but was up 3.9 per cent over the year, manufacturing was down 4.5 per cent in quarterly terms and down seven per cent in annual terms, and investment in other selected industries declined 8.4 per cent over the quarter and slumped 18.6 per cent over the year.
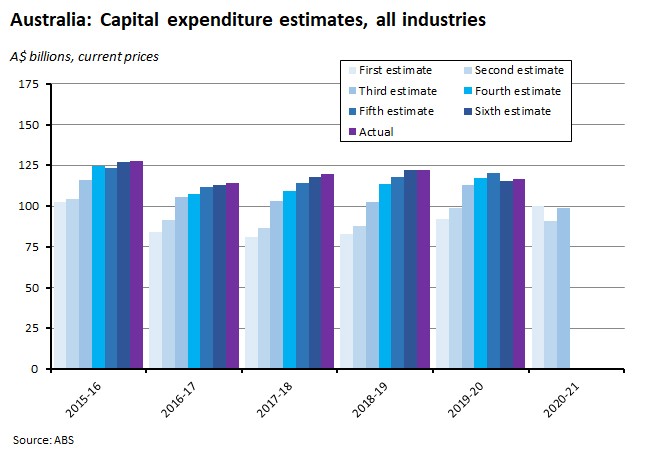
The ABS also reported the third estimate for expected capital investment in 2020-21. At $98.6 billion, this was 8.9 per cent higher than the previous estimate, but about one per cent below the first estimate (which was based on January-February data and therefore largely pre-dated COVID-19). It was also more than 12 per cent below the third estimate for 2019-20.
Why it matters:
While the 5.9 per cent quarterly fall in private investment in the second quarter was the largest decline registered for several years, it was not as steep as consensus predictions of an 8.2 per cent drop, mainly because relative resilience in mining investment offset sizeable falls in capex in manufacturing and other industries. Even so, the double-digit pace of annual decline in investment spending confirms the toll that low demand and high uncertainty are taking on investment intentions, with the 18.6 per cent plunge in investment in other industries (which captures developments in services sectors) reinforcing that message.
Unsurprisingly, the reported outlook for capital spending is also weak: while the third estimate was up from the extremely weak second estimate it was still below the pre-COVID first estimate and well below the corresponding figure from last year. That’s because not only are firms faced with high short-term uncertainties around weak demand, business restrictions and the future trajectory of the virus, but also with big longer-term uncertainties around the shifting structure of the economy and the nature of viable business models post-pandemic.
What happened:
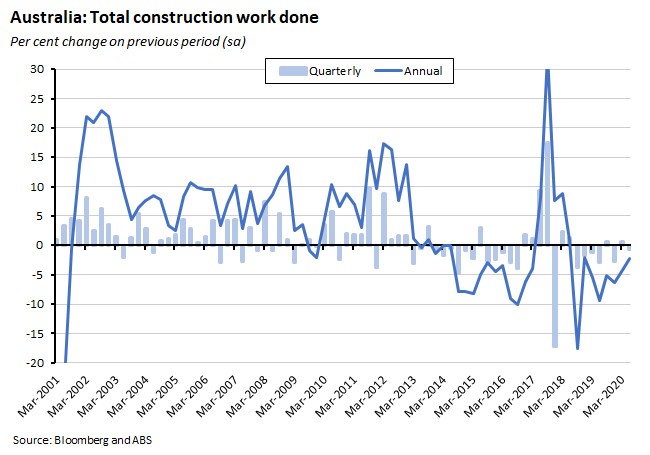
The value of total construction work done in the June quarter fell 0.7 per cent (seasonally adjusted) to be down 2.2 per cent over the year.
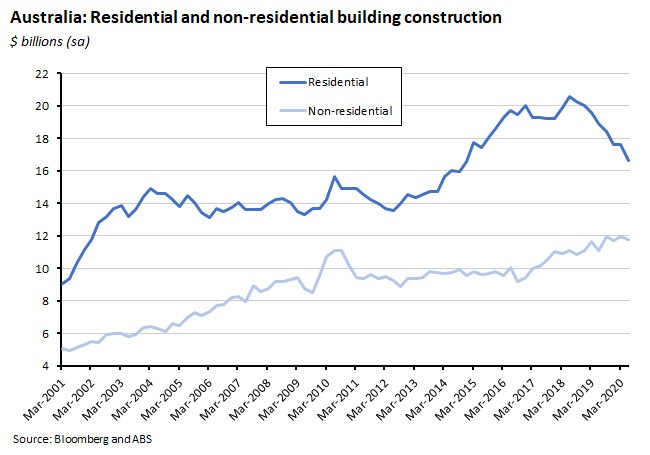
According to the ABS, total building work done fell 3.9 per cent over the quarter and 5.3 per cent over the year, with residential building construction down 5.5 per cent in quarterly terms and 12.1 per cent in annual terms. Non-residential building construction dropped 1.5 per cent over the quarter but was still 6.2 per cent higher than in the June 2019 quarter.
Engineering work done rose 3.8 per cent over the quarter and was 2.2 per cent higher than in the same period last year.
Why it matters:
At just 0.7 per cent, the quarterly fall in total construction work done was much less severe than had been expected – the market consensus had been for a seven per cent drop.
Looking ahead, the drop in residential construction work is consistent with an expected decline in dwelling investment in the second quarter and with forecasts of slowing population growth and declining house prices that decline seems likely to persist across the remainder of the year. Non-residential construction also faces some significant headwinds in the form of concerns about future demand for office and other commercial real estate, along with the uncertainty plaguing the tourism, hospitality and education sectors. Engineering construction, on the other hand, could be boosted by any additional ramp up in public sector infrastructure spending.
What happened:
The ANZ-Roy Morgan Consumer Confidence index rose 4.6 per cent to an index level of 92.
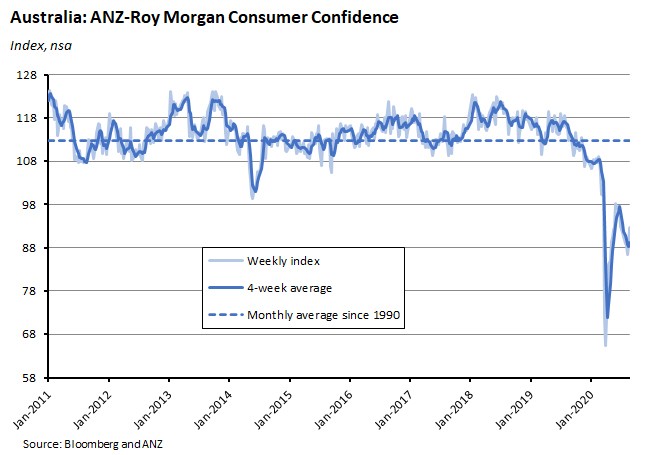
Notably, all five sub-indices (Current financial conditions, future financial conditions, Current economic conditions, future economic conditions and Time to buy a major household item) increased.
Why it matters:
This was a positive result: consumer confidence rose for a second successive week, enjoyed its biggest rise since the end of May, is now at its highest level since late June and all five sub-indices also improved. Better health news out of Victoria and New South Wales is supporting sentiment. All that said, the level of confidence remains about 19 per cent down on the same time period last year.
What happened:
The ABS reported preliminary data on Australia’s merchandise trade for July 2020. The early numbers show the value of goods exports down six per cent over the month and 18 per cent over the year, while the value of goods imports rose by 11 per cent over June’s result, but were still down two per cent relative to July 2019.
The main factors behind the fall in export values were a 12 per cent drop in exports of metalliferous ores, driven mainly by a nine per cent fall in iron ore exports, and a 36 per cent fall in the value of copper exports. (The ABS noted that both commodities had enjoyed record export values in the previous month.) By market, exports to China were down 17 per cent over the month, reflecting lower exports of iron ore, coal and petroleum.
On the import side of the trade balance, the increase in values was driven in part by a large rise in imports of road vehicles, which were up 49 per cent over the month after having recorded very low values in May and June. That jump still left imports of road vehicles 25 per cent lower in value than in July 2019.
The ABS also pointed to another big monthly increase in imports of textile yarn, fabrics and related products, with July representing a record value for these goods. The Bureau notes that the increase has been powered by imports of commodities associated with personal protective equipment (PPE), including face masks.
Why it matters:
The bounce in the value of imports, particularly of road vehicles, are consistent with the recovery in consumer spending in July (see also next story), while the drop in the value of exports to China warrants monitoring given recent developments in the bilateral relationship.
What happened:
According to the ABS, preliminary retail turnover for July rose 3.3 per cent over the month (seasonally adjusted) and 12.2 per cent over the year. (Based on preliminary data provided by businesses that make up approximately 80 per cent of total retail turnover and therefore subject to revision.)
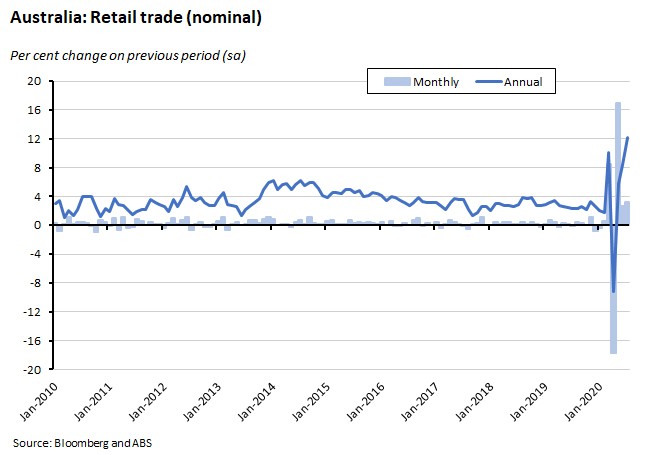
The ABS reported increases across all industries in July, with Household goods retailing (particularly furniture and white goods) leading the gains.
Monthly increases were also reported across all states and territories except Victoria, where sales shrank two per cent relative to June, with falls in clothing, footwear and personal accessory retailing, in cafes, restaurants and takeaway food services, and in department stores. The state did see an increase in food retailing, as spending increased in supermarkets.
Why it matters:
The preliminary result for July shows another strong monthly rise after a similarly robust increase in June. With the important exception of Victoria – where the spike in COVID-19 cases has weighed on activity – the growth in turnover is currently a story of continued strength in household goods retailing (which was up a hefty thirty per cent over the year) running alongside a recovery in spending in cafes, restaurants and takeaway food services, and in clothing, footwear and personal accessory retailing.
What happened:
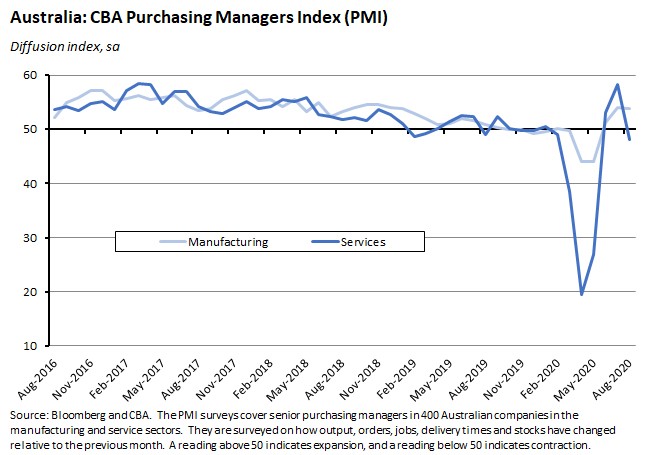
Last Friday, CBA released ‘flash’ estimates (pdf) for the August PMIs (flash indices are based on around 85 per cent of final survey responses and are intended to provide an advance indicator of the final indices). The composite index fell to a reading of 48.8 in August from 57.8 in July.
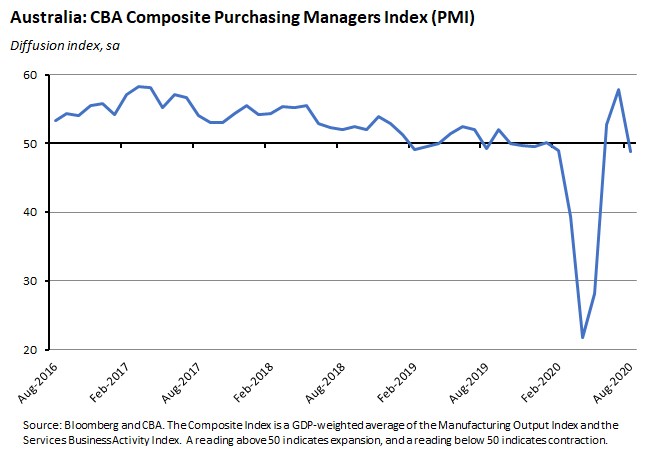
The slide back into negative territory was driven by a fall in the flash services PMI, which dropped to 48.1 in August from 58.2 in July. In contrast, the flash manufacturing PMI remained in positive territory, edging down to 53.9 from 54 last month.
Why it matters:
After spending June and July in positive territory, August’s composite PMI signals that private sector business activity contracted again in August. As noted above, the downturn was a services sector phenomenon, with the manufacturing PMI remaining in positive territory. Unfortunately, this month’s results were not surprising, likely reflecting the impact of intensified public health restrictions in Victoria. And as we already know, the adverse economic impacts of COVID-19 and the associated public sector health measures tend to be felt most heavily in the services sector.
What I’ve been reading:
The ABS released the latest in its series of surveys of the business impact of COVID-19. Key findings of this latest release include:
- More than a third of businesses said they expect it to be difficult or very difficult to meet financial commitments over the next three months.
- Small and medium sized businesses were almost twice as likely as large businesses to report they expect it to be difficult or very difficult to meet financial commitments over the next three months (35 per cent and 33 per cent compared to 18 per cent).
- Compared with three months ago, 23 per cent of businesses reported they had decreased or cancelled their actual or planned capital expenditure, 25 per cent said expenditure stayed the same, and 12 per cent reported expenditure had increased, while 37 per cent had no actual or planned expenditure on capital.
- Businesses said that their investment decisions were significantly influenced by uncertainty about the future state of the economy (59 per cent), future expected customer demand for their products or services (40 per cent), and other government support (36 per cent). That last category includes measures such as Boosting Cash Flow for Employers, Government backed-business loans, and Backing business investment – accelerated depreciation but excludes the instant asset write-off, which was treated as a separate factor.
Also from the ABS, additional calendar year data on international trade, including a breakdown of service trade by market.
The RBA has published a new research discussion paper looking at the riskiness of Australian household debt. The paper argues that much of the big build up in household indebtedness since 1988 is a product of fundamental developments including higher real incomes, a fall in nominal interest rates, financial liberalisation and household ownership of the rental stock. A model based on these factors does a good job of explaining the rise in debt between 1988 and 2014 but is less effective at explaining developments between 2014 and 2018, suggesting that other factors may have been at work in the later period. The paper also suggests that most of this debt is held by households that have significant equity backing their loans and that are relatively less likely to become unemployed in a downturn, which reduces the risks to the financial sector. The paper also notes that ‘an extreme but plausible scenario’ (which involves employment falling by eight per cent and housing prices falling by 40 per cent) could lead to a substantial fall in consumption, and that this risk has risen in line with the rising debt stock.
Two pieces on the economies of the states: ANZ’s Stateometer and NAB’s State Economic Handbook.
The AFR’s Jonathan Shapiro reports on the Australian Office of Financial Management's record $21 billion bond issue this week: the third time the AOFM has set a record this calendar year.
Last week, the Parliamentary Budget Office (PBO) published new estimates (pdf) of the impact of COVID-19 on the Federal government’s medium-term budgetary position. The PBO’s new numbers take into account the RBA’s latest forecasts and the government’s July Economic and Fiscal Update. The new baseline has net debt as a share of GDP around four percentage points higher than in its previous (June) estimates. The difference is mainly driven by adopting the Update’s assumptions around lower migration and the consequent hit to population growth.
The FT’s Robin Harding argues that now is not the time to worry about government debt.
Noted for future reference (the papers aren’t yet available online but eventually will be): the agenda for this week’s Jackson Hole Economic Symposium.
Greg Ip reckons views have evolved regarding the best approaches for tackling the pandemic while minimising the economic costs.
Stephen Roach analyses the US economic outlook and sets out the case for a double dip.
A great column from VoxEU that looks at urbanisation, globalisation, agglomeration and epidemics, noting that globalisation and the concentration of population in large cities have delivered substantial economic payoffs but has also fostered the conditions for the spread of COVID-19
A new McKinsey report examines the future of global value chains.
The latest in the Economist’s series on rethinking ideas and concepts in economics. This week, what’s behind the flattening of the Phillips Curve (that is, why do low levels of unemployment no longer seem to drive higher rates of inflation in the way that they used to)?
Tyler Cowen in conversation with Jason Furman (note that although this has just been published, the conversation itself took place back in January and so is an artefact of the pre-COVID era. Still worth a listen/read though, as Furman is one of the more interesting ‘big name’ next-generation economists).
Latest news
Already a member?
Login to view this content


