July’s labour market report delivered stronger employment growth, a lower unemployment rate and a higher participation rate than had been expected. But it also left more than one million Australians unemployed.
July’s labour market report delivered stronger employment growth, a lower unemployment rate and a higher participation rate than had been expected. But it also left more than one million Australians unemployed. Payroll data suggest that recent developments in Victoria will take the rate of joblessness higher but also paint a picture of a multi-speed labour market across the country. Wage growth has fallen to its lowest rate on record. Consumer confidence has slumped as fears mount about the medium-term outlook. Business conditions have improved but business confidence has tumbled. The RBA foresees a ‘slow and uneven’ recovery. New survey data from the ABS look at the utilisation of government stimulus payments to households.
This week’s readings include pre-COVID labour mobility in Australia, a look at Australian ‘born global’ businesses, the rise of tax and spend as the new economic orthodoxy, how COVID-19 is reshaping the future, why Zoom may be unable to substitute for business travel, how economists (sometimes) change their minds, and do pandemic-induced changes in our spending mean that we are now underestimating inflation?
What I’ve been following in Australia . . .
What happened:
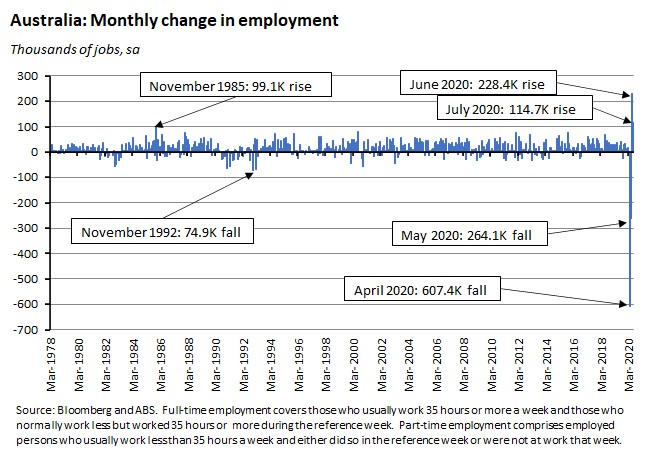
According to the ABS, the number of employed persons in Australia rose by 114,700 in July (seasonally adjusted).
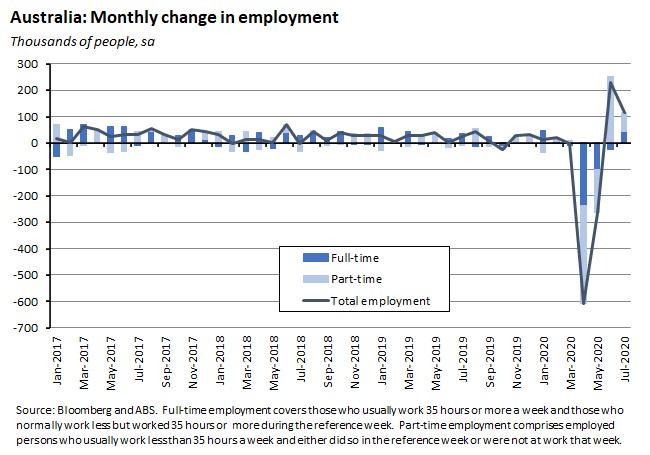
Full-time employment increased by 43,500 persons while part-time employment rose by 71,200 persons.
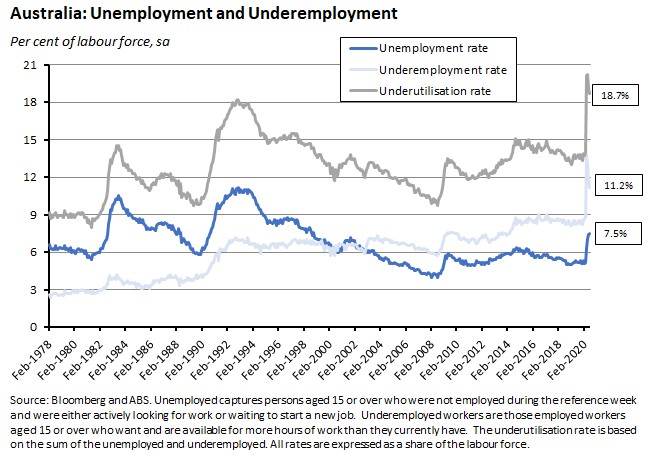
Although employment was up this month, so too was unemployment (due to another increase in the participation rate) as the unemployment rate edged up to 7.5 per cent in July from 7.4 per cent in June. There was better news on underemployment, which fell by 0.5 percentage points to 11.2 per cent as monthly hours worked increased by 1.3 per cent. As a result, the underutilisation rate fell 0.4 percentage points last month to 18.7 per cent.
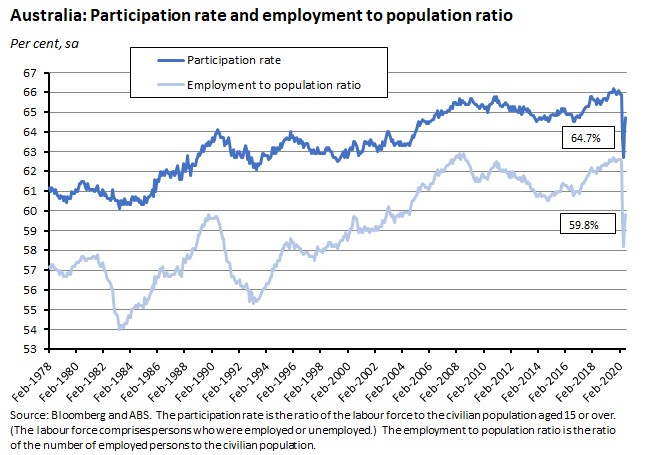
The participation rate increased by 0.6 percentage points to 64.7 per cent, while the employment to population ratio rose 0.5 percentage points to 59.8 per cent.
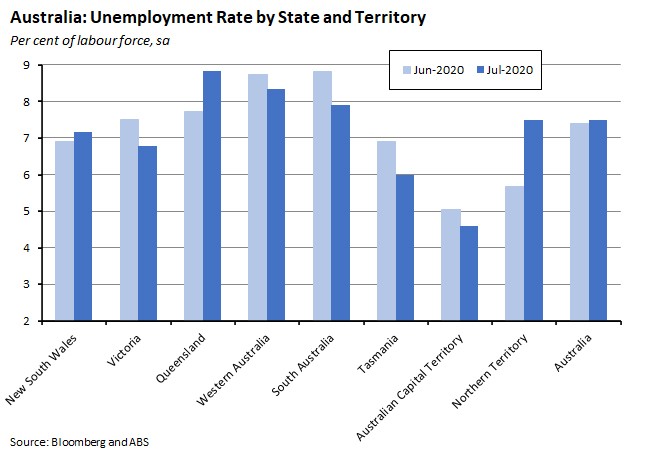
Unemployment rates fell in Tasmania and South Australia (down 0.9 percentage points in each case), in Victoria (down 0.7 percentage points), in the ACT (down 0.5 percentage points) and in Western Australia (down 0.4 percentage points). Elsewhere, there were increases, with the unemployment rate up 1.8 percentage points in the Northern Territory, up 1.1 percentage points in Queensland and up 0.3 percentage points in NSW.
Why it matters:
This was a somewhat disconcerting labour market report. On the one hand, it marked the first time that the number of unemployed Australians has exceeded one million.
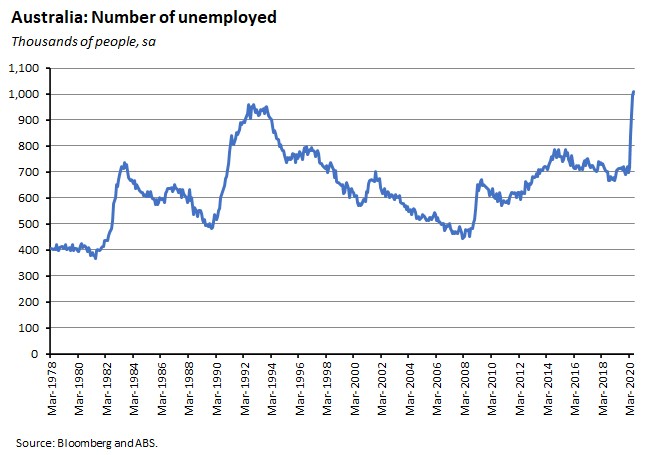
On the other hand, and despite this awful landmark, July’s labour market report turned out much better than expected. The consensus forecast had been for a 7.8 per cent unemployment rate, an employment gain of just 30,000 and an increase in the participation rate to 64.4 per cent. A glance back at the numbers above shows that the actual outcomes were superior in all three cases.
Moreover, unlike last month’s release when the rise in total employment masked a fall in full-time employment, July saw the economy add both full- and part-time jobs, although the gain in the latter was much larger. And there was also a rise in hours worked and a significant drop in the underemployment rate.
Unfortunately, there are also a couple of qualifications to this relatively good news.
First, the timing of the July report. The reference period for the underlying labour force survey ran from 28 June to 11 July. Stage three restrictions in Melbourne were only implemented on 8 July, so the reference period just caught the start of this phase of the lockdown. And the stage four restrictions for metropolitan Melbourne and stage three restrictions for regional Victoria only took effect from 5 August, so are not captured here at all. In this context, the latest payroll release (see the next story) offers a more recent assessment of the state of the labour market.
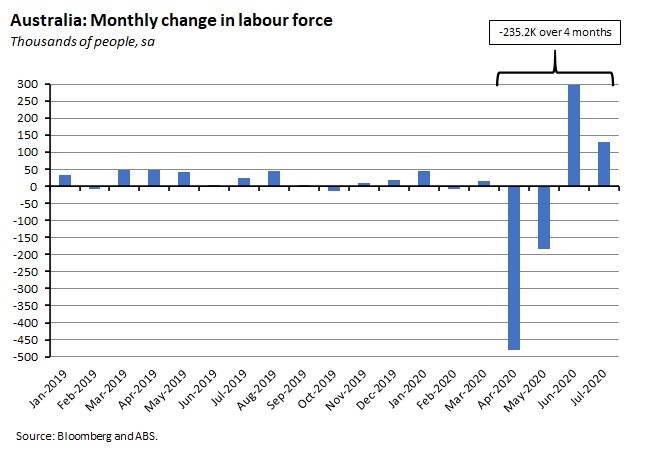
Second, as we’ve noted before, the official unemployment rate is only an imperfect guide to the true level of spare capacity in the labour market right now. Part of this is because of the impact of those who have exited the labour market during the COVID-19 crisis. Looking at the four months starting in April 2020, there has been a net outflow of more than 235,000 persons from the labour market. Add those people back in, and the unemployment rate would be around 9.1 per cent.
Then there is the impact of JobKeeper: there are almost 109,000 employed people currently working zero hours who told the ABS in July that they had 'no work, not enough work available or were stood down'. Add in those as well and the ‘effective’ unemployment rate – to use Treasury’s definition – would be around 10 per cent.
What happened:
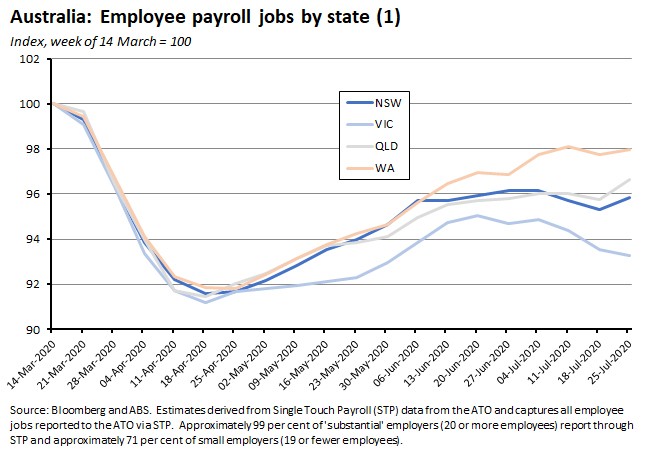
The ABS reported that between the week ending 14 March 2020 (the week Australia recorded its 100th confirmed COVID-19 case) and the week ending 25 July 2020 payroll jobs decreased by 4.5 per cent, while total wages decreased by 4.8 per cent. Over the most recent period of data, between the week ending 11 July and the week ending 25 July, jobs fell by 0.1 per cent while wages declined by 0.8 per cent.
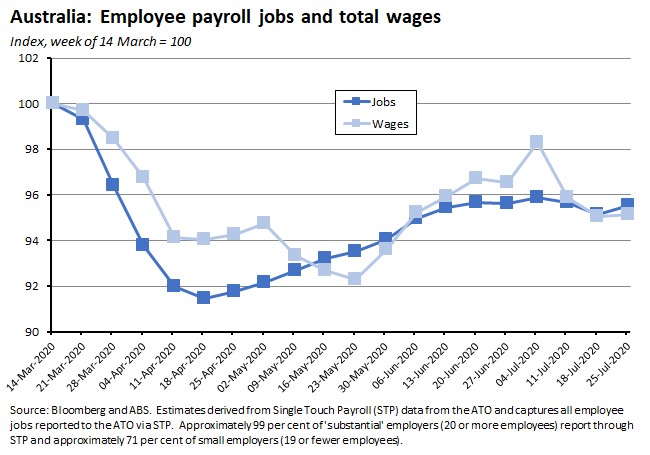
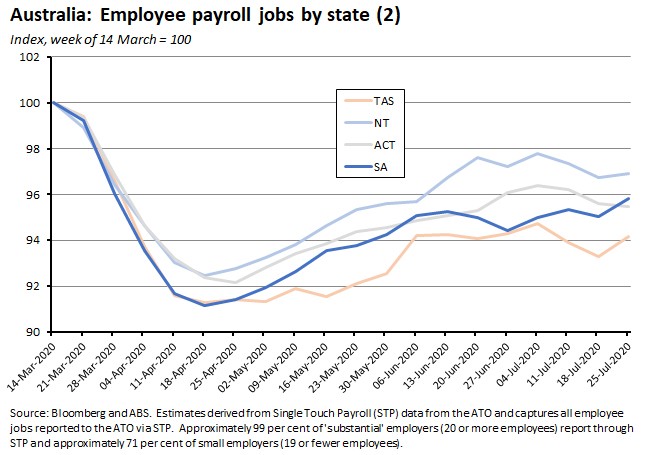
By state, the largest falls in payroll jobs since the week ending 14 March have been in Victoria (down 6.7 per cent) and Tasmania (down 5.8 per cent) while the smallest declines have been in Western Australia (down two per cent) and NT (down 3.1 per cent).
Over the most recent two weeks since the previous payroll data release, jobs increased in New South Wales, Queensland, South Australia and Tasmania but fell in Victoria, Western Australia, NT and ACT. The decline in Victoria (down 1.2 per cent since the week ending 11 July) was particularly pronounced, reflecting the start of stay at home restrictions for selected Melbourne postcodes on 1 July and the wider restrictions for metropolitan Melbourne and Mitchell Shire that took effect on 8 July (stage 4 restrictions in metropolitan Melbourne and stage 3 restrictions in regional Victoria commence commenced on 5 August and are therefore not yet captured in this data set).
The state-level data also show that Western Australia, Queensland and the NT have so far enjoyed the strongest overall labour market recoveries.
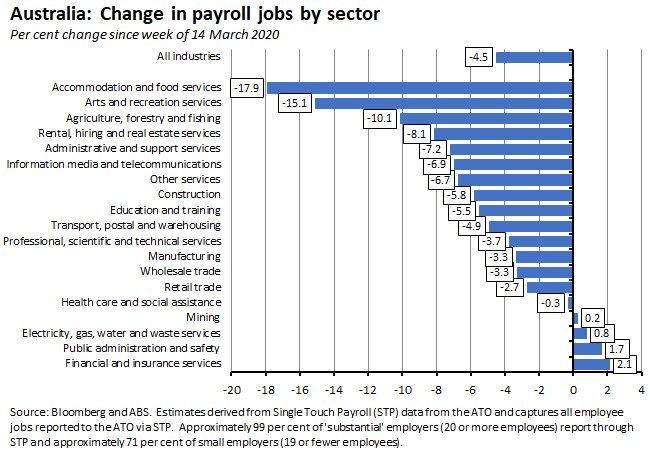
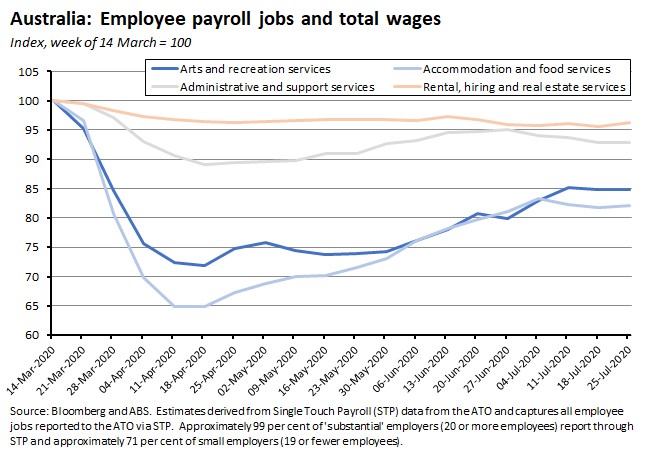
By industry, since the week ending 14 March 2020, the largest falls in payroll jobs are in accommodation and food services (down 17.9 per cent) and arts and recreation services (down 15.1 per cent).
Why it matters:
The previous payroll jobs release had suggested that the nationwide recovery in jobs had stalled around 20 June after which job numbers had started to decline again. This latest set of numbers tells a slightly different – and slightly more positive – story. It suggests that job numbers overall kept climbing until early July, but since then have largely gone sideways. That’s far from great news since it means we remain a long way off replacing the jobs lost during the first wave of the pandemic. But the signs of stabilisation in the national data are welcome after the previous two payroll data releases had told a story of renewed decline in job numbers.
Digging into the detail, the numbers also tell a story of multi-speed labour market adjustments across the states, with job creation picking up in several states over the most recent two weeks but this being offset by a marked decline in jobs in Victoria, and with Western Australia and Queensland out in front in terms of the overall level of recovery.
Finally, the revisions to the back data evident here also serve as a useful reminder about the volatility of this new, seasonally unadjusted data series.
What happened:
The ABS said that the seasonally adjusted Wage Price Index (WPI) rose by just 0.2 per cent in the June quarter 2020 to be up only 1.8 per cent over the year. Public sector wages rose 0.6 per cent over the quarter and 2.1 per cent over the year while private sector wage growth was just 0.1 per cent in quarterly terms and 1.7 per cent in annual terms.
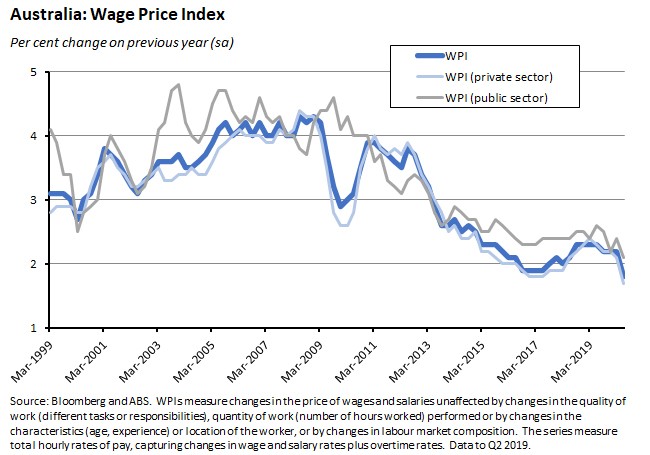
In original (that is, non-seasonally adjusted) terms, the WPI was flat over the June 2020 quarter as public sector wages growth (0.4 per cent over the quarter) offset a fall in private sector wages (down 0.1 per cent). The latter marked the first negative wages result in the history of the WPI.
By state, South Australia and Tasmania enjoyed the strongest annual pace of wage growth while Western Australia saw the weakest.
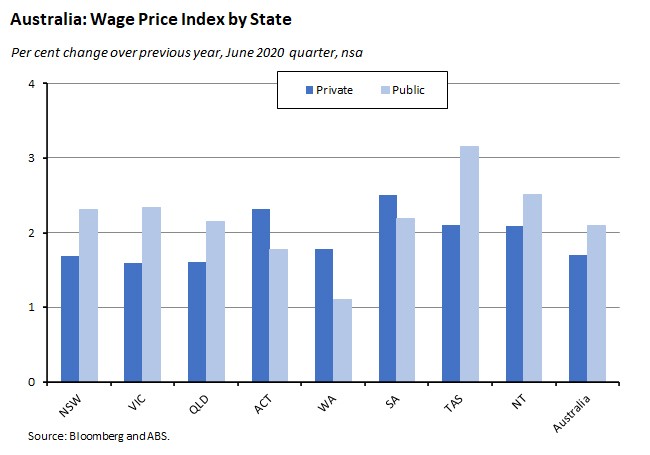
Note that the WPI measures changes in the price (that is, in the hourly wages and salaries paid) of a job, and not the occupant of that job. As such, JobKeeper payments to eligible employees fall out of the scope of the WPI. For more details, see here.
Why it matters:
Not only did the June quarter see the lowest quarterly rise in the WPI in the history of the series (which started in the September quarter of 1997) but it also brought the weakest rate of annual growth on record, coming in below the 1.9 per cent recorded in the June quarter of 2017.
Persistent labour market slack (high unemployment and underemployment) mean that wage growth is likely to remain subdued over the next couple of years, which all else equal would also indicate a future of depressed household incomes and weak consumption growth. This reinforces the importance of the government’s fiscal support, which to date has acted as a significant countervailing factor driving overall incomes (see stories below).
What happened:
The Westpac-Melbourne Institute Index of Consumer Sentiment slumped (pdf) 9.5 per cent to an index level of 79.5 in August.
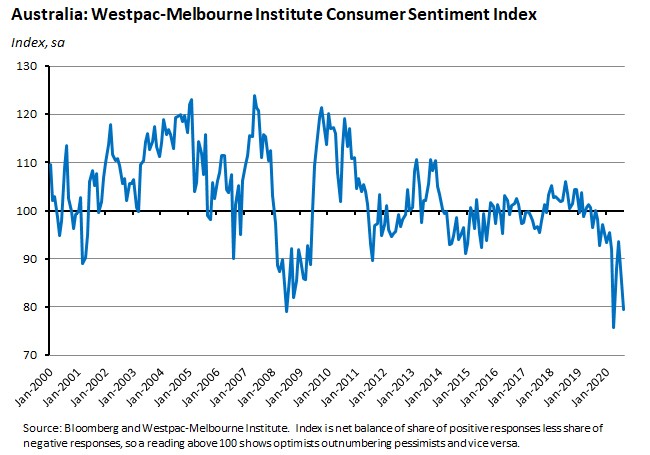
All five component indices recorded declines this month with the largest falls around expectations for the economy and assessments of ‘time to buy a major item’. The ‘economy, next 12 months’ sub-index recorded the biggest decline, crashing 19 per cent to be down over 30 per cent since June and taking this indicator to below the level it had fallen back in April. The ‘economy, next five years’ sub-index also suffered a large 8.7 per cent fall, following a 10.3 per cent decline last month. And the ‘time to buy a major item’ sub-index dropped by more than 13 per cent.
By state, the biggest fall in sentiment was in New South Wales, where the index plummeted by 15.5 per cent. Strikingly, that was a much larger decline than the 8.3 per cent fall in Victoria. Sentiment also fell in Queensland (down 8.1 per cent), South Australia (down 5.8 per cent) and Western Australia (a modest 1.5 per cent drop).
Other indicators of weakness this month included a 14.6 per cent jump in the Westpac-Melbourne Institute Unemployment Expectations Index (a higher number indicating that more respondents expect unemployment to increase over the coming year) while the Westpac-Melbourne Institute House Price Expectations Index plunged 16.2 per cent, wiping out all the gains seen in June and July.
Why it matters:
A significant drop in sentiment in August is no surprise: the ANZ-Roy Morgan weekly index (see below) had been signalling falling confidence and this month’s Melbourne Institute-Westpac poll picked up the introduction of the stage four lockdown in Melbourne, the stage three lockdown in the rest of Victoria, and the concerns around outbreaks in New South Wales. Even so, the scale of the fall in sentiment reported in August was quite dramatic, taking the index back down to just five per cent above the low it reached in April during the first wave of COVID-19.
Moreover, the second wave of COVID-19 seems to have taken a greater toll on medium term expectations for the economy than did the first wave. Westpac pointed out that the combined 18 per decline over July-August for the ‘economy, next five years’ sub-index is much larger than the 5.1 per cent decline seen during the virus’ first wave in March-April. That suggests that this second wave has prompted fears that the pandemic and the associated disruption could be with us well into next year and then beyond. Granted, Westpac economists caution that the sharp fall recorded in August could well reflect ‘overblown’ fears about the likelihood of further outbreaks, pointing to the large falls outside Victoria where the health news has been quite different. Maybe so. But the reading does confirm the very fragile nature of consumer confidence at present.
What happened:
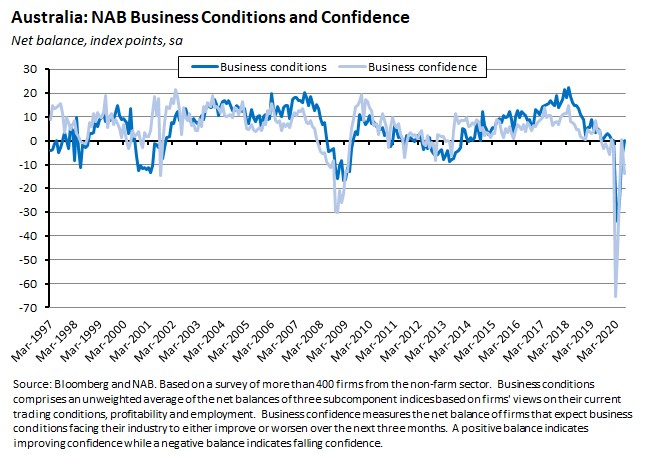
The NAB monthly business survey for July showed business conditions rising eight points to zero index points with all three sub-components (trading, profitability and employment) improving over the month. In contrast, business confidence dropped sharply, falling from zero index points in June to minus 14 index points in July.
Why it matters:
The rise in business conditions overall and the move of both the trading and profitability components into positive territory (the employment component also improved but remained in negative territory) indicate that the operating environment for Australian businesses continued to strengthen in July after having also improved in May and June. Indeed, conditions reportedly improved across all states, including Victoria. That’s also consistent with the July PMI results we reported a couple of weeks ago. Note, however, that the July NAB survey was conducted before the announcement of Stage Four restrictions in Melbourne and Stage Three restrictions across the rest of Victoria.
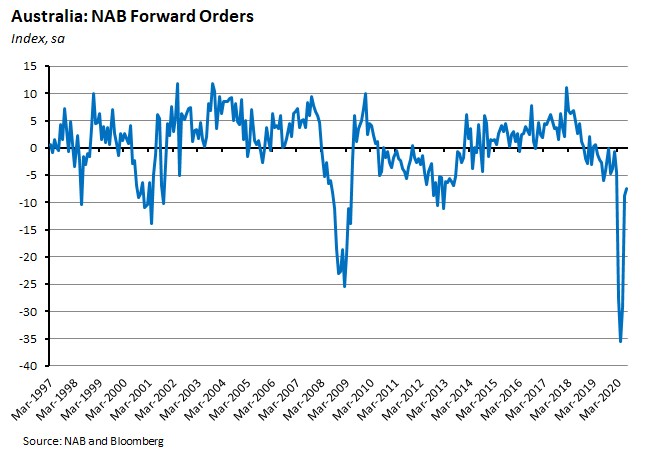
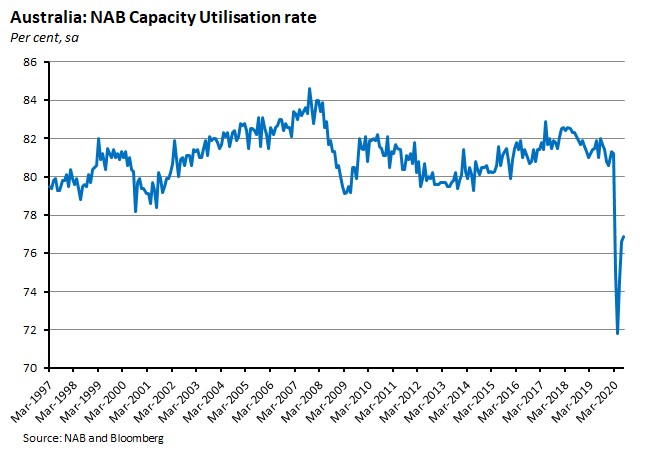
Moreover, the forward-looking picture was less positive. As well as the sharp drop in business confidence reported in July (by state, steepest in Victoria and New South Wales) the indicator for new orders remained in negative territory last month:
And the rate of capacity utilisation rates also remains low by historical standards:
What happened:
The ANZ-Roy Morgan weekly index of consumer confidence fell 2.4 per cent to a level of 86.5.
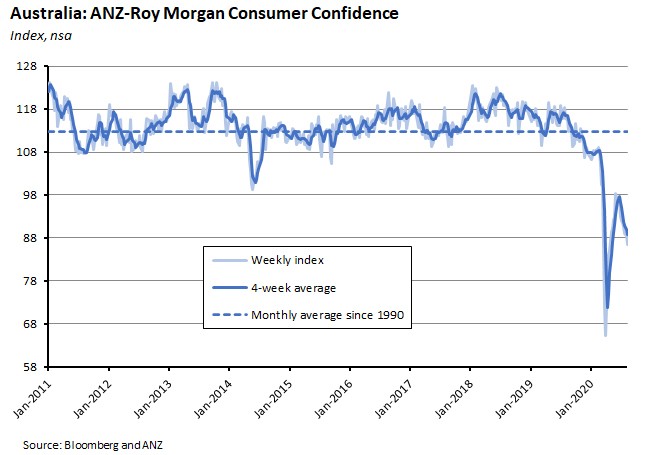
The reading relating to current economic conditions fell again this week, with now just five per cent of respondents expecting ‘good times’ for the Australian economy over the next 12 months (the lowest figure for this indicator since mid-April) while 55 per cent expect ‘bad times’ (the highest figure for this indicator since the April 11/12 survey this year). In contrast, the measure for future economic conditions picked up a little this week.
Why it matters:
Developments in Victoria continue to weigh on sentiment with the weekly index falling to its lowest level since the end of April. This also marks the seventh consecutive week of decline, which is a longer run of falls than the six weeks suffered during the first wave of COVID-19. That said, the magnitude of the decline in the index has been much gentler this time, with an 11 per cent fall spread over the past seven weeks versus a 40 per cent decline between late February and late March.
What happened:
Last Friday, the RBA published the August 2020 Statement on Monetary Policy. On the same day, Assistant Governor (Economic) Luci Ellis gave a speech on the Economic Outlook setting out some of the key themes in the Statement.
The RBA has again responded to the ‘extreme uncertainty about the course of the pandemic and its economic effects’ by offering three scenarios.
- The RBA’s baseline scenario assumes the current, heightened public health restrictions in Victoria are kept in place for the announced six weeks and then gradually lifted, while in the rest of Australia restrictions continue to be gradually lifted or are only tightened modestly for a limited time. Restrictions on international departures and arrivals are assumed to stay in place until the middle of next year.
- The upside scenario assumes faster progress in controlling the virus, which in turn boosts domestic consumer and business confidence and allows for a more rapid recovery.
- The downside scenario assumes Australia faces further periods of outbreaks and tighter restrictions in some areas while the global economy suffers from a widespread resurgence in infections. Business and consumer confidence are more subdued for longer and as a result the recovery is slower.
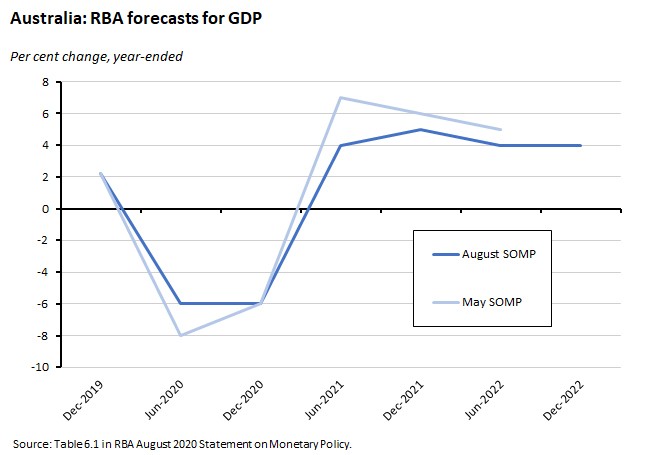
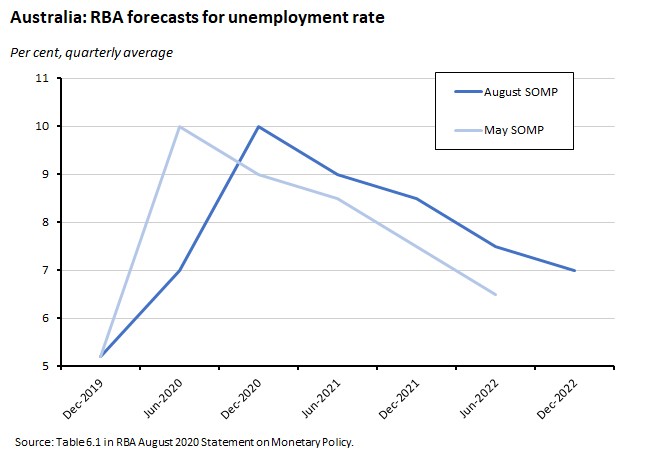
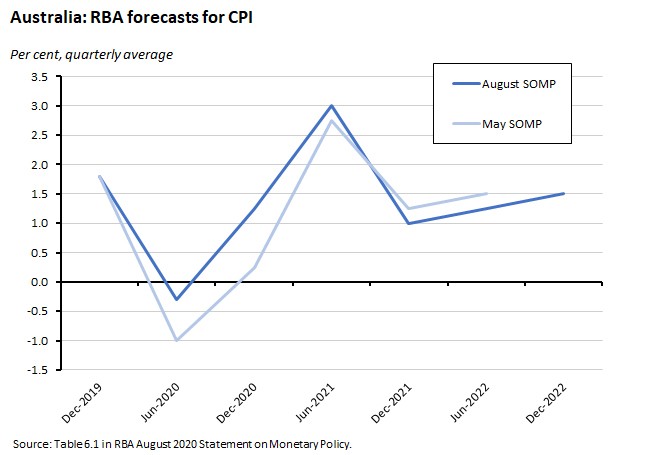
Under the baseline scenario, the economy is forecast to shrink by four per cent in 2020 (contracting by six per cent in the year to the December quarter) and to grow by just two per cent in 2021. In financial year terms, after real GDP being flat in 2019-20, the economy is forecast to shrink by three per cent in 2020-21 and then to grow by five per cent in 2021-22. The unemployment rate is expected to peak at around ten per cent in Q4:2020 and to still be at seven per cent by the end of 2022. Inflation is also expected to still be below the bottom of the RBA’s target band by the end of the forecast period.
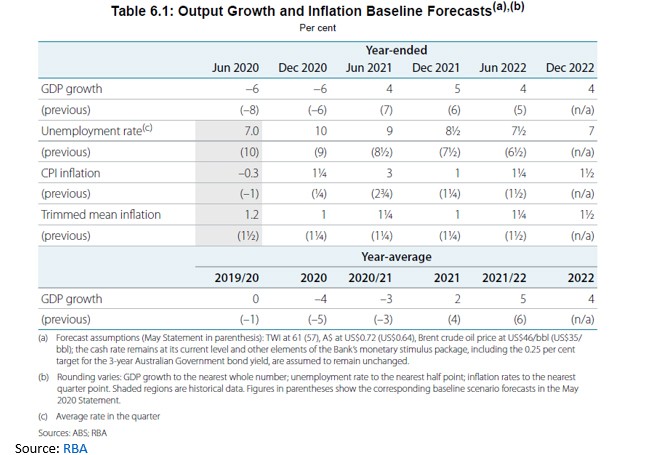
Source: RBA
The RBA’s general assumption of a ‘slow and uneven’ recovery at both the national and global levels reflects several factors, including remaining restrictions on some activities, voluntary social distancing measures that occur even after official mandates have been relaxed, and the persistent effect of high levels of uncertainty on consumer and business confidence, and therefore on spending and investment decisions. As a result, the RBA reckons that GDP ‘will probably take several years to return to the trend path expected prior to the virus outbreak.’
According to Assistant Governor Ellis, the RBA’s August scenarios incorporate several lessons that the central bank has learned over the past few months.
- First, although the economic contractions triggered by health-related restrictions on activity in the June quarter were large, they were smaller than the RBA had been anticipating back in May, partly because the lockdown was less severe than expected, and partly because restrictions were lifted sooner.
- Second, offsetting this positive surprise was the fact that general uncertainty and the response to weak demand seems to have accounted for a relatively larger share of the downturn in output and jobs than the public health measures.
- Third, in the labour market the adjustment in employment has been larger than the adjustment in average hours worked.
- Fourth, fiscal policy and early access to Superannuation have supported household incomes to a significant extent. Not only has this propped up current consumption, but it has also allowed some households to build up savings which should help offset the immediate negative impact of any future reductions in public support (see next story).
- And fifth, the unexpected increase in COVID-19 cases in Victoria shows how quickly things can change.
Also worth a look are two text boxes on the widespread use of wage subsidies by advanced economies in response to COVID-19 (the OECD said that as of June this year, 28 of its 37 member economies had used wage subsidies to support employment, with the extent of support ranging from around 60 per cent of the labour force in New Zealand, to 15 to 45 per cent in the larger euro area economies, 20 to 30 per in Canada and the United Kingdom and the more than 25 per cent of the labour force covered by JobKeeper here in Australia) and on fiscal policy support more generally, with large initial fiscal stimulus measures now being buttressed by new measures targeting the recovery.
Why it matters:
The RBA’s August assessment of the economic outlook delivered a mix of good and bad news.
The good news was that while the downturn in H1:2020 was extremely severe, it nevertheless wasn’t as bad as the central bank had feared back at the time of May’s Statement.
The bad news was that the RBA now thinks that the subsequent recovery in economic activity isn’t going to be as quick or as robust as it had hoped for back then. Instead, it will be ‘slow and uneven’, implying the persistence of substantial output gaps or excess capacity in the economy.
That in turn means that what was already a pretty bleak outlook for the labour market is now judged to be even worse, with the unemployment rate predicted to be higher for longer. That labour market slack will also weigh on wage growth, which is assumed to be running at less than two per cent throughout the forecast period.
It also follows that the RBA expects inflation to still be stuck below the bottom of its target band by the end of the forecast period. The annual rate of increase of both the headline CPI and the trimmed mean is forecast to be just 1.5 per cent by the December 2022 quarter.
In normal circumstances, this set of forecasts – output below potential, high unemployment and sub-target inflation for a prolonged period – would be expected to put pressure on the central bank to further ease monetary policy.
In this context, Governor Lowe’s 21 July speech, in which he ruled out a range of radical policy options while stressing that the RBA still retained room to adjust policy, makes for interesting (re-) reading. One clear message of that speech was that the RBA is now looking to the government and fiscal policy to do much of the heavy lifting from here. And the RBA’s new forecasts emphasise that there will indeed be plenty of heavy lifting to be done. A second message was that the RBA was not out of ammunition, and could for example tweak the parameters of its March 2020 package of monetary policy measures, perhaps by pushing the cash rate a little lower (to 0.1 per cent) and/or by ramping up bond purchases. Last week’s forecasts imply that there will be pressure to do something along those lines, although the economic impact of such measures is unlikely to be large. Finally, the risk of the RBA’s downside scenario playing out suggests that, despite the Governor’s obvious reluctance, some of those more radical options may yet find their way onto the policy agenda.
What happened:
The ABS reported new survey results on the receipt and use of government stimulus payments in May this year. Survey responses were collected between 10 May and 23 May from approximately 2,600 people via telephone interview.
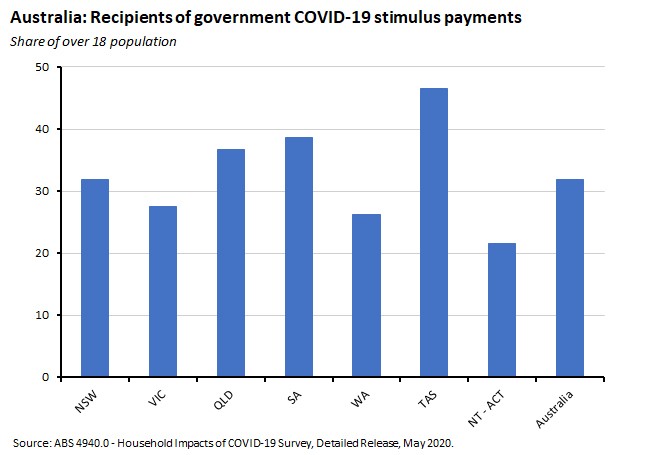
The survey found that almost one in three Australians (32 per cent) had received a personal stimulus payment from the Australian Government in May, with the share ranging from 47 per cent of all adults in Tasmania, 39 per cent in South Australia and 37 per cent in Queensland to 26 per cent in Western Australia and less than 22 per cent in the NT-ACT.
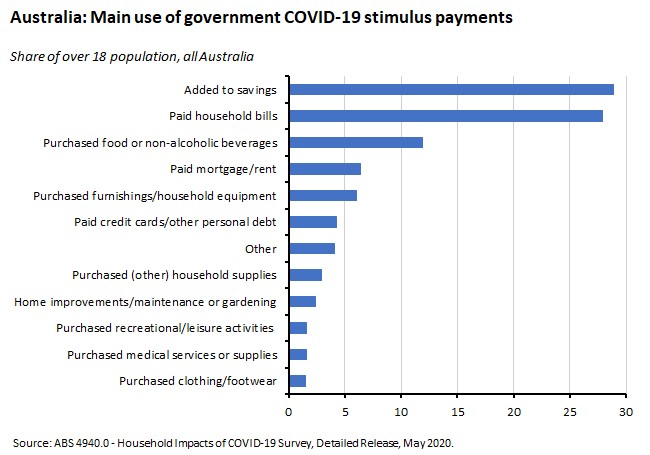
The survey found that people found multiple uses for the stimulus payment but in terms of the main use, the most common choices were to add to savings (29 per cent), pay bills (28 per cent) and purchase food and non-alcoholic drinks (12 per cent).
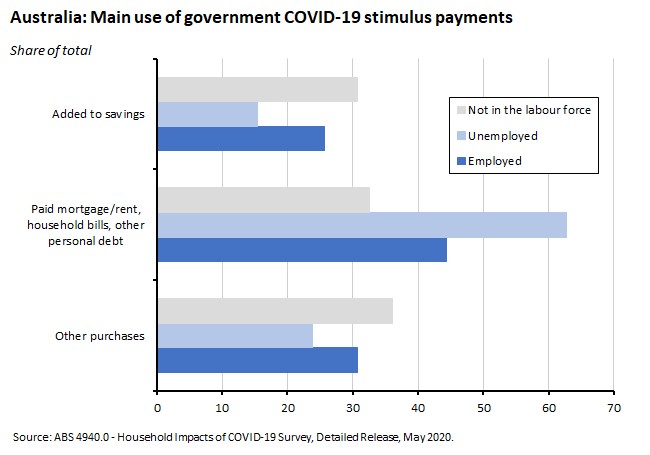
The employed (44 per cent) and the unemployed (63 per cent) told the ABS that they mainly spent the money they received to pay household bills, rent and mortgage or other loan payments. For those not in the labour force the stimulus spend was distributed more evenly across making general purchases including food and household furnishings (36 per cent), paying household bills, rent and mortgage or other loan payments (33 per cent) and adding to their savings (31 per cent).
By age, older people were more likely to report adding stimulus payments to their savings than those under 64 years of age (37 per cent compared to 22 per cent) while younger people were more likely than older people to have used the money to pay household bills (31 per cent compared to 23 per cent), to have bought food and non-alcoholic drinks (15 per cent compared to eight per cent) or to have paid their mortgage or rent (ten per cent compared to one per cent).
Why it matters:
The RBA’s latest Statement on Monetary Policy (see previous story) emphasises the important role played by fiscal stimulus in supporting households during the early months of the COVID-19 economic disruption. Indeed, one of the unusual features of the current downturn has been the impressive resilience in household income in the face of an unprecedented economic downturn, which reflects that large-scale fiscal largesse. In this context, the ABS survey provides some interesting data on how that money has been used and/or saved.
What I’ve been reading:
The ABS provides a detailed review of participation, job search and labour mobility in the Australian economy (but note that this draws on February numbers, so it’s a pre-COVID view of the world). There are some interesting insights to be found here. For example, the data on job mobility show that just 8.2 per cent of employed persons (about 1.1 million people) changed employers or businesses in the twelve months to February 2020. That figure is broadly consistent with the rate of job churn seen over the previous four years, which ranges from a low of 7.7 per cent in February 2017 to a high of 8.5 per cent last year. But it’s significantly lower than the 11 per cent rate of job switching found in the early 2000s. Recent work by Treasury has pointed to this shift as one potential explanation for weak wage growth in Australia pre-pandemic.
Bloomberg on Australia’s three-speed labour market, contrasting Victoria, New South Wales and Western Australia.
Grattan’s Tony Wood argues against either a simple gas-led or green-led fiscal recovery strategy.
The latest Deloitte Access Economics Investment Monitor counts 555 government infrastructure investment projects currently underway or in planning in Australia, worth a combined $314 billion. That breaks down into $155 billion of infrastructure investment projects already underway, a further $65 billion of projects scheduled to commence construction this year, $18 billion scheduled for 2021 and $76 billion without a confirmed start date. The transport sector accounts for less than half of the total number of projects, but almost three quarters of total project value.
This Department of Industry research paper looks at Australian firms that are ‘born global’ (that is, enter export markets in their first year). It finds that two-thirds of these firms are non-employing while most of the rest employ less than five people. They are concentrated in four sectors: wholesale trade, professional, scientific & technical services, retail trade and manufacturing.
Mohamed El-Erian looks at the forces that have seen a depreciation of the greenback reverse in just a few months almost half the appreciation of the last decade, a development which he interprets as ‘part of a larger, gradual fragmentation of the international economic order.’
This essay in Nature speculates on how the pandemic might play out next year and beyond.
The FT’s Martin Sandbu suggests that ‘tax and spend’ is destined to become the new economic orthodoxy. With many OECD member economies expected to add government debt worth between 20 and 30 percentage points of GDP this year and next, their governments will have to choose between permanently higher debt levels or a significant hike in taxes. Alternatively, they may end up with both. Ragurham Rajan is worried about some of the potential consequences.
This report from the CSIS tries to think about how COVID-19 is reshaping the future. The approach taken here is to look at seven key trends – population, resources, technology, information, economics, security and governance – and then in each case to identify several indicators and provide an assessment of immediate and long-term impacts. For example, in the case of economics the chosen trends are globalisation, supply chains, inequality, labour dislocation and innovation. For inequality, the report identifies the immediate impact as that weak companies, small businesses and low wage earners are all disproportionately affected by the pandemic while the long-term impact is the first increase in global poverty since 1998 and a further increase in size for already-big companies.
An interesting attempt by Aizenman and Ito to provide some empirical data to test Dani Rodrik’s idea of a ‘political economy trilemma’ (the proposition that of the three policy options of national sovereignty, democracy, and hyper globalisation, a country can only choose to maximise two. For an early formulation, see here. For a book-length discussion, I’d recommend Rodrik’s The Globalisation Paradox). I’ve found that Rodrik’s trilemma offers a useful framework for thinking about the world, although it’s also received some pushback. Aizenman and Ito reckon that their data show that for advanced economies there has been more of a dilemma than a trilemma (a straightforward trade-off between national sovereignty and international economic integration) but that the trilemma applies to developing economies.
Ricardo Hausman frets that Zoom (and Skype and email) will prove to be a very imperfect substitute for international business travel, with adverse consequences for the pace of technological transfer. He ventures estimates that a permanent shutdown of the 1.7 per cent of GDP that was being spent on business travel pre-pandemic could shrink global GDP by 17 per cent.
Drawing on this NBER paper which looks at the impact of changes in consumer expenditure patterns due to the pandemic (more spending on food and other groceries, less on transport, recreation, hotels and restaurants), Bloomberg’s Shuli Ren wonders whether we are significantly underestimating the ‘real’ level of inflation.
A thought-provoking leader from the Economist magazine arguing that it takes ‘new facts and clever techniques’ to shift economic opinion, but that age might matter too. It kicks off a new series looking at areas where economists are rethinking some of their basic ideas, assumptions and policy prescriptions. The first piece in that series examines changing ideas around anti-trust and market concentration.
Related: although it’s more about making a specific argument rather than just reviewing examples of how thinking has changed, Binyamin Applebaum’s book The Economists’ Hour (which I’ve mentioned here before) tells a compelling story of how the economics profession, particularly in the United States, changed its mind about a whole range of issues and in the process helped deliver an economic policy revolution. Note, however, that Applebaum is not a fan of many of these changes.
Latest news
Already a member?
Login to view this content


