The RBA cut the cash rate by 25bp this week, seeking to protect the economy from the economic and financial market disruption triggered by COVID-19. With only 25bp left before we hit the effective lower bound, unconventional monetary policy now looms, although Canberra is expected to announce a significant fiscal stimulus package by next week. GDP rose by 0.5 per cent over the quarter in Q4:2019 to be 2.2 per cent higher in annual terms, beating market expectations. But new estimates from the RBA and Treasury are that the coronavirus will trim at least half a percentage point from growth in the first quarter of 2020.
The US Fed delivered its first emergency rate cut since the global financial crisis (GFC) but achieved only a mixed market reaction. PMI readings for February suggest major virus-related disruption to China’s economy and a substantial hit to global activity. The OECD has cut its forecasts for global growth.
This week’s readings include the potential macroeconomic impact of COVID-19 (surprise!), the ABS on data, natural disasters and the Australian economy, a look at what options are available to the Fed in a low interest rate world, and the economic implications of demography.
Please note that publication deadlines mean we won’t cover Friday’s release of Australian retail sales numbers until next week.
Finally, my thanks to those members who said ‘hello’ during this week’s AGS and those who took the chance to give me some feedback on the weekly note. Cheers!
What I’ve been following in Australia . . .
What happened:
The RBA decided to cut the cash rate by 25bp to a new record low of 0.5 per cent at its 3 March Board meeting.
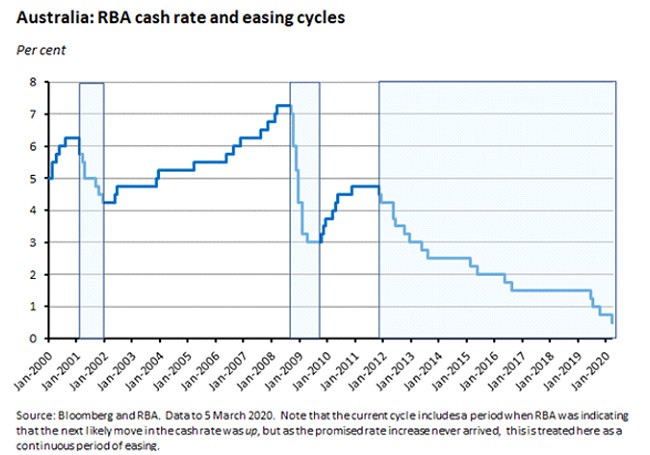
The accompanying statement said that the Board ‘took this decision to support the economy as it responds to the global coronavirus outbreak.’ The RBA acknowledged that the outbreak ‘is having a significant effect on the Australian economy at present, particularly in the education and travel sectors. The uncertainty that it is creating is also likely to affect domestic spending. As a result, GDP growth in the March quarter is likely to be noticeably weaker than earlier expected.’ It also stressed that ‘it is difficult to predict how large and long-lasting the effect will be’, although the central bank continues to hope that once the virus is contained, the economy will ‘return to an improving trend.’ Meanwhile, however, the RBA ‘is prepared to ease monetary policy further to support the Australian economy.’
In subsequent testimony to a Senate estimates economics committee, RBA deputy governor Guy Debelle said that the central bank already reckons that disruption to tourism and international education could subtract about 0.5 per cent from March quarter GDP growth, keeping in mind that there was still about a full month of data to go. That’s similar to estimates from Treasury Secretary Steven Kennedy of a cut of at least half a percentage point to first quarter growth due to the virus.
Why it matters:
As late as the end of last week, market pricing had put the chances of an RBA rate cut this month at comfortably below one in five, despite the pummelling that global financial markets had suffered over the preceding week following their swift and brutal re-assessment of the likely economic fallout from COVID-19. By Monday this week, that calculation looked very different, with markets fully pricing in a 25bp cut at the RBA’s Tuesday meeting along with some chance of a larger 50bp cut. Market surveys of economists’ expectations were more mixed, but here too there was a big shift in opinion towards the likelihood of a cut, with several even tipping back-to-back cuts this month and next.
The RBA duly met the markets’ expectations regarding a March cut and as a result has now taken its policy rate down to within 25bp of what it has previously described as the effective lower bound for the cash rate. In other words, there is now just one meagre 25bp rate cut left in the monetary policy arsenal, after which the RBA will have to turn to unconventional measures such as Quantitative Easing (QE). At the time of writing, financial market pricing indicated that there was an 87 per cent chance of that final rate cut coming next month, while a cash rate at 0.25 per cent was (more than) fully priced in by the time of the July meeting. Moreover, the efficacy of a couple of 25 bp rate cuts in dealing with the economic fallout from COVID-19 is hard to judge (see the story on this week’s US Fed rate cuts, below, for more on the limitations of monetary policy in this context).
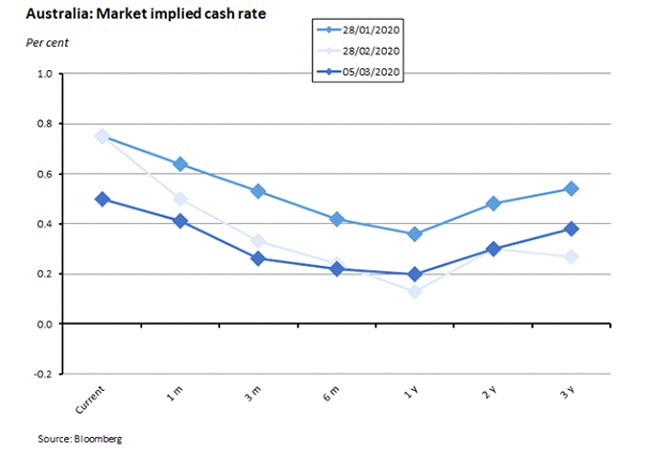
Last year and pre-COVID-19, Governor Lowe stated that it was highly unlikely that the RBA would have to resort to QE, noting for example in his 26 November speech on unconventional monetary policy that ‘QE is not on our agenda at this point in time’ and again that ‘[t]here may come a time where QE could help promote our collective welfare but we are not at that point and I don’t expect us to get there.’ Thanks to the coronavirus outbreak, the prospect of unconventional monetary policy here in Australia no longer looks so unlikely. That said, Martin Place will still be hoping that the government’s promised fiscal stimulus measures to be announced next week will take some of the adjustment burden from monetary policy.
What happened:
According to the ABS, Australia’s real GDP rose by 0.5 per cent (seasonally adjusted) over the final quarter of last year to be up 2.2 per cent relative to the December quarter of 2018. In per capita terms, GDP growth was up 0.2 per cent over the quarter and 0.7 per cent over the year. The slight increase in the pace of output growth saw productivity growth (GDP per hour worked) rise by 0.4 per cent relative to December 2018.
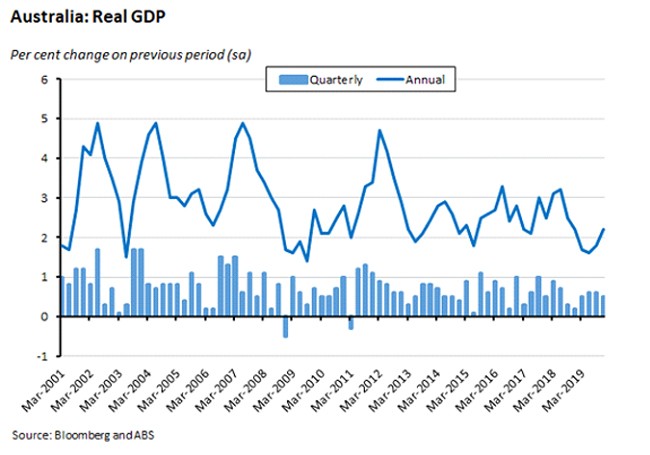
Across the December quarter, growth was driven by positive contributions from government and household consumption, ownership transfer costs, an increase in inventories (driven by a build-up of mining inventories) and a modest contribution from net exports. The increase in ownership transfer costs (up 12.3 per cent over the quarter) which measures lawyer fees, fees and commissions paid to real estate agents and auctioneers, stamp duty, Title Office charges and local government charges, reflects the turnaround in the housing market through the second half of last year.
In contrast, dwelling investment and private business investment continued to be a drag on the economy.
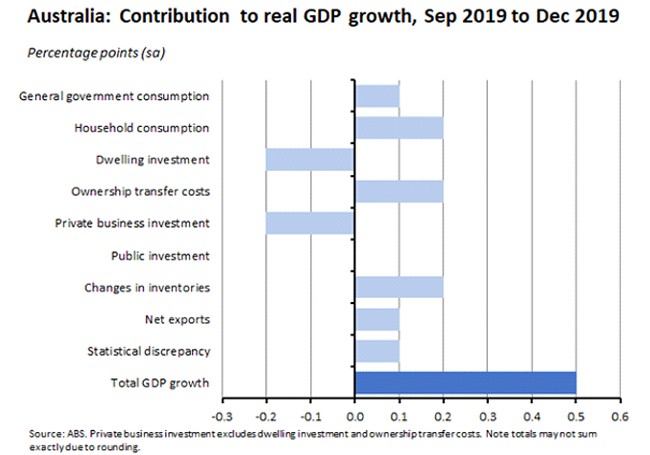
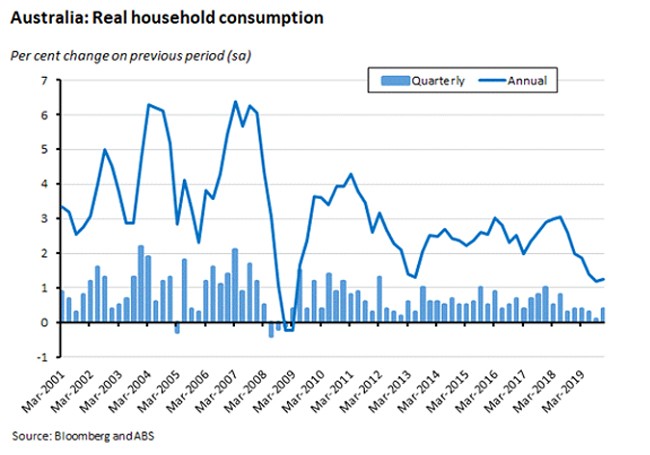
The lacklustre performance of household consumption – which accounts for about 55 per cent of GDP – was a key theme for much of last year, and here there was some better news to close out the year as consumption grew by 0.4 per cent over the quarter - a much stronger outcome than the 0.1 per cent quarterly gain recorded in Q3:2019. The ABS points to sales events supporting consumer spending in the final quarter, with consumption of discretionary goods and services enjoying their largest quarterly increase (0.5 per cent) since Q2:2018. That said, although the pace of annual consumption growth also edged up, that was only to 1.2 per cent, which is still a relatively subdued pace by historic standards.
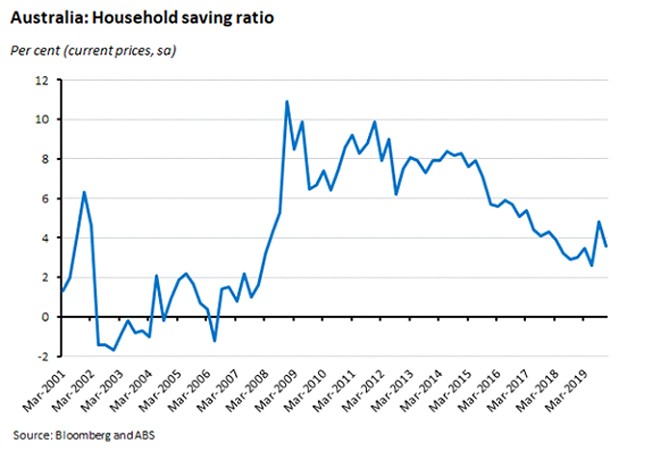
At the same time, after spiking to three per cent annual growth in the September quarter due to the impact of the government’s low and middle income tax offset, growth in real household disposable income eased back to 1.8 per in the December quarter (the ABS points to a 9.3 per cent increase in tax payable following the strong decline in the previous quarter). As a result, the household saving rate also fell a little, dropping to 3.6 per cent in Q4 from 4.8 per cent in Q3.
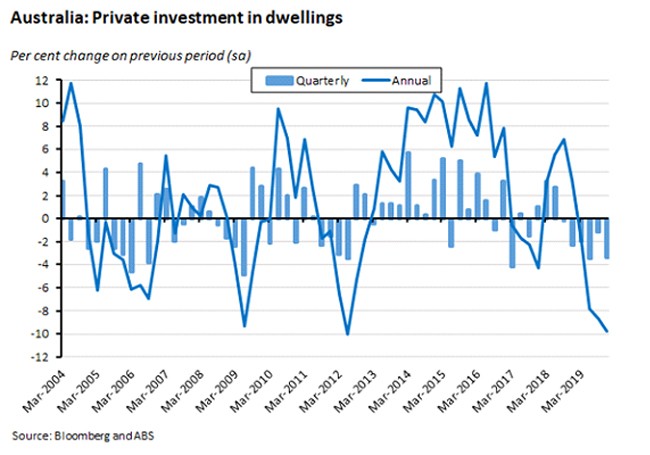
Private investment in dwellings continued to decline in both quarterly and annual terms. There have now been six consecutive quarters of shrinking housing investment and January’s approvals data (see story below) suggests that housing construction will continue to be a drag on the economy into at least the first half of this year.
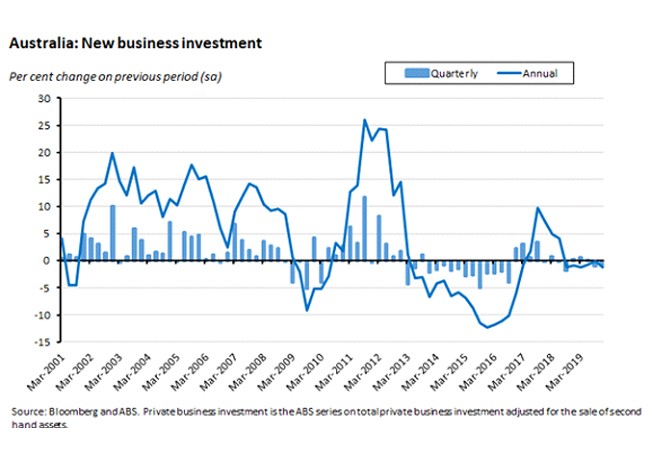
Private business investment also fell over the quarter, dropping by 0.8 per cent to be down 1.2 per cent over the year. Non-mining investment drove the decline, falling 3.6 per cent over the quarter. In contrast, mining investment rose five per cent across the quarter and was up 3.2 per cent through the year, marking the first increase since the September quarter of 2017. As a share of GDP, private business investment remains stuck close to multi-decade lows, at just 11.5 per cent.
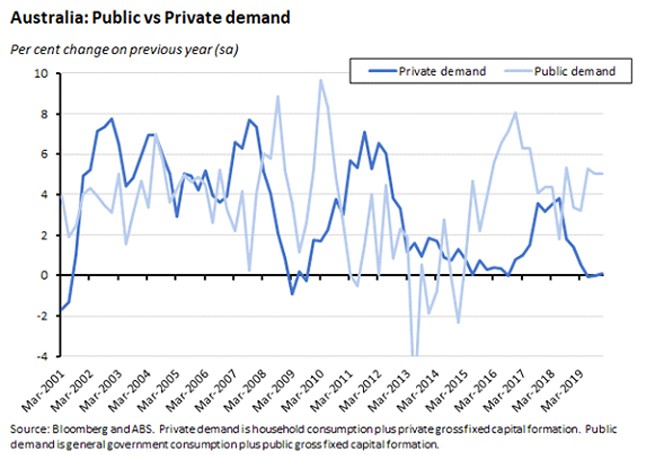
Overall, private demand (household consumption plus private business and dwelling investment) was up only 0.1 per cent over the year and made a negligible contribution to the quarterly growth total. That was offset by continued growth in public demand – driven by public consumption – as well as a contribution from net exports.
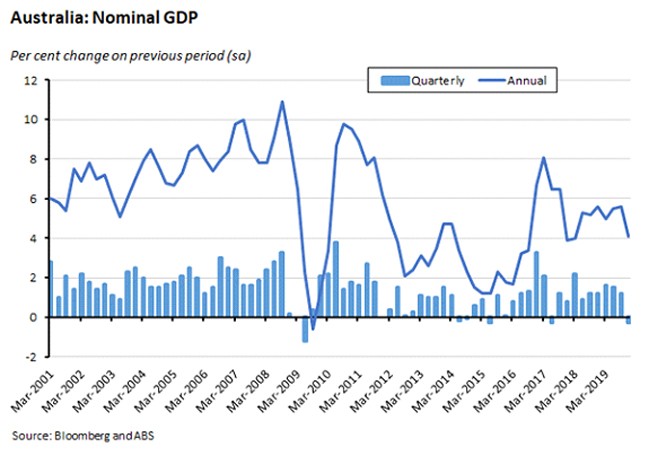
And while real GDP growth picked up in the December quarter, a decline in the terms of trade meant that nominal growth moved in the opposite direction, with nominal GDP contracting over the quarter and the annual pace of nominal growth falling to 4.1 per cent in Q4 from 5.6 per cent in Q3.
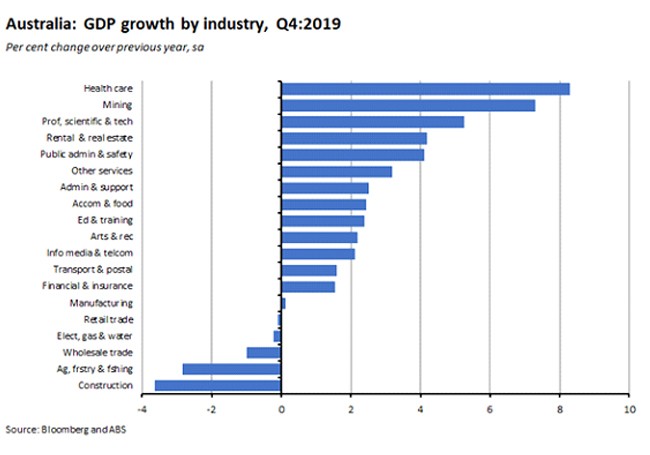
By industry, growth over the quarter (seasonally adjusted) was strongest in rental and real estate services, manufacturing, transport, postal and warehousing, health care, and mining, and weakest in construction and administrative and support services. Annual growth was strongest in health care, mining, professional scientific and technological services, and rental and real estate services, and weakest in construction, agriculture and wholesale trade.
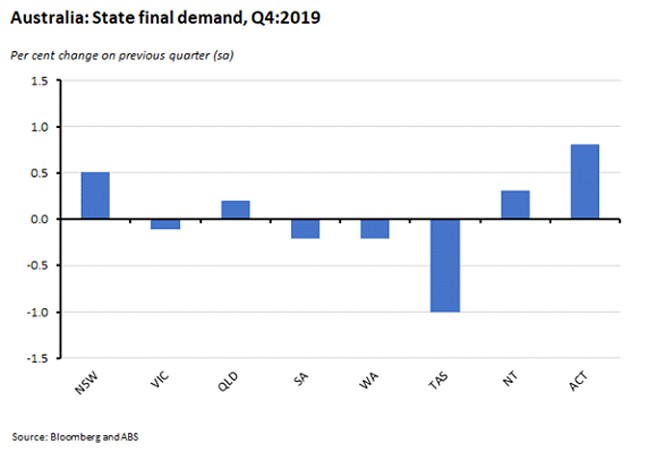
By state, final demand growth rose over the quarter in New South Wales, Queensland, the Northern Territory and the ACT, and fell in Victoria, South Australia, Western Australia and Tasmania.
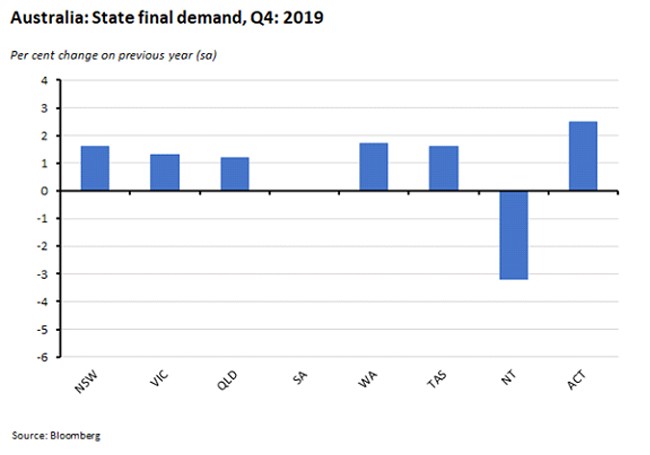
In annual terms, final demand growth was positive in all states except for South Australia (no change) and the Northern Territory (down more than three per cent).
Why it matters:
The growth outcome for the last quarter of 2019 exceeded consensus expectations for a 0.4 per cent quarter-on-quarter and two per cent annual increase. It also marks a modest improvement relative to the three quarters that preceded it. As a result, in other circumstances, the RBA might have felt reassured that the numbers were broadly consistent with its long-awaited ‘gentle turning point’ for the economy. Certainly, it would have been pleased by the uptick in consumer spending, and it would have also pointed to the predicted turnaround in mining investment.
That said, the growth numbers themselves didn’t offer too much to get excited about. Thanks to falling non-mining investment, private business investment continued to disappoint. And private demand overall remained subdued, with the economy continuing to rely on public sector demand and net exports to drive growth.
More importantly, however, with COVID-19 taking a significant toll on activity in China and across the global economy in the first quarter of this year (see below), this look back to previous economic performance will be less relevant than usual in shaping views about the year ahead. Instead, attention will be focussed on how that economic disruption translates into activity in the first – and likely second – quarter of this year. And as already noted, both the RBA and the Treasury expect that impact will involve at least half a percentage point being sliced from real GDP growth in the March quarter. In response to this anticipated economic headwind, press reports have started to suggest that the government is planning a substantial fiscal package.
What happened:
The ABS said that Australia recorded a $955 million current account surplus in the final quarter of last year (seasonally adjusted), with a $13.9 billion surplus in goods and services trade and a $12.5 billion primary income deficit.
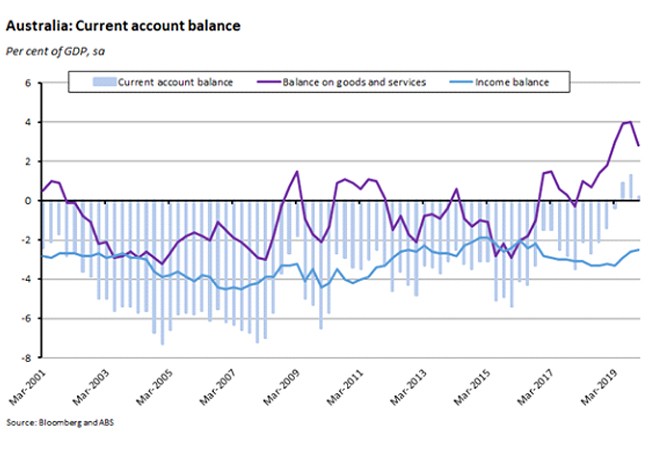
For 2019 overall, Australia recorded a current account surplus of $10.3 billion, up from a $39.1 billion deficit in 2018. That big swing in the external position was driven by rise in the trade balance in general, and in the goods trade balance specifically, with a 2019 goods trade surplus of $70 billion well up on the $28.3 billion surplus recorded on the goods account in 2018.
Why it matters:
December’s result marked a third consecutive quarterly surplus. The last time Australia generated a run of back-to-back surpluses was in the early 1970s (from the June quarter of 1972 to the December quarter of 1973). The size of the Q4 surplus was sharply down from the June and September quarter results, however, mainly as a result of lower commodity prices (the terms of trade fell 5.3 per cent in the quarter as the implicit price deflator for exports of goods and services declined by 4.5 per cent) as well as a steep 20 per cent decline in the volume of exports of non-monetary gold. With global trade and commodity prices both set to be squeezed by the impact of COVID-19 this year (see below), this may mark the end for now of the Australian current account’s foray into the black.
What happened:
The CoreLogic Home Value Index showed combined capitals dwelling values rose by 1.2 per cent in February to be up 7.3 per cent over the year. National values were up 1.1 per cent in monthly terms and 6.1 per cent in annual terms.
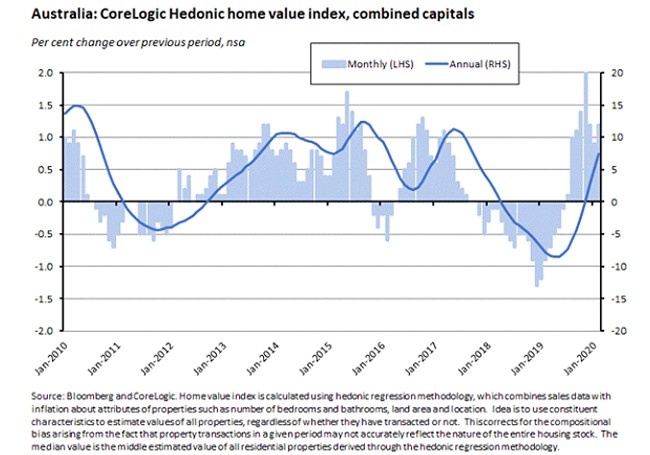
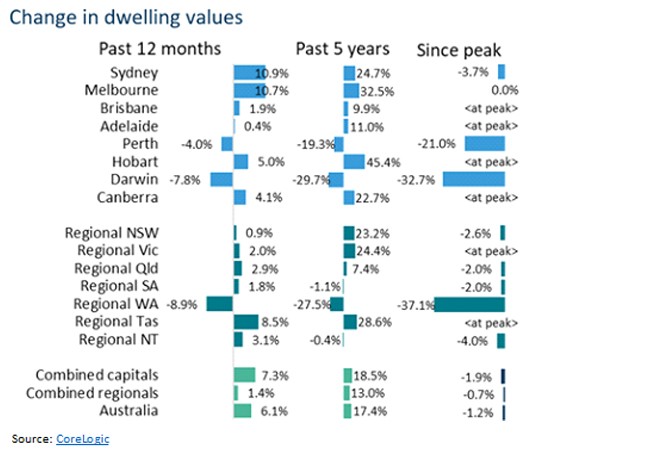
Values in both Sydney and Melbourne rose at double-digit rates in annual terms last month, with CoreLogic reporting that ‘every capital city excluding Darwin is showing an upward trajectory’ in values, although in the case of Perth values remain far below their previous peak.
Why it matters:
February saw housing values pass their September 2017 peak in Melbourne and values are now at record highs in Melbourne, Brisbane, Canberra, Hobart and Adelaide while in Sydney values are just 3.7 per cent below their previous peak. If current rates of growth were to be sustained – even in the face of COVID-19 – CoreLogic notes that the national index would be on track to reach a new nominal high over the next two months.
Before the worsening economic fallout from the virus, this continued surge in asset prices might have encouraged the RBA towards a continued pause in terms of any further monetary policy action, particularly in the context of the pickup in headline GDP growth in Q4 (see above). After all, back in February Governor Lowe was warning that ‘Lower interest rates could also encourage more borrowing by households eager to buy residential property at a time when housing debt is already quite high and there is already a strong upswing in housing prices in place. If so, this could increase the risk of problems down the track.’ But any such concerns have now been swamped by the need to inoculate the economy against the consequences of the looming pandemic.
What happened:
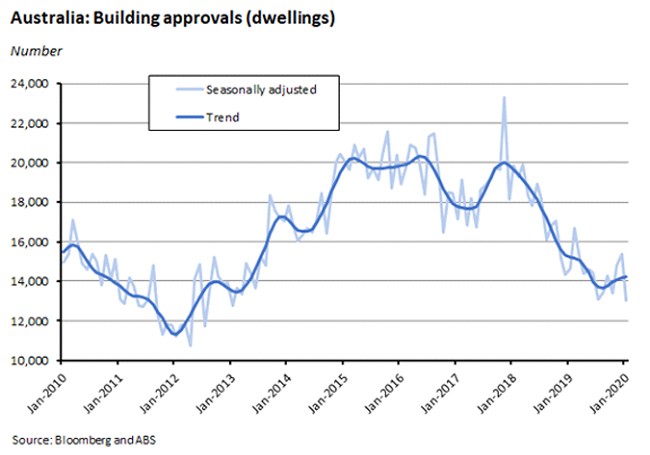
Dwelling approvals in January fell by 15.3 per cent (seasonally adjusted) over the month to be down 11.3 per cent over the year. The ABS reported that approvals for houses were almost flat over the month but approvals for units slumped by 35.5 per cent in monthly terms and were down more than 15 per cent relative to January 2019.
Why it matters:
The consensus had expected a one per cent rise in dwellings approvals in January, but a dramatic 68 per cent monthly plunge in unit approvals in Victoria meant that the overall outcome was much worse than had been anticipated. After the two previous months had seen a recovery in approvals consistent with the improvement in sentiment indicated by rising house prices, January’s result marks a big shift in direction which – if sustained – would undermine hopes for a stabilisation in construction activity later this year.
What happened:
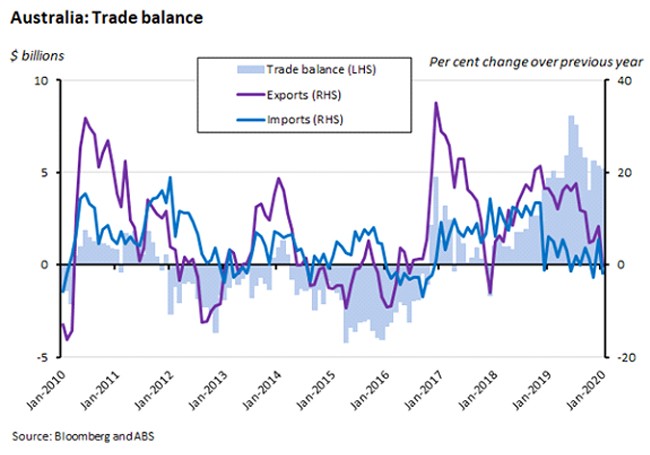
The ABS said that Australia recorded a trade surplus of $5.2 billion in January (seasonally adjusted), down only slightly from December’s result. Exports and imports both fell three per cent over the month, with sizable drops in the value of exports of non-monetary gold (down 34 per cent) and in imports of capital goods (down ten per cent).
Why it matters:
January continued the recent run of strong trade surpluses, although this time part of the story was that weakness in goods exports was offset by a fall in imports, including of capital goods. February’s trade results are likely to attract rather more attention however, as the impact of COVID-19 should then start to appear in the data (exports of tourism related services were little changed in January, rising by $24 million relative to December).
. . . and what I’ve been following in the global economy
What happened:
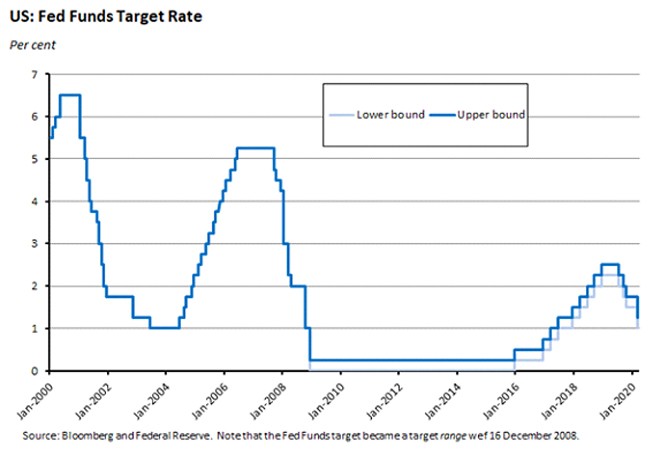
The US Federal Reserve delivered an emergency rate cut, lowering the target range for the fed funds rate by 50bp to 1.0 per cent – 1.25 per cent. The FOMC statement stressed that the ‘fundamentals of the US economy remain strong’ but went on to say that ‘the coronavirus poses evolving risks to economic activity’.
Fed Chair Jerome Powell said (pdf) that ‘The outbreak has . . . disrupted economic activity in many countries and has prompted significant movements in financial markets. The virus and the measures that are being taken to contain it will surely weigh on economic activity, both here and abroad, for some time. We are beginning to see the effects on the tourism and travel industries, and we are hearing concerns from industries that rely on global supply chains. The magnitude and persistence of the overall effects on the economy, however, remain highly uncertain, and the situation remains a fluid one.’ Both the FOMC statement and Powell’s comments made the expected pledge that the Fed would continue to monitor developments closely and stand ready to support the economy as needed.
Why it matters:
This is the first time since the GFC that the Fed has delivered an emergency rate cut (that is, delivered a rate cut between scheduled meetings of the FOMC). Since these kinds of interventions are reserved for times when the Fed is faced with a sudden and sharp deterioration in the economic outlook, this week’s action, along with the decision to deliver a 50bp cut rather than a smaller 25bp move – serves as an indication of how seriously policymakers are now taking the economic and financial risks triggered by COVID-19 and the efforts to contain it.
At the same time, there are also important limits to the Fed’s ability – and that of central banks including the RBA – to counteract the threat to economic growth.
First and most obviously, with the target fed funds range starting at the already-low level of 1.5 per cent – 1.75 per cent even before this week’s move, that leaves only a very limited scope to deliver further rate cuts. Historically, when the Fed has faced recession-risk, it has cut its policy rate by around 500bp. Obviously, that’s no longer an option. Moreover, turning to QE as an alternative may also have only limited leverage in current circumstances given that long-term interest rates are again already very low. The rate on US 10-year treasuries, for example, dropped below one per cent for the first time ever this week. The RBA is in a similar position, with even less room before hitting the effective lower bound.
Second, the economic impact of the coronavirus involves both demand and supply shocks, plus the financial shock that has rolled out over the past two weeks. Monetary policy, in the form of lower interest rates, is typically well-suited to dealing with a shock to demand. Likewise, central banks are accustomed to being tasked to deal with financial market disruptions. But monetary policy is less suited to dealing with supply shocks such as disruptions to global value chains, the closure of factories and offices in the event of quarantine restrictions, or a widespread inability of employees to turn up at their workplace due to ill health or carers’ duties. Moreover, the nature of the demand shock in this case may also serve to limit the conventional impact of lower rates: if people are spending less time and money in shops, bars and restaurants because they are unable or unwilling to venture into public spaces, for example, 50bp off interest rates is unlikely to make a big difference.
Financial market participants are obviously aware of both limitations, which likely goes some way to explaining the initially mixed market response to the Fed’s move this week.
What happened:
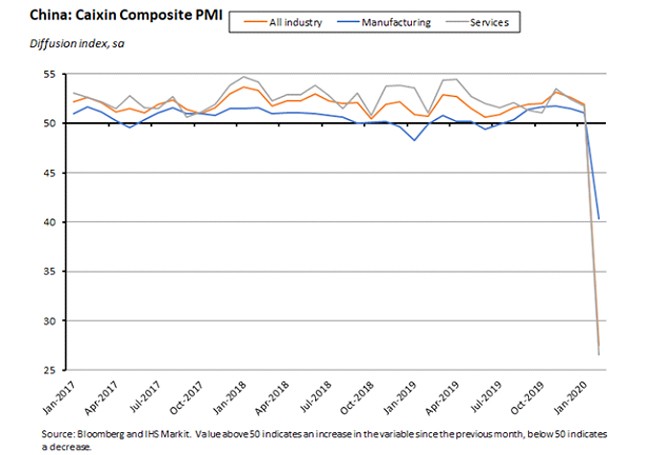
Business activity in China fell sharply in February. Last Saturday, China’s National Bureau of Statistics (NBS) reported that the official purchasing managers index (PMI) fell to 35.7, down from 50 in January. The reading for new order also slumped, while new export orders also collapsed.
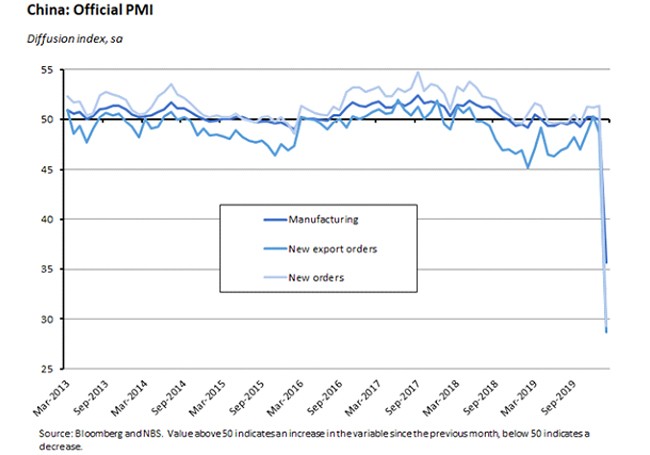
Likewise, the unofficial Caixin manufacturing PMI fell to 40.4 from 51.1 in January while the Caixin services PMI plunged to 26.5 in February from 51.8 in January.
Why it matters:
The official PMI reading was the weakest result since the NBS first released the index in 2005 while the Caixin manufacturing and services readings were likewise the lowest since both surveys began. All of which serves to emphasise the severity of the disruption to business operations in China caused by COVID-19, consistent with a serious slump in economic activity.
What happened:
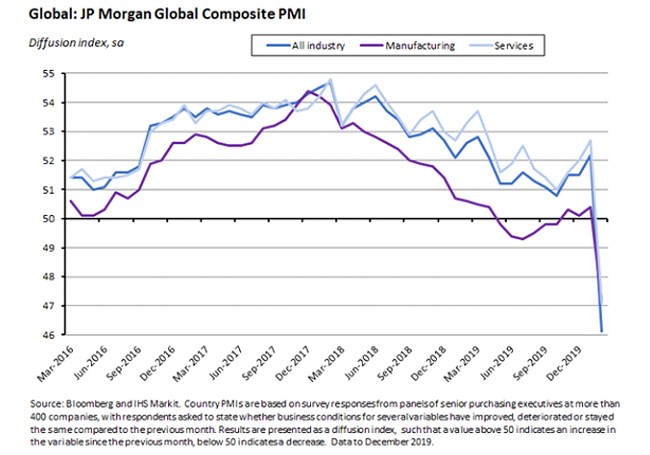
The JP Morgan Global PMI composite index fell (pdf) to 46.1 in February, down from 52.2 in January. Global manufacturing output and service sector business activity both dropped over the month, with the decline in manufacturing outpacing the fall in services.
Why it matters:
The composite index fell to a 129-month low in February, with COVID-19-related disruption to demand, supply chains and international trade flows triggering the steepest falls in the measures of economic activity and new business seen since mid-2009 during the GFC. The more than six point drop in the index was also the second sharpest in the history of the survey, beaten only by the post-911 decline recorded in October 2001. Not surprisingly, the big falls in China described above played a major role in pulling down the overall results.
What happened:
The OECD produced some preliminary estimates of the impact of the COVID-19 outbreak on global economic prospects.
On the optimistic assumption that the epidemic peaks in China in the first quarter of this year and that outbreaks in other countries prove ‘mild and contained’, the OECD estimated that the impact of the coronavirus would be to lower growth in China by about 0.8 percentage points (to 4.9 per cent) this year and to cut about half a percentage point from global growth (bringing it down to 2.4 per cent). World trade is assumed to contract by 0.9 per cent over the year. By country, the hit to growth is expected to be worst for those economies most closely connected to China, including Australia (growth down by 0.5 percentage points to 1.8 per cent), Japan (down 0.4 percentage points to 0.2 per cent) and Korea (down 0.3 percentage points to two per cent). Under this scenario, global growth would recover to 3.3 per cent in 2021, with growth here in Australia rebounding to a 2.6 per cent growth rate next year.
The OECD also considered a more negative ‘domino’ scenario which looks at the potential effects of the virus spreading much more intensively through both the wider Asia-Pacific region and the major advanced economies. In this scenario, global growth in 2020 is forecast to be halved, falling by about 1.5 percentage points, while world trade is projected to tumble by around 3.75 per cent.
Why it matters:
The OECD’s estimates are the first major official forecast to try to incorporate the impact of COVID-19. As such, they serve as a useful update to the IMF’s 22 February comments to the G20, in which the Fund said it was trimming just 0.1 per cent off its January 2020 global growth forecast. Not so much because the OECD’s forecast is likely to be the last word on the subject, but rather because it’s a helpful reminder of how quickly assessments of the economic fallout from the virus are evolving at the moment, and hence how much uncertainty there is around likely actual outcomes.
What I’ve been reading
Warwick McKibbin and Roshen Fernando examine the global macroeconomic impacts of COVID-19 through seven scenarios, arguing that even a contained outbreak could significantly impact the global economy in the short run. The scenarios build on shocks to the supply of labour (reflecting mortality and morbidity due to infection and morbidity arising from caregiving for affected family members), to equity risk premia, to the cost of production, to consumer demand, and to government expenditure. For the global economy, the most modest economic costs (scenario one) are a loss of US$283 billion to global GDP in 2020. But the results suggest that in the case of a global pandemic, the hit to world GDP could range from US$2.4 trillion in the case of a low-end pandemic resembling the Hong Kong Flu (scenario four in the paper) to more than US$9 trillion in the case of more serious outbreak closer in nature to that of the Spanish Flu (scenario six). For Australia, scenario four would entail a US$27 billion hit to GDP while scenario six would see GDP losses of US$103 billion.
The ABS Chief Economist has a new paper on measuring natural disasters in the Australian economy which among other things seeks to explain the lags involved in using ABS publications to track impacts and how these lags differ by data series.
ABARES March 2020 Agricultural commodities reports the latest outlook for key commodities. According to ABARES, ‘Australia’s agricultural sector has been remarkably resilient in 2019–20 despite prolonged drought and widespread bushfires.’ High commodity prices mean that the value of farm production is expected to be $59 billion, despite extremely low rainfall (ABARES notes that rainfall across Australia’s wheat–sheep zone was in the lowest 10 per cent on record for two consecutive years in 2018 and 2019, the first time this has occurred since 1900, which is the earliest this statistic can be calculated). The report also notes that the 2019–20 summer bushfires are not expected to have had a significant impact on the agricultural sector overall, as the majority of Australia's agricultural production takes place outside the affected areas. Only an estimated 1.4 per cent of agricultural land in New South Wales was affected, and one per cent or less in Victoria and other states. However, smoke effects did represent a major setback for some regionally concentrated industries such as the apple industry around Batlow in NSW and the Adelaide Hills and Canberra wine regions. The report also stresses that COVID-19 represents ‘a significant short-term risk’ to regional demand for Australian exports. Since late January, Chinese demand for some agricultural imports has declined, including an immediate decline in demand for high-end exports such as rock lobster and wine. ABARES assumes that the effects of the outbreak will be temporary and will only have a limited impact from 2020–21 onwards.
The RBA chart pack for March is now available.
My apologies to readers if this one’s a bit grim, but I’ve received a few questions recently about the relative rates of mortality in Australia from diseases and other causes. Each year, the ABS publishes Causes of Death, Australia. The latest available numbers are for 2018 and can be found here. For reference, influenza and pneumonia was the 12th leading cause of death in 2018, with 3,102 deaths, mostly due to pneumonia. The previous year (2017) saw a worse flu season, with the 4,269 deaths due to influenza and pneumonia ranked ninth, and with 1,255 deaths due to influenza.
The latest BIS quarterly review has been published. Most of the focus here is on the world of payment systems, but the first chapter provides an overview of the financial market impact of COVID-19 through to late February.
Tyler Cowen distinguishes between ‘growthers’ and ‘base-raters’ in competing assessments of how bad COVID-19 will get.
The Fed’s Lael Brainard considers monetary policy strategies when inflation and interest rates are already very low. Related, the Peterson Institute’s David Wilcox on what the Fed should do to get ready for the next recession.
An interesting FT Big Read from John Plender, arguing that even in a world of very low interest rates, record high debt levels mean that the coronavirus increases the risk of a credit crunch. (Plender draws on the recent OECD report on corporate debt highlighted in last week’s readings.) Also available via the AFR, here.
A detailed piece in the WSJ looking at Apple’s China-dependency as COVID-19 delivers the company’s third major setback in the market (following US-China trade wars and disappointing iPhone sales). The benefits that China offers in terms of a ‘stable, efficient, low-cost manufacturing base with an abundant network of suppliers’ will be hard to replicate elsewhere, although rival Samsung has been able to relocate a large share of its smartphone manufacturing to Vietnam, India and South Korea.
John Naughton worries that we’re sleepwalking into a world without privacy.
Joe Nocera on the recently deceased Jack Welch and his impact on American capitalism. For a more positive take, here’s the HBR on Welch’s approach to leadership.
The March 2020 edition of the IMF’s Finance and Development magazine focuses on demographics and economic well-being, including pieces on demography and economic growth, Japan’s shrinkonomics and the consequences of longer and more productive lives for the ‘rules of aging.’ There’s also a primer on central banks and negative interest rates.
The Conversable Economist has some thoughts on sumptuary laws and plastic bags.
Finally, Australia is not the only country to have suffered a toilet roll panic.
Latest news
Already a member?
Login to view this content


