

 This product has already been purchased.


Overview
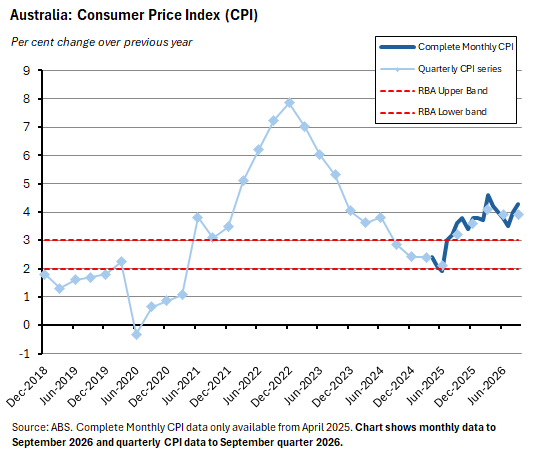
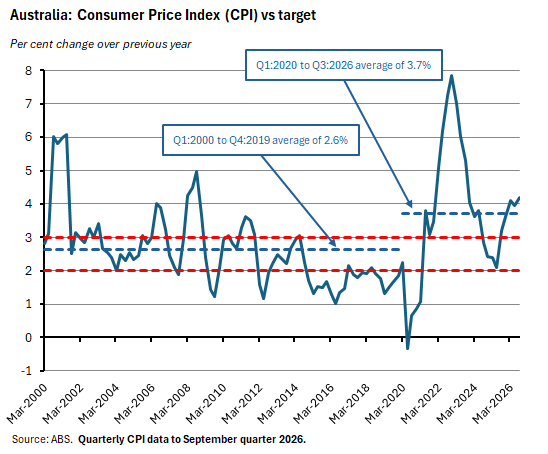
- Headline CPI inflation rose to 4.3% last month, up from 4% in August 2026 and above market expectations for a 4.2% print.
- The RBA’s preferred measure of underlying inflation – the quarterly version of the trimmed mean – rose 1% over the September quarter to be up 3.7% over the year. Again, that was stronger than the consensus forecast (3.6%) and above the previous result (3.6% in the June quarter).
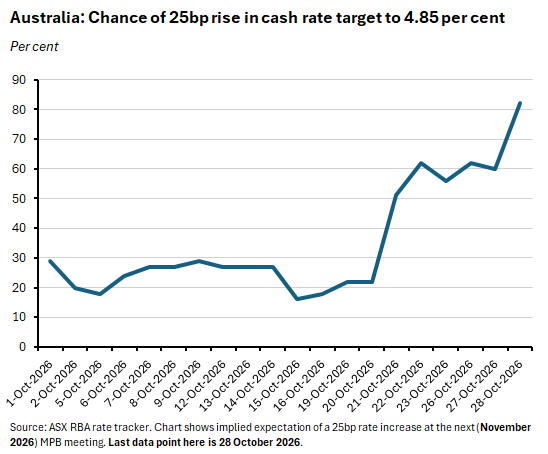
- The Monetary Policy Board (MPB) is likely to deliver another 25bp increase in the cash rate target next week. At the time of writing, market pricing was putting the probability of a November hike at more than 80%.
- Much of Australia’s current inflation problem represents supply-side factors from overseas (higher input costs due to the war in the Middle East) and at home (lacklustre productivity growth and hence a binding speed limit for the economy). While monetary policy can address the symptom of high inflation by squeezing demand, it can do little to address the underlying challenges.
Australia’s headline inflation rate rose to 4.3% last month, keeping inflation above the top of the target band for 14 consecutive months. Including July 2025’s 3% result, inflation has been at or above the top of the band for 15 consecutive months. At the same time, the RBA’s preferred measure of price pressures in the economy, the quarterly trimmed mean, rose 1% over the quarter to be up 3.7% over the year. Both outcomes came in above the corresponding consensus forecasts and both are consistent with recent RBA messaging highlighted last week to the effect that the inflation outlook now ‘looks materially worse’ than the central bank had anticipated in August this year.
As a result, another 25bp rate hike looks to be the most likely outcome from next week’s Monetary Policy Board (MPB) meeting. That would take the cash rate target up to 4.85%.
We dig into the new inflation numbers below, review the implications for the RBA, and offer some thoughts on why the current environment is proving particularly awkward for monetary policy. There is also the regular roundup of suggestions for further reading and listening.
Finally, a quick note to acknowledge that the LinkedIn version of The Economic Weekly achieved more than 60,000 subscribers this week. Sincere thanks to everyone who has subscribed.
Headline inflation rose to 4.3% in September
The ABS said that Australia’s Consumer Price Index (CPI) rose 4.3% over the year to September 2026. That result was above August’s 4% rate as well as stronger than the market consensus forecast for a 4.2% print. On a quarterly basis, headline inflation in the September quarter was unchanged from the June quarter at an annual rate of 3.9%.
According to the Bureau, the Housing group was the largest driver of annual inflation last month, rising by 5.2% over the year and contributing 1.1ppt to the headline rate. That in turn reflected a 4.7% rise in the New dwelling purchases sub-group, which the ABS attributed to builders passing on higher costs for materials and labour, as well as a 12.8% rise in electricity costs that was largely due to the ending of Commonwealth electricity rebates.
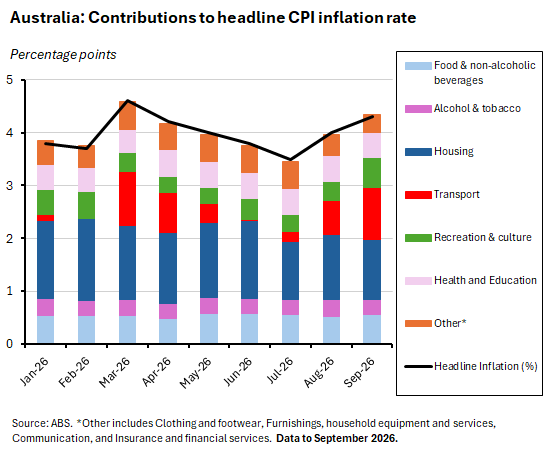
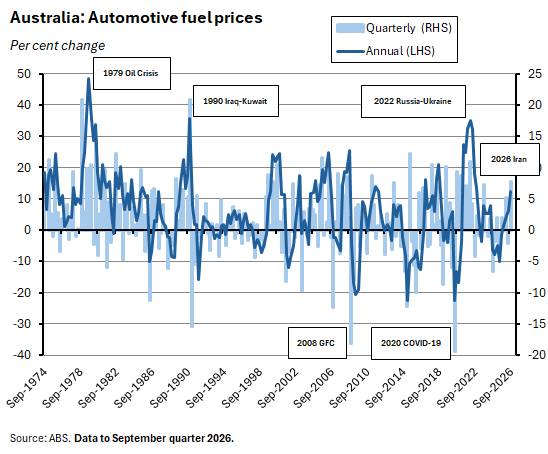
The second largest contribution (adding 0.99ppt) to annual inflation came from the Transport group, which rose 8.7% over the year. Here, Automotive fuel was the key driver, as higher world oil prices saw fuel prices jump 9.4% over the month to be 23.6% higher over the year.
Annual underlying inflation as measured by the monthly version of the trimmed mean was 3.6% in September, up from a (downwardly revised) 3.5% in August and in line with the consensus forecast.
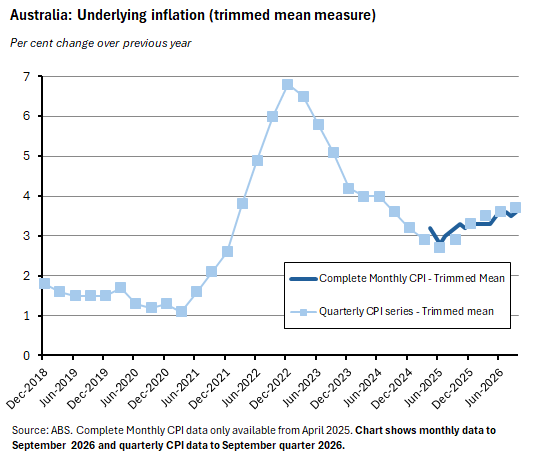
Using the RBA’s preferred quarterly version of the trimmed mean measure, however, year-ended underlying inflation picked up from 3.6% in the June quarter to 3.7% in the September quarter. That was stronger than the market consensus, which had anticipated another 3.6% result.
In summary, both the monthly and quarterly headline and underlying inflation measures continue to tell a story of inflation remaining stubbornly above target, even where the rates did not increase. That story is also consistent with other analytical measures of inflation.
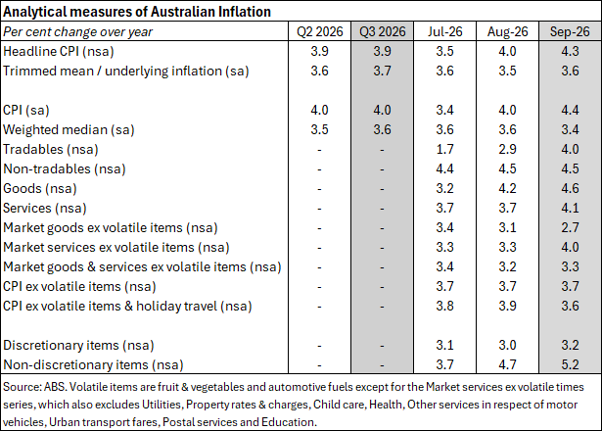
Tradables inflation picked up markedly to 4% in September from 2.9% in August, in line with goods inflation climbing from 4.2% to 4.6% over the same period. At the same time, non-tradables inflation remained stubbornly elevated at 4.5% last month while services inflation accelerated from 3.7% in August to 4.1%. And importantly for cost-of-living pressures, the rate of price increase for non-discretionary (that is, essential) items rose from an already high 4.7% in August to 5.2% in September. And while the year-ended monthly version of the weighted median measure ticked down from 3.6% in August to 3.4% in September, on a quarterly basis the year-ended rate edged up from 3.5% in the June quarter to 3.6% in the September one.
The RBA is likely to tighten policy in response
Last week we noted the increasing probability of another 25bp rate hike emerging from the upcoming 2-3 November 2026 Monetary Policy Board (MPB) meeting. This week’s inflation numbers make that outcome even more likely, with market pricing having adjusted accordingly. At the time of writing, market pricing implied a probability of more than 80% for another rate increase.
The next MPB meeting will also bring the release of a new Statement on Monetary Policy (SMP) from the central bank, along with updated forecasts for the inflation outlook. The August 2026 SMP had expected headline inflation to slow from 3.9% in the June quarter of this year to 3.6% in the December quarter before easing further to 2.6% by the December quarter 2027 and then return to just below the middle of the inflation target band (2.4%) by the June quarter 2028. The near-term inflation outlook has since become more challenging.
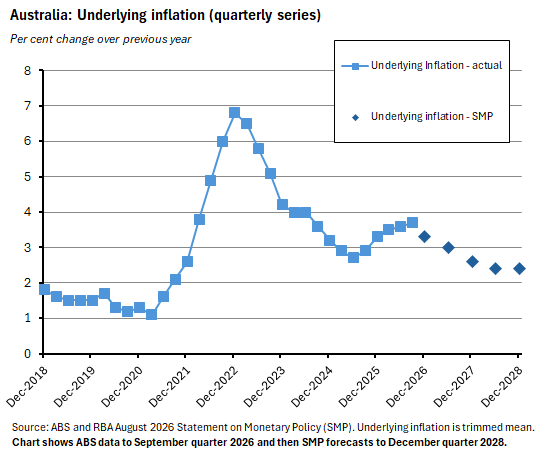
Those August SMP inflation projections were also conditioned on the assumption of a flatter trajectory for the cash rate target, based on market pricing at the time. The target was assumed to end this year at 4.4%, to peak in the June quarter 2027 at around 4.5% and to still be at 4.5% by the December quarter 2027.
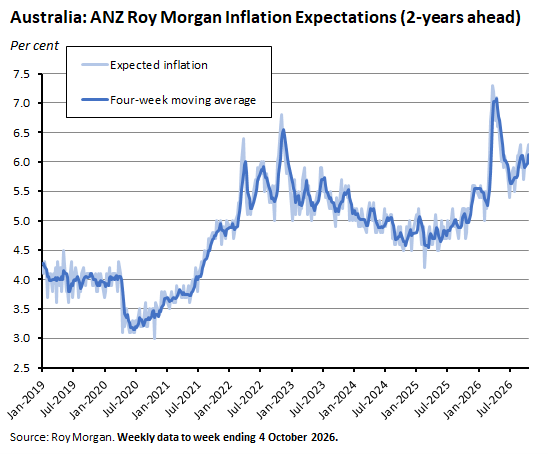
In recent weeks, Martin Place has also signalled that it is increasingly concerned that sustained above-target inflation is becoming embedded in short-term inflation expectations, a risk which further adds to the pressure for a fifth rate hike in the current monetary policy tightening cycle.
These are challenging times for monetary policy
Over the period between the March quarter 2000 and the December quarter 2019, the headline inflation rate averaged around 2.6%, close to the mid-point of the RBA’s target range. In contrast, between the March quarter 2020 and the September quarter of this year, headline inflation has averaged an above-target 3.7%.
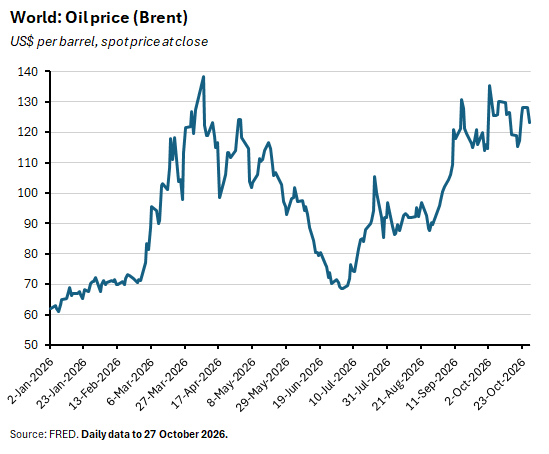
Much of this deterioration in performance can be explained in terms of a more complicated operating environment. Since the start of the current decade, the Australian economy has been buffeted by four major adverse global supply shocks. First came the COVID-19 pandemic with its lockdowns and supply chain disruptions that later fed into the subsequent re-opening shock. Then came the Russian invasion of Ukraine and the accompanying shocks to food and energy markets. That was followed by the trade policy shock of 2025 triggered by ‘Liberation Day’ and its messy aftermath. And this year has seen the Iran War, the closure of the Strait of Hormuz, and another sharp rise in energy prices which has left oil prices stuck at above US$100/b.
As we’ve noted before, adverse supply shocks tend to be bad news for monetary policy authorities. By simultaneously putting upward pressure on costs and prices and downward pressure on activity, they require policymakers to make uncomfortable trade-offs.
Further, monetary policy can do little to address the source of the problem – higher rates will not re-open the Strait of Hormuz or conjure forth more diesel supplies. Indeed, by driving up the cost of borrowing and squeezing activity, tighter monetary policy may weaken the incentives needed to stimulate investment to generate alternative sources of energy.
The larger challenge for the RBA is that we now seem to be operating in a new era of more frequent adverse supply shocks. There is more geopolitical instability (the wars in Ukraine and the Persian Gulf); more geopolitical fragmentation (tariff hikes, trade wars, and pressure to reconfigure or diversify supply chains). There are also more impacts from climate change (for example, drought-related disruptions to the Panama Canal and to European river freight transport) and more populist politics (the backlash to globalisation and rising opposition to migration). Alongside these pressures is the need to adjust to ongoing demographic change (leading to shrinking working age populations).
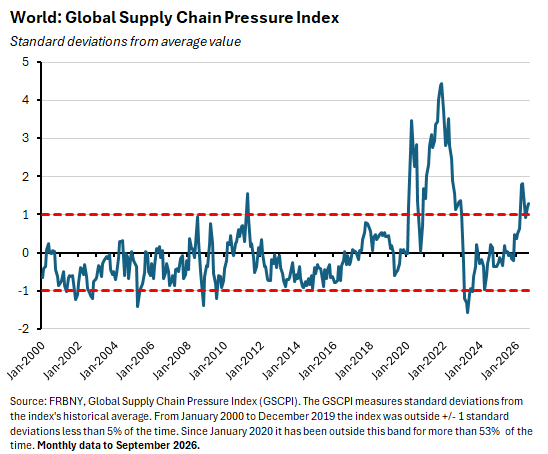
One symptom of this shift in the external environment can be seen in the NY Fed’s Global Supply Chain Pressure Index (GSCPI) which combines data on transportation costs and manufacturing indicators. Between January 2000 and December 2019, the GSCPI was outside +/- one standard deviation from its historical average for less than 5% of the time. Since January 2020 it has been outside this band about 53% of the time, suggesting a period of unusually volatile supply conditions.
Complicating the picture still further is that in addition to these negative supply shocks, the world economy is currently also undergoing a positive demand shock in the form of a major AI-driven investment boom. While this has been good news for global economic activity by offsetting the negative effects on activity of the energy shock via higher capex and the associated trade flows, it has also served to further exacerbate inflationary pressures.
One further complication is that not all of Australia’s inflation problem is imported. A lacklustre domestic supply side – manifested in the form of a dismal productivity performance over recent years – has imposed a low ceiling on our sustainable rate of economic growth. That means external cost and price shocks are running into domestic capacity constraints. And here again, monetary policy is ill-suited to fixing the underlying problems.
Other Australian data points to note
Last Friday, the ABS released the annual Australian System of National Accounts. The Australian economy grew 2.3% in real terms in 2025-26, up from 1.6% in 2024-25. Real GDP per capita rose by a modest 0.8% after stagnating the year before; and productivity (real GDP per hour worked) was up 0.5% after having declined in each of the three years from 2022-23 onwards. In current price terms, total GDP rose to $2.9 trillion while GDP per capita increased to $105,717.
The ABS said that Australia’s export price index rose 1.4% in the September quarter to be up 6.3% over the year. Over the same period, the import price index fell 1.1% quarter-on-quarter but was still 5.5% higher over the year.
Australia’s Energy Account for 2024-25 reports that exports of physical energy fell 3.1% to their lowest level in 10 years, with declines for black coal (down 1.1%) and LNG (down 2.2%). At home, energy net use by industry was down 1.2% while use by households was up 0.3%. According to the ABS, over the past 10 years, energy use per person has now fallen 16% as population growth has outpaced energy use.
ABS data on barriers and incentives to labour force participation in Australia reports that in 2025-26, of the more than 19 million people aged 18 to 75, some 14.1 million were employed or had a job to start or return to. Of those who did not have a job, 1.2 million people wanted work, of whom 1 million were available to either start immediately or within 4 weeks; 1.9 million (who were not retired or unable to work) did not want a job; and 2.1 million were retired or permanently unable to work.
Further reading and listening
- Free Webinar - The Stagnant Nation: Reviving Australia's economic dynamism
Join me in conversation with Catherine Livingstone AC, Philip Moffitt and Adam Triggs on Thursday, 12 November, as we discuss Australia’s productivity challenge, the barriers to change, opportunities for reform, and the path towards long-term prosperity. For more information and to register, head to the AICD website. - The opening statement of RBA Governor Michele Bullock to the Senate Economics Legislation Committee warns that inflation will likely be higher than the central bank expected back in August, and cautions that due to a mix of persistent domestic capacity pressures and global cost pressures, it is likely to remain elevated for some time. Also from the RBA, Assistant Governor (Economic) Sarah Hunter’s interview on 60 Minutes.
- Treasury Secretary Jenny Wilkinson’s opening statement to the same Senate Committee looks ahead to the MYEFO and notes that ‘Significant uncertainty will remain while the conflict in the Middle East is unresolved and as AI development continues to unfold at pace. The range of possible outcomes is unusually broad: energy disruptions could persist, financial conditions could tighten further, and the scale and timing of AI‑related investment and productivity gains remain difficult to judge. Overall, we are expecting growth to slow and there are downside risks to our Budget outlook.’
- The e61 Institute considers the implications of switching the GST-income tax mix.
- The Lowy Interpreter on Australia’s $30 billion military base boom.
- Snowy Hydro’s cost blowout and the lessons for other megaprojects.
- On the relationship between the NDIS and autism diagnoses.
- According to Jobs and Skills Australia’s latest Occupation Shortage List (OSL), 27% of assessed occupations are in national shortage this year. That is down 2ppt from the 2025 result (29%) and 9ppt below the 2023 peak (36%).
- What did we learn from Anthropic’s IPO filing this week? Takes from the FT, WSJ, and the Economist.
- Torsten Slok at Apollo sees no signs of any AI payoff outside the tech sector.
- New editions of the BIS Bulletin look at building AI on credit and chokepoints in global supply chains.
- The Economist magazine examines the (methodological) fight over the China shock and investigates the winners and losers of Trumponomics.
- Related, Greg Ip in the WSJ on how tariffs became the most hated word in US politics.
- Is Canada decoupling from the United States?
- On the future of the US dollar system and lessons from the previous sterling-dollar shift.
- The outlook for global insolvencies.
- An FT Big Read sets out the winners and losers of the weight-loss economy.
- The OECD’s Environment at a glance Indicators.
- EMBER on the surge in EV fleets in response to the Iran war.
- A look back at France’s long history of revolt.
- The FT’s Unhedged podcast asks, how much is Anthropic really worth?
- The Odd Lots podcast digs into AI Agents, prices, and the history of price gouging.
- Bloomberg Australia discusses data centre hype and reality in a short podcast.
Latest news
Already a member?
Login to view this content