The Westpac-Melbourne Institute index of consumer sentiment jumped 18 per cent in September, while the weekly ANZ-Roy Morgan index also rose over the past week.
According to the most recent payrolls data, jobs fell by two per cent in Victoria over the month to 22 August, while for the rest of Australia they were up 0.1 per cent. The June Quarter labour account showed a record decline in job numbers, with the number of filled jobs slumping by 932,400 (6.4 per cent) to 13.6 million. Business conditions declined in August, but business confidence improved. The monthly rate of increase in the ANZ measure of Australian Job Ads slowed to just 1.6 per cent last month. New lending for housing rose in July and retail turnover also increased over the same month.
This week’s readings include new data on Australia’s foreign affiliates, our looming construction cliff, revisiting the 2017 Foreign Policy White Paper, a farewell to the old model of central banking, the pandemic and statistics, the coming global technology fracture and the threat of a ‘Napster moment’ for the events industry.
What I’ve been following . . .
What happened:
The Westpac-Melbourne Institute Index of Consumer Sentiment jumped 18 per cent in September, rising from 79.5 in August to 93.8 this month.
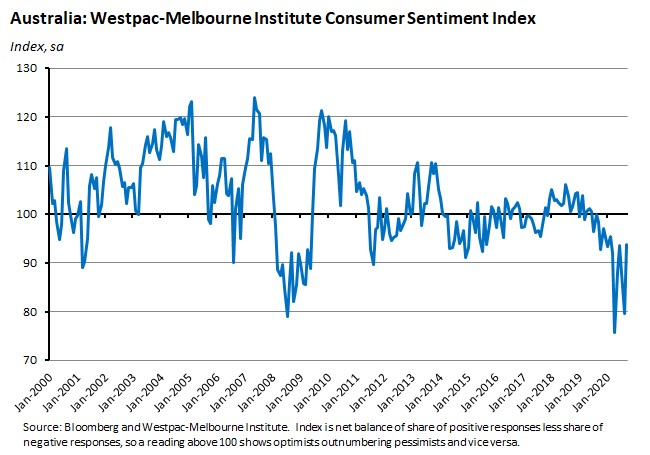
All five sub-indices increased this month with the biggest increases coming in ‘economic conditions next 12 months’ (up 41 per cent over the month), economic conditions next five years (up 18.9 per cent) and ‘time to buy a major household item’ (up 16.3 per cent. There were also significant increases for the other two sub-indices with ‘family finances vs a year ago’ and ‘family finances next 12 months’ both up 11.2 per cent. In annual terms, however, although three of the sub-indices were up relative to their September 2019 readings, ‘economic conditions next 12 months’ (down 18.3 per cent) and ‘time to buy a major household item’ (down 12.1 per cent) were much weaker than last year’s reading.
Why it matters:
This month’s big bounce means the Index is now just 1.6 per cent below the average recorded over the six months prior to the onset of the pandemic in March. That suggests that better public health news out of Victoria has helped confidence rebound. And consistent with the ANZ-Roy Morgan Weekly reading discussed below, it also suggests that survey respondents treated last week’s Q2 GDP result as the backward-looking indicator it was and didn’t let the formal onset of Australia’s first recession in almost three decades affect their assessment of current conditions.
Westpac economists suggest comparing September’s sentiment results with the index reading in June, when states were in the process of re-opening and Victoria’s second wave had yet to emerge. The national index back then was at 93.7, or just below this month’s result, while on a state by state basis, confidence in September was at its June level in NSW; 5.6 per cent below its June level in Victoria; two per cent above in Queensland; 11.2 per cent above in Western Australia and 3.8 per cent above in South Australia.
What happened:
The ANZ-Roy Morgan weekly measure of consumer confidence rose one per cent to an index value of 91.1 for 5/6 September.
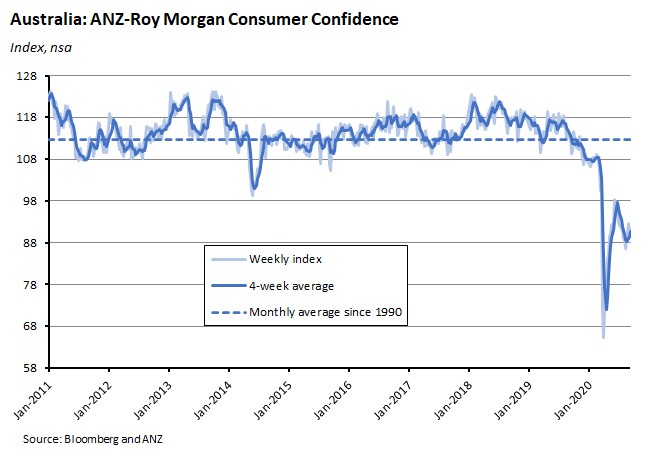
The increase in the overall index was driven by a 4.1 per cent bounce in the ‘future economic conditions’ sub-index and a 3.9 per cent increase in the ‘time to buy a household item’ index. Partially offsetting those gains were declines in the other three sub-indices: ‘current economic conditions’, ‘current finances’ and ‘future finances’, with the biggest fall suffered by ‘future finances’ which was down two per cent.
Why it matters:
After falling in the previous week, consumer sentiment recovered last week, suggesting that – as was the case with the monthly Westpac-Melbourne Institute Survey discussed above – households looked through the Q2 GDP numbers and the news that Australia was ‘officially’ in recession (hardly a surprise of course, given the run of partial economic indicators) to focus on the outlook. In that context, ANZ economists noted that the jump in the ‘future economic conditions’ sub-index could indicate that a growing share of respondents now judge that the economic situation is close to bottoming out, a possibility also consistent with the fact that sentiment in this particular category is currently close to the neutral index level of 100.
What happened:
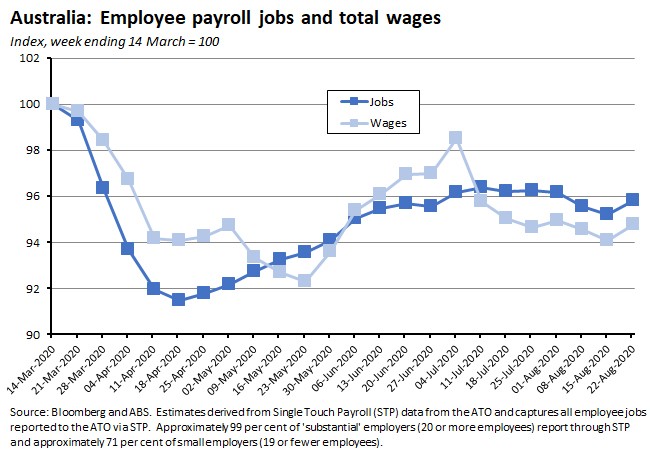
According to the ABS, between the week ending 14 March 2020 (the week Australia recorded its 100th confirmed COVID-19 case) and the week ending 22 August 2020, the number of payroll jobs decreased by 4.2 per cent while total wages decreased by 5.2 per cent. Over the most recent fortnight of data, between the weeks ending 8 August and 22 August, payroll jobs nudged up 0.3 per cent while total wages rose 0.2 per cent.
By state, since the week ending 14 March 2020, the largest losses in payroll jobs were in Victoria (down 7.9 per cent), Tasmania (down 4.1 per cent) and the ACT (down four per cent). The smallest losses have been in Western Australia (down one per cent) and the NT (down 1.1 per cent).
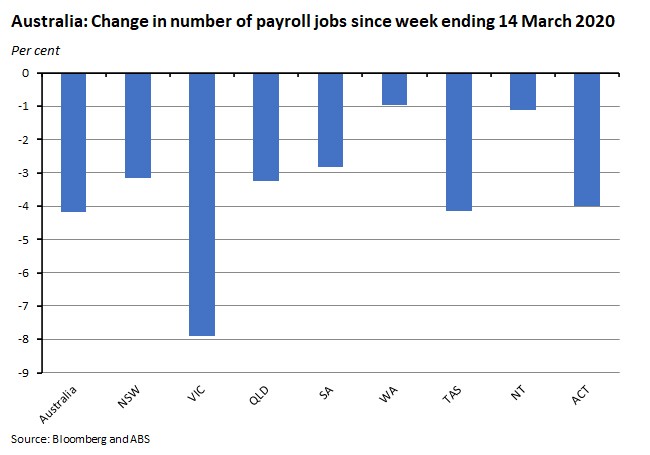
Over the period between the weeks ending 8 August and 22 August, Victoria was the only state to suffer a decline in payroll job numbers (down 0.7 per cent).
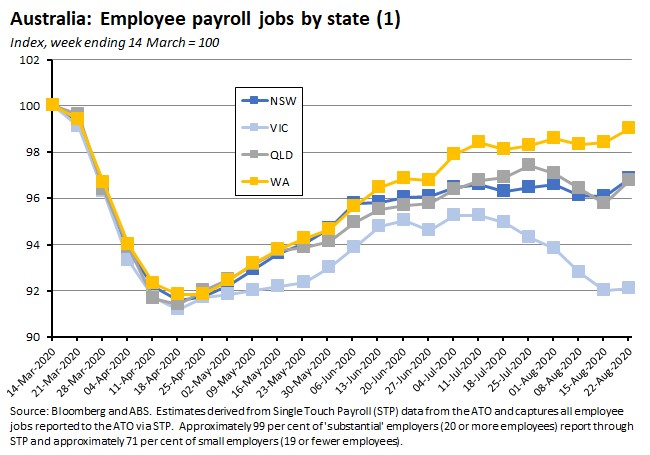
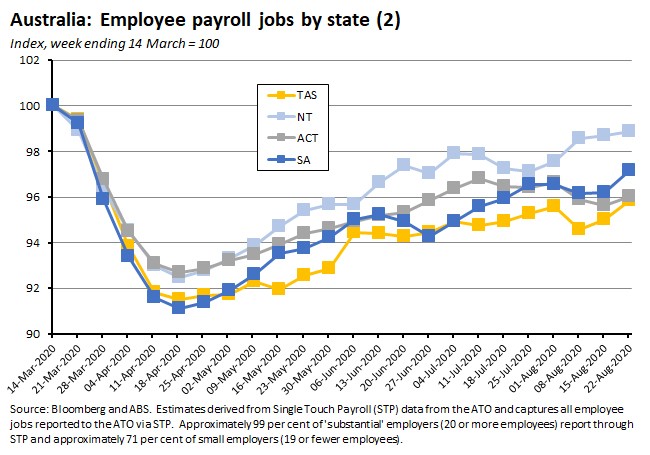
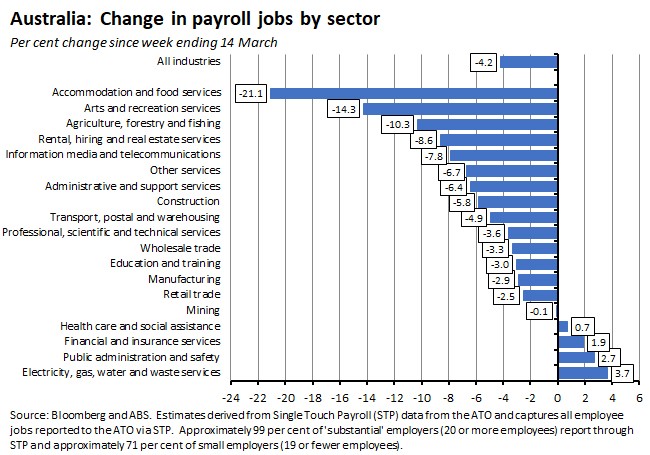
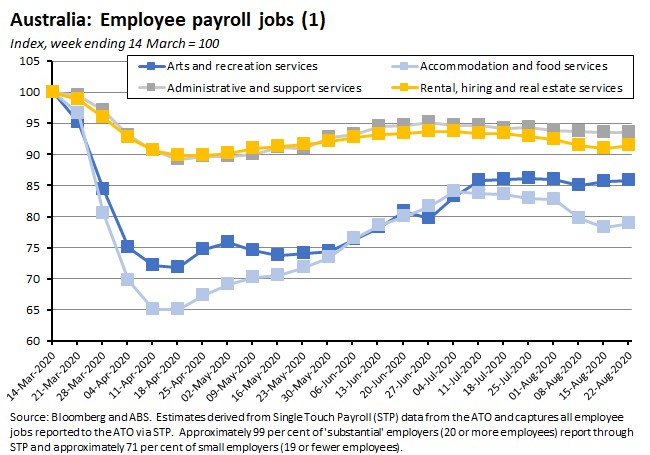
By industry, since the week ending 14 March 2020 the largest payroll jobs losses have been suffered by accommodation and food services (down 21.1 per cent) and arts and recreation services (down 14.3 per cent). Other sectors that have also experienced large declines include agriculture, rental hiring and real estate services, and information media and telecommunications services. Just four industries have added jobs over this period.
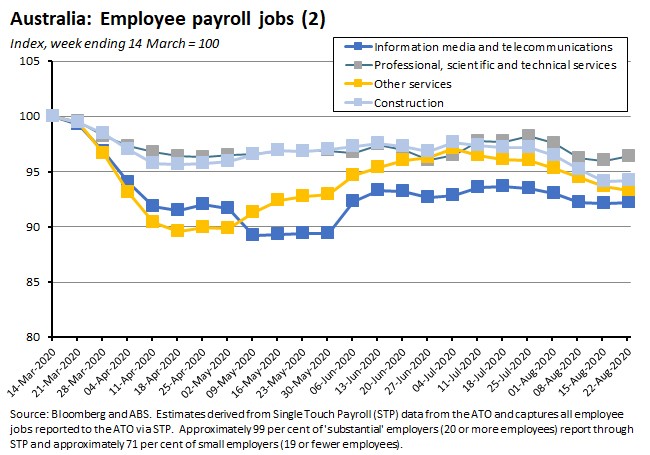
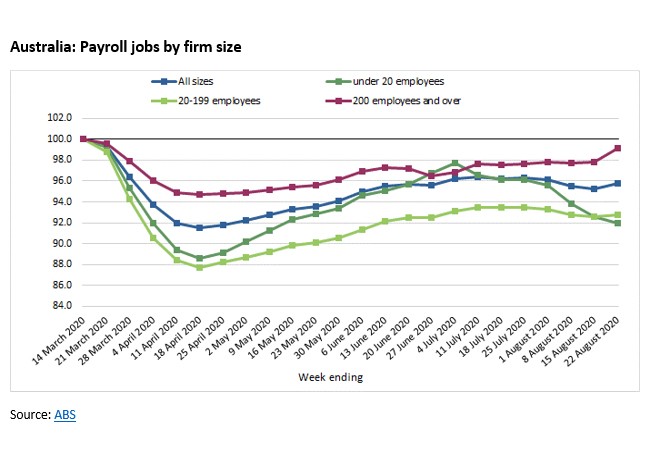
The ABS also released some new experimental estimates looking at payroll job numbers by firm employment size. These showed that job losses have been concentrated in small and medium sized enterprises.
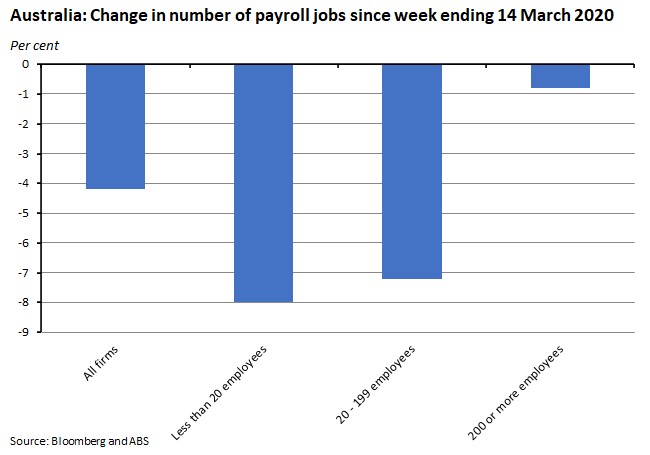
While the scale of job loss in small and medium sized firms is similar, however, the pattern of that job loss over time differs quite significantly.
Why it matters:
Subject to the usual caveats around the nature of the payroll jobs data, including the absence of any seasonal adjustment and the data’s susceptibility to quite substantial revisions, this latest set of figures again indicate that the overall pace of labour market recovery remains slow. That said, there were some encouraging signs of an uptick in the most recent weekly number, but the volatility of the series suggests we should wait to see if that is sustained in the next release. The impact of Victoria’s lockdown continues to shape the data. Over the month to 22 August, payroll jobs across Australia fell by 0.4 per cent. But while payroll jobs fell by two per cent in Victoria, in the rest of Australia they rose 0.1 per cent. Similarly, while national payroll jobs as of 22 August were still 4.2 per cent below their mid-March level, payroll jobs in Victoria were 7.9 per cent down compared with 2.9 per cent for the rest of Australia.
What happened:
The ABS published the June quarter 2020 labour accounts. The number of filled jobs in Australia decreased by 932,400 (6.4 per cent) to 13.6 million in seasonally adjusted terms over the quarter, with main jobs down by 739,000 (5.5 per cent) and secondary jobs down by 193,400 (19.6 per cent). (Note 1: Total jobs is the sum of the number of filled jobs and the number of job vacancies. Filled jobs refer to all positions of employment that are currently filled (including self-employment) while a job vacancy is an unfilled job that an employer intends to fill either immediately or in the near future.)
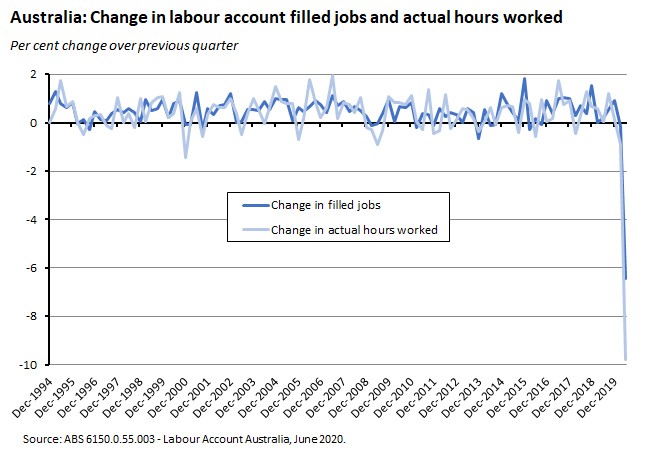
The number of public sector jobs decreased by 1.9 per cent in Q2, while the number of private sector jobs decreased by 7.1 per cent. Hours actually worked over the quarter decreased by 527.3 million hours (9.8 per cent) to 4.9 billion hours. Average hours actually worked per job fell 3.6 per cent.
The number of job vacancies plummeted by 42.1 per cent over the quarter and was down 43.3 per cent on the same quarter last year. Vacant jobs accounted for just 0.96 per cent of all jobs in the June quarter, the lowest share since March 2002.
The labour account data also show total labour income fell $1,657 million over the June quarter. At the same time, there was a 5.1 per cent increase in average labour income per employed person to $20,259 as the composition of jobs shifted towards higher-paid activities.
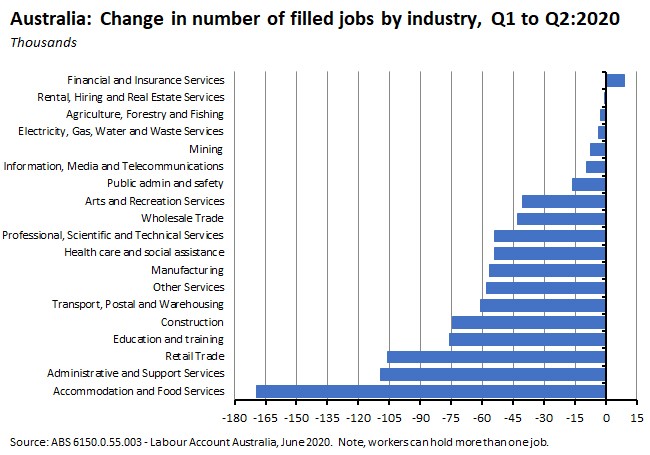
By industry, the biggest job losses occurred in accommodation and food services (more than 169,000 jobs lost accounting for more than 18 per cent of total job losses over the quarter), administrative and support services (more than 109,000 jobs and almost 12 per cent per cent of total job losses), retail trade (more than 105,000 jobs lost and around 11 per cent of job losses), education and training (76,000 lost jobs and a bit more than eight per cent of job losses) and construction (almost 75,000 jobs lost and about eight per cent of job losses). Collectively, those five industries accounted for more than 57 per cent of all jobs lost over Q2. The only industry to add jobs was financial and insurance services (a rise of nine thousand jobs).
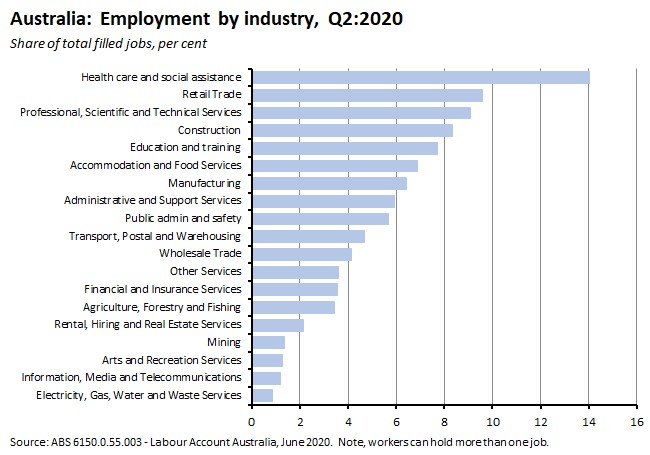
In terms of the distribution of the remaining total filled jobs, five industries were each the source of one million or more filled jobs: health care and social assistance (1.9 million filled jobs or 14 per cent of total filled jobs), retail (1.3 million jobs or 9.6 per cent), professional services (1.2 million or 9.1 per cent), construction (1.1 million or 8.4 per cent) and education and training (about one million or 7.7 per cent).
(Note 2: According to the ABS, the Labour Account is the best source of headline information on employment by industry and sector. It differs from the monthly Labour Force Survey which is mainly designed to measure the labour force status of the population (that is, whether people are employed, unemployed or not in labour force) and their key demographics. In part, the difference is because the employment classification in the Labour Account is generally drawn from how businesses have been officially categorised, rather than how employed people (most of whom are employees) describe the business they work in. The Labour Account shows that there are a number of people in the labour market who, when responding to the Labour Force Survey, describe the business activities that are most relevant to their job, rather than the actual industry of the business that pays their wages or salary.)
Why it matters:
The Q2 labour account numbers confirm the story already told by the labour force survey and payroll data regarding the scale of job losses over the June quarter of this year, while the collapse in the number of job vacancies is a powerful indicator of the challenges facing the newly unemployed. The data also provide a definitive breakdown of job losses by industry, highlighting the huge job losses in accommodation and food services along with the outsized declines in administration and support services and retail trade as well as the sizeable across most other industries.
What happened:
The NAB monthly business survey for August showed business conditions falling six points to an index level of minus six index points. On the other hand, business confidence rose six points to minus eight index points.
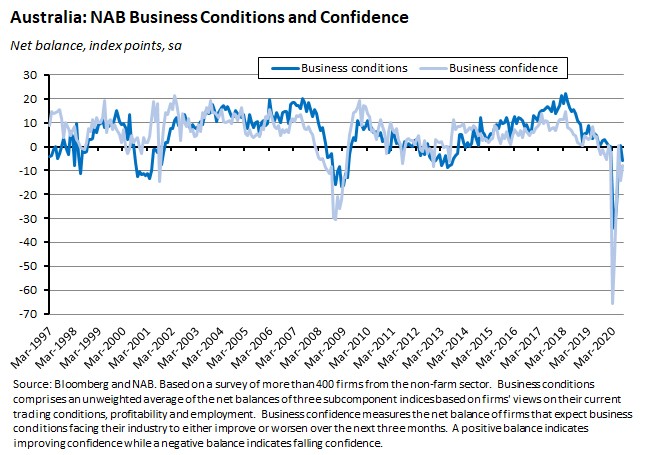
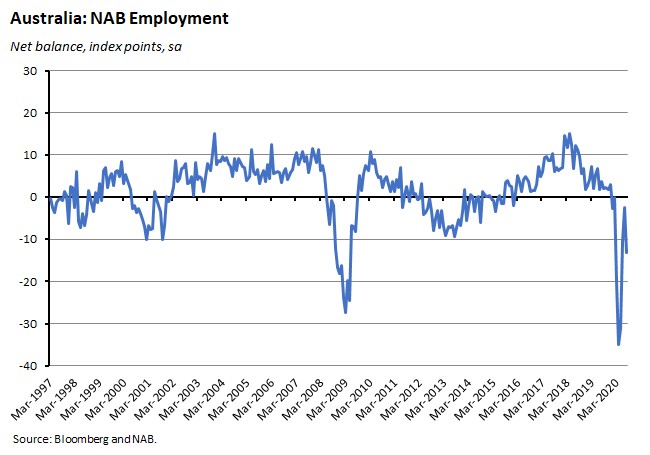
The decline in business conditions was driven by an 11-point fall in the employment index, along with smaller falls in trading (down three points) and profitably (down four points) indices.
According to NAB, business conditions fell sharply in mining, manufacturing and recreation and personal services in August, while wholesale saw a more modest decline. Construction, retail and finance, business and property services saw an improvement. Overall, conditions remain most favourable in retail, followed by wholesale. Conditions are negative in all other industries, with mining, construction and recreation and personal services the weakest.
By state, business conditions declined everywhere except NSW which edged higher. As expected, weakness was evident in Victoria, but NAB points out there were also weak readings for Queensland, Tasmania and South Australia, where conditions fell sharply. Overall, conditions are weakest in Queensland and Victoria while Tasmania and Western Australia are the only two states in positive territory.
Both capacity utilisation and forward orders fell in August.
Why it matters:
The intensification of lockdown in Victoria had been expected to dent business conditions in August (Stage 4 restrictions in metropolitan Melbourne and stage 3 restrictions in regional Victoria took effect from 5 August), so the overall drop in the business conditions index was not a surprise. What was surprising was that the fall in conditions in Victoria was less than the decline suffered in Queensland, Tasmania and South Australia.
While current conditions deteriorated, confidence improved in August, although it remained in negative territory and other forward-looking indicators (capacity utilisation, forward orders) went backwards over the month.
Finally, the big drop in the employment index is bad news for the upcoming labour market report for August – a result that is also consistent with the disappointing August payroll numbers discussed above.
What happened:
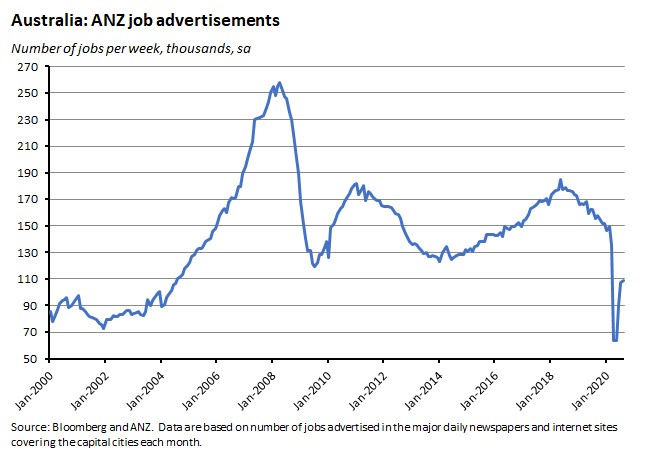
The ANZ measure of Australian Job Ads rose by just 1.6 per cent over the month in August and were down 30 per cent over the year.
Why it matters:
July had seen a solid 19.1 per cent leap in the number of job ads after an even more dramatic 41 per cent jump in June’s numbers but August’s result suggest that the pace of labour market recovery has now slowed.
ANZ economists pointed out that not only had new SEEK job ads in Victoria fallen as Stage 4 restrictions in Melbourne and Stage 3 restrictions in regional Victoria hit the labour market but that the improvement in New South Wales ads has also been sluggish compared with other parts of the country.
What happened:
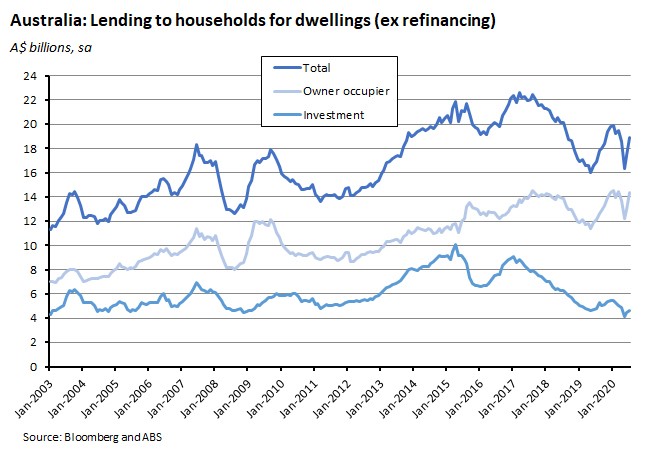
The ABS said the value of new lending for housing rose 8.9 per cent (seasonally adjusted) in July and was 11.8 per cent above the July 2019 outcome. Lending for owner-occupiers was up 10.7 per cent over the month and 18.5 per cent over the year while lending to investors rose 3.5 per cent relative to June but was down 5.1 per cent relative to July 2019.
New loan commitments for personal fixed term loans were up 6.9 per cent month-on-month but down 3.9 per cent year-on-year. The ABS also reported that lending to small and medium sized businesses fell in July after rising strongly in June (a pattern largely reflecting end of financial year effects, according to the Bureau). Note that as these new series have only been collected since July 2019, the ABS does not yet have enough data to produced seasonally adjusted estimates.
Why it matters:
After having fallen sharply in June, lending for dwellings bounced back in July with the month’s rise in owner occupier home loan commitments the largest month-on-month increase in the history of the series. The snap back in July reflects the easing of social distancing restrictions in most states and territories, with new loan commitments for owner occupier housing up in all states and territories except for the ACT. (Note that although stay at home restrictions began for metropolitan Melbourne and Mitchell Shire on 8 July, Stage 4 restrictions in metropolitan Melbourne and stage 3 restrictions in regional Victoria only began on 5 August.)
What happened:
Last Friday, the ABS reported that retail turnover in July rose 3.2 per cent over the month (seasonally adjusted). In annual terms, turnover was up 12 per cent relative to the same month last year.
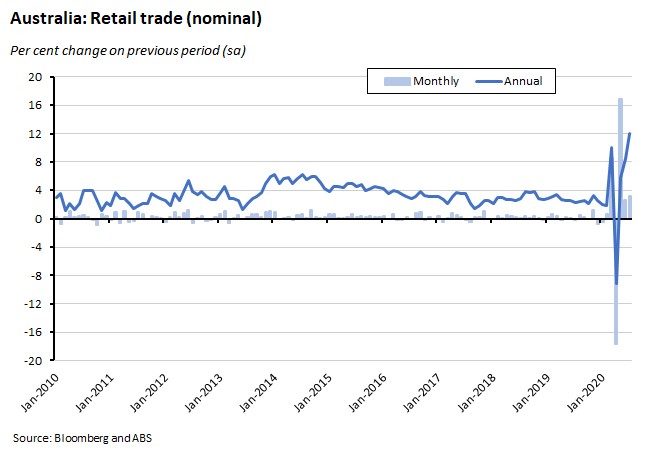
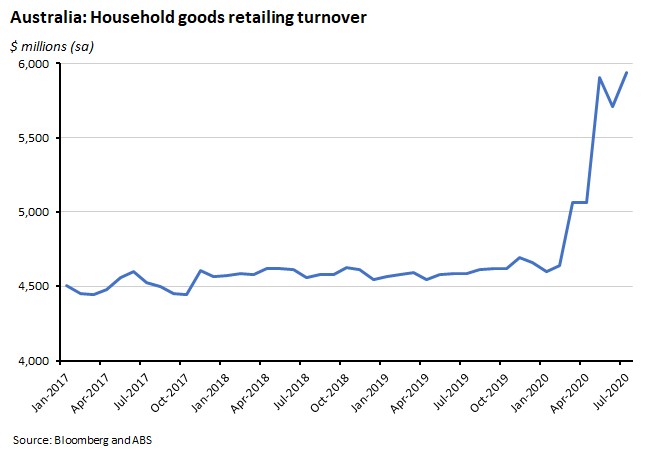
Monthly turnover rose in all industries: Household goods retailing (up four per cent), Other retailing (4.4 per cent), Cafes, restaurants and takeaway food services (4.9 per cent), Food retailing (1.2 per cent), Clothing, footwear and personal accessory retailing (7.1 per cent), and Department stores (four per cent).
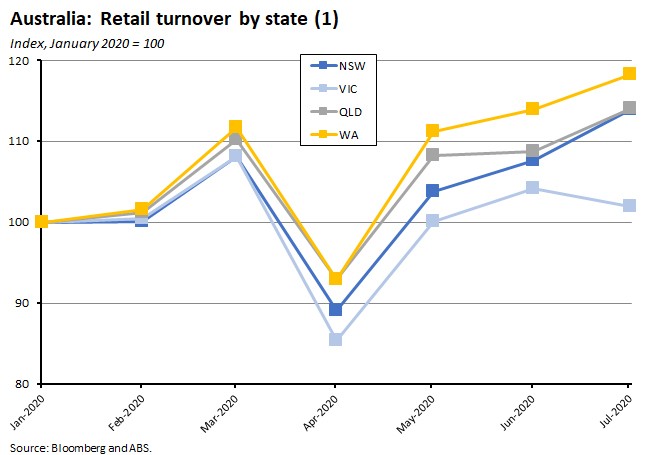
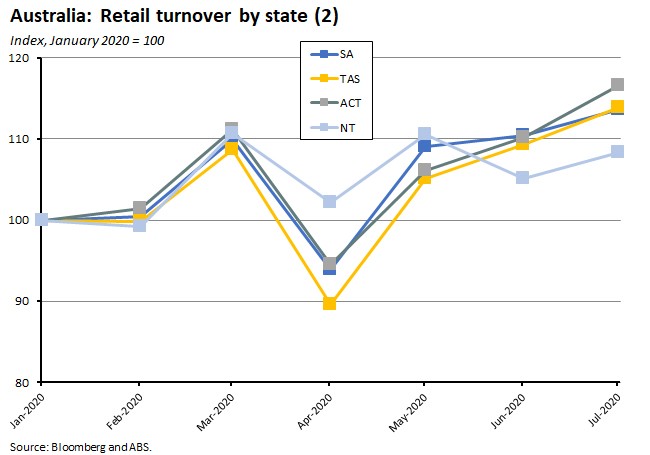
By state, there were monthly increases in New South Wales (5.9 per cent), Queensland (five per cent), Western Australia (3.8 per cent), South Australia (2.9 per cent), the ACT (5.8 per cent), Tasmania (4.2 per cent), and the NT (3.1 per cent). The exception was Victoria, where turnover fell 2.1 per cent.
Why it matters:
July’s final retail turnover number was broadly in line with the preliminary estimate of a 3.3 per cent monthly increase. It depicted a robust performance in sales across all industries and states with the marked exception of Victoria, where Stage 3 restrictions for Metropolitan Melbourne and Mitchell Shire had entered into force on 8 July. As noted in last week’s deep dive into the national accounts, income support in the form of JobKeeper, JobSeeker and other government payments have supported household incomes and propped up some key elements of spending. Unfortunately, the banks’ credit card data suggest that retail spending weakened in August as the move to a tighter lockdown in Victoria hit confidence.
Another feature of the July numbers is the continued divergence in patterns of household spending. For example, purchases on large household items have been strong and are now running well above pre-pandemic levels, with another big monthly increase in household goods retail turnover in July, reflecting a 9.6 per cent monthly increase for Electrical and electronic goods retailing and a 3.7 per cent increase for Furniture, floor coverings, houseware and textile goods retailing.
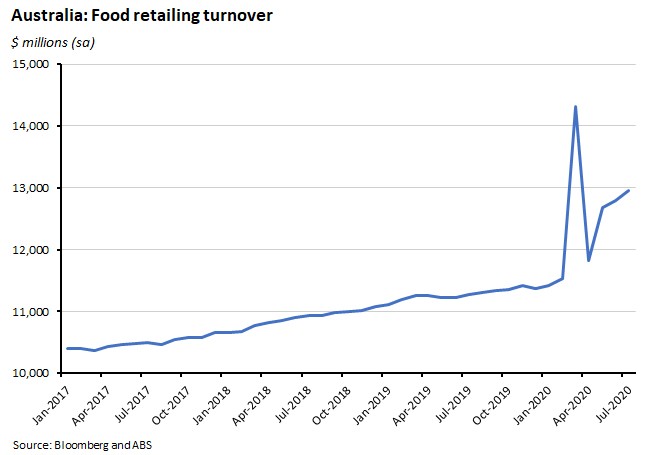
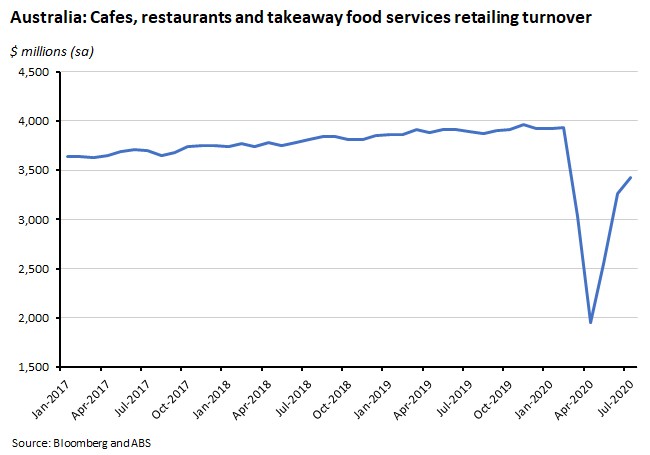
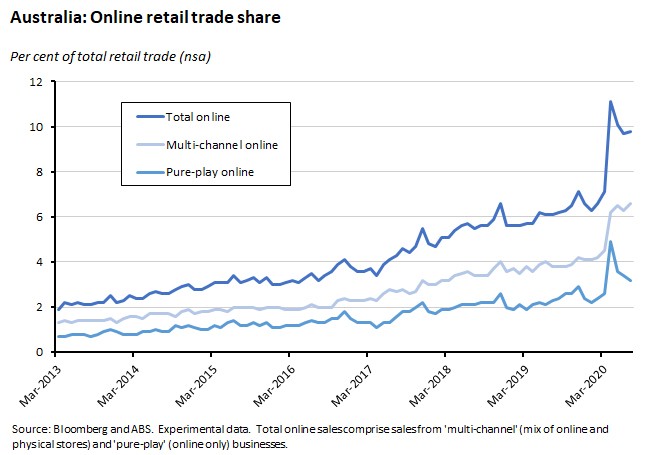
Finally, another shift in spending patterns that we’ve noted before is the rise in online spending where the pandemic appears to have accelerated what had been a more gradual transition. Online sales represented 9.8 per cent of total sales in July while total online retail turnover rose six per cent (seasonally adjusted) over the month and was a huge 72.5 per cent higher than in July 2019 (in the 12 months from March 2019 to February 2020, total online sales averaged growth of a bit more than 14 per cent).
What I’ve been reading
The ABS published new data on Australia’s Outward Foreign Affiliates. This showed that in 2018-19, there were 275 Australian parent enterprises with a controlling interest (that is, more than 50 per cent of the voting power in the direct investment enterprise) in 5,176 Australian owned foreign affiliates. Between them, those foreign affiliates employed 412,000 people and generated sales of goods and services of $213 billion.
The Department of Industry, Science, Energy and Resources has issued the latest version of its Australian Innovation System Monitor. This edition includes a COVID-19 page pulling together the ABS survey results on the impact of the pandemic on Australian businesses.
Two from the Grattan Institute. Brendan Coates and Matt Cowgill argue that the October budget should deliver extra stimulus of $100 billion to $120 billion. And John Daley and Rory Andersen describe an interesting analysis of the changing political appetite for reform based on Canberra’s shifting willingness to implement OECD recommendations over time. They find that ‘between 1984 and 2001 the overwhelming bulk of these recommendations were taken up by the Hawke and Keating governments, and by the Howard government in its first two terms. But from roughly 2003 onwards, the record is a lot more patchy: many more of the reforms recommended by the OECD have been either rejected, only partially implemented, or (in the case of carbon pricing) implemented and then unwound.’ They concede that this is an imperfect measure but argue that the message is consistent with the conventional view that ‘governments in the most recent 20 years have rejected many more significant reforms than governments in the 20 years before them.’
EY’s Jo Masters and Johnathan McMenamin worry about Australia’s looming construction cliff.
This PBO report on structural trends in GST finds that, since 2000, the tax has failed to keep up with economic growth. While GDP has expanded 180 per cent over this period, GST revenue has only risen 130 per cent, leading to a fall in the GST to GDP ratio. Explanatory factors are diverging trends in the price of goods and services, different treatments of household consumption in calculating GDP vs tax purposes (particularly relating to rent and education), a shift in the relative spending of younger demographics to GST-free items, and a relative decline in the importance of consumer spending in the economy. If these trends are sustained, the PBO suggests, the GST to GDP ratio will continue to decline, leading to a growing revenue shortfall for states and potentially increased pressure for greater Commonwealth transfers.
Richard Maude in the AFR suggests that changed circumstances warrant an update to the 2017 Foreign Policy White Paper.
John Quiggin wonders whether Australia’s WFH experiment will deliver the biggest productivity increase of the century.
PWC’s report on the economic impacts of COVID-19 on the City of Melbourne estimates that ‘compared to pre-COVID-19 forecasts, the City of Melbourne economy will be up to $23.5 billion – or 22 per cent - smaller in 2020. There will be a cumulative reduction of up to $110 billion in municipal economic output compared to pre-COVID estimates over the next five years. And over five years, there will be up to 79,000 fewer jobs than pre-COVID forecasts as an annual average.’ (See also the piece below on WFH and the hidden office economy).
Adam Tooze bids farewell to the ‘uniform central banking model of the 1990s’ arguing that what ‘is emerging is a hybrid assemblage that combines market mechanisms with massive intervention and seemingly limitless credit. Its Frankenstein quality is undeniable, but what kind of monster it is, remains to be seen.’
Tim Harford in the FT compares statistics as tricks vs statistics as tools and draws five lessons from the pandemic: (1) the numbers really matter; (2) but don’t take the numbers for granted and invest in the quality of the data; (3) while the data is invaluable unless we can overcome our own cognitive filters, it is not enough; (4) the best insights come from combining data with personal experience; and (5) everything can be polarised.
Eric Lonergan and Megan Greene make the case for dual interest rates, building on the ECB’s Targeted Longer-Term Refinancing Operation (TLTRO) programme, under which the ECB ‘began explicitly and separately targeting the interest rate on lending and the interest rate on deposits’ but arguing that it could be taken much further.
The Economist magazine on how economics is rethinking the relationship between culture, wealth and poverty.
Is the event industry facing its Napster moment? Zoom could be for the event industry what Napster was for the music industry, as ‘the ease with which you can put on good-enough virtual events with a global audience, almost for free, much to the undercutting of the underlying economics of the physical events world. All types of business event — conferences, trade shows, conventions — are in danger of their revenues streams of tickets, sponsorships, memberships, and other types of fees being eroded as the world gets used to digital formats and alternatives emerge to physical networking, matchmaking and other tasks we get out of these events.’
Dani Rodrik examines the coming global technology facture. According to Rodrik, ‘the best we can expect is a regulatory patchwork, based on clear ground rules that help empower countries to pursue their core national interests without exporting their problems to others.’
This medium piece argues that WFH is killing the trillion-dollar US hidden office economy in the form of a collapse in demand for the sprawling support network built up around white collar urban workers, from restaurants and coffee shops to business travel, office supplies and dry cleaning services (although presumably at least some of this demand has been relocated rather than destroyed?) The piece draws in part on this paper by David Autor and Elisabeth Reynolds which looks at how COVID-19 will transform labour markets ‘on at least four axes: telepresence, urban de-densification, employment concentration in large firms, and general automation forcing.’
A couple of podcasts to finish with. Econtalk hosts Margaret Heffernan to talk about her new book, Uncharted. And Bloomberg’s Odd Lots podcast had an interesting discussion with former PIMCO chief economist Paul McCulley on what he sees as a shift to a more ‘democratically managed’ economy (a different take on a greater role for fiscal policy than the more typical technocratic arguments about effective lower bounds).
Latest news
Already a member?
Login to view this content


