

 This product has already been purchased.


Overview
- The Monetary Policy Board (MPB) of the RBA voted 6-3 to increase the cash rate target by 25bp to 4.85%. Australia’s central bank has delivered 125bp of tightening this year and in nominal terms the policy rate is now at its highest level since 2008.
- This week’s majority vote to tighten policy reflected concerns that global energy prices will be higher for longer, worries that domestic capacity pressures are greater than previously thought, and nervousness regarding the impact of a prolonged period of above-target inflation on inflation expectations and central bank credibility.
- Consistent with this view, updated forecasts presented in the new November 2026 Statement on Monetary Policy (SMP) judge that inflation be higher for longer than previously projected. Growth is expected to be a little softer, and unemployment somewhat higher. Those projections are based on a higher cash rate, in line with market pricing.
- We may have entered a new era in which higher inflation and interest rates will prove to be a persistent feature of the economic environment.
- This week’s decision to tighten monetary policy will add to the existing pressure on the housing market. National home values registered a seventh consecutive monthly decline in October, and the current ongoing correction is rapidly approaching the largest peak-to-trough decline on record.
- While it is still unclear whether the present policy tightening cycle is done, a split vote and the post-meeting messaging do suggest that the MPB will be inclined to hold at the upcoming December meeting, not least to give policymakers time to assess the impact of what is now five rate hikes.
As widely expected, this week the RBA’s Monetary Policy Board (MPB) voted 6-3 to increase the cash rate target by 25bp to 4.85%. That brings the cumulative tightening to date to 125bp.
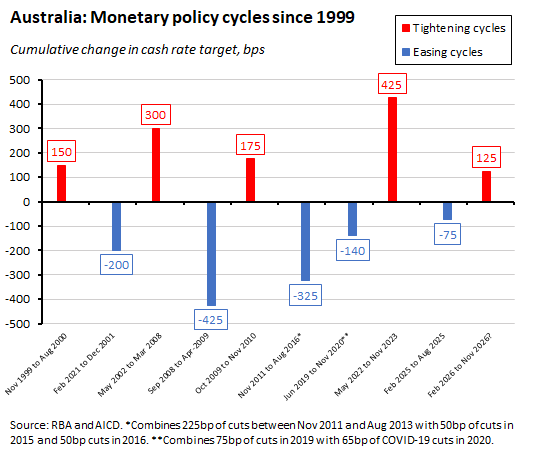
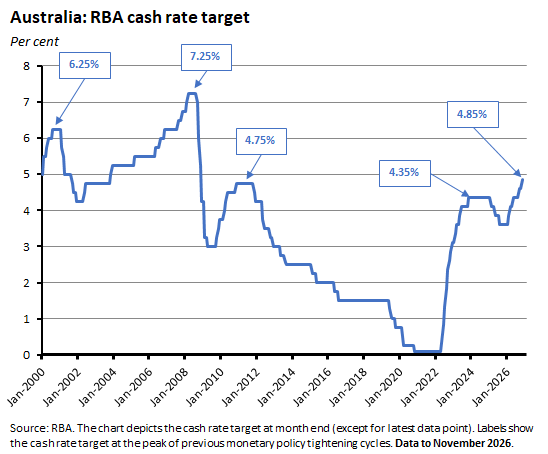
This week’s hike also took the policy rate up to its highest (nominal) level in 18 years. We have to go all the way back to 2008 and a time when Australia’s central bank was lowering the cash rate in response to the global financial crisis to find a higher level.
That higher policy rate is a product of a more troublesome inflation environment. As we discussed last week, these are challenging times for central banks. We repeat the chart we used to illustrate that point, albeit adjusted to include the new inflation projections from this week’s November 2026 Statement on Monetary Policy (SMP). Using those projections to provide a rough, extended estimate of post-COVID inflation that we can add to the historical data suggests that average inflation since the pandemic will continue to remain uncomfortably above the top of the RBA’s target band, even if the SMP forecasts play out.
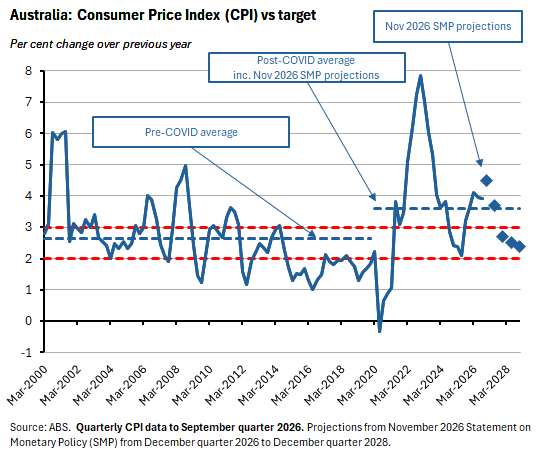
That’s an unwelcome record for a central bank concerned about maintaining its credibility. This week, RBA Deputy Governor Andrew Hauser gave a speech on Trust, expectations and monetary policy in which he noted that ‘persistent above-target inflation has marred’ central banks’ ‘hard-won track record.’ Hauser went on to argue that in what he describes as our ‘VUCA’ (Volatile, Uncertain, Complex and Ambiguous) world, ‘inflation is more likely to be pushed off target; economic forecasts are more likely to be wrong; and policy trade-offs get uglier.’
Much of Hauser’s focus is on the relationship between performance, trust, and inflation expectations, with the latter serving as an alternative measure of trust in the central bank and its ability to deliver on its inflation target. Going into this week’s meeting, we already knew that the RBA was worried about shifts in near-term inflation expectations. That concern is also visible in this week’s RBA communications, as discussed below.
There’s also another aspect of a VUCA world or, in our version, a world that is more prone to adverse supply shocks: monetary policy may be called on more often to prevent those shocks generating persistent inflation. It is likewise possible that this will involve a world of higher interest rates. Partly this would reflect more inflation. In addition, it could also reflect a higher neutral rate (that is, the rate that is neither expansionary nor contractionary). Again, we discussed this last time, and the new SMP also helpfully includes a box on developments in the neutral rate. Furthermore, there is the interaction between this difficult external environment and our own supply-constrained economy with its lower speed limit and hence increased vulnerability to inflationary breakouts to consider.
One possibility, then, is that the post-GFC, pre-pandemic interregnum of low inflation and low rates has now passed into history. Instead, we may have entered a new era of higher inflation and interest rates. If that proves to be the case, it will have some powerful implications for policymakers, households, and businesses.
Below we dive into this week’s rate decision in more detail and review the new projections, assumptions and risks as presented in the November 2026 SMP. We also provide an update on the ongoing correction in the housing market. And there is our usual roundup of other data releases plus a selection of further reading and listening.
The MPB voted to increase the cash rate target by 25bp to 4.85%
In a split 6-3 vote, the MPB voted to increase the cash rate target from 4.6% to 4.85%. According to the accompanying statement, the majority opinion on the Board was swayed by evidence of ongoing capacity pressures, stubbornly high inflation, and rising concerns about the impact of the latter on inflation expectations:
‘Since the previous meeting, the data have confirmed that underlying inflation remains broadly based. Capacity pressures appear a little tighter than previously estimated and there are indications that higher fuel prices are being passed through to prices of other goods and services. Inflation is now expected to remain above 3% for the coming year and there is an increasing risk that higher inflation expectations will become embedded.
The Board is conscious of the period in which inflation has been too high. Given the revised inflation outlook and the continuing upside risks, the Board judged that a further tightening in financial conditions is warranted to support the return of inflation to target.’
Echoing those messages and concerns in the press conference that followed the announcement, RBA Governor Michele Bullock was at pains to emphasise to her audience that the central bank was not tightening policy because of the direct impact of oil prices on inflation but rather:
‘…the tightening in monetary policy is to address domestic capacity pressures. These were evident before the rise in oil prices, which is why the Board started to increase the cash rate in February this year, prior to the start of the conflict in the Middle East. We now think that those pressures were greater and contributed more to inflation than we judged before. And as inflation has remained high, there is a risk that inflation expectations among households and businesses will rise, making the task of bringing inflation back down to target even more difficult.’
She attributed those capacity pressures to a mix of weak productivity growth and stronger-than-expected demand growth. In particular, strong investment (including data centre investment) is adding to inflationary pressures by boosting demand in the context of a supply-constrained domestic economy.
Consistent with the pre-meeting messaging from RBA staff, the Governor again signalled that Martin Place is concerned that an extended period of above target inflation is starting to influence short- and medium-term inflation expectations in unhelpful ways. As well as the previous comment, she later remarked:
‘What we're hearing is that people are thinking, "Oh, well, maybe 3.5% is the new normal." … the thing with inflation expectations, is that once you let them creep, then if 3.5% is acceptable, well, maybe 4% is acceptable, and then maybe 4.5%…that's why I think it demonstrates the importance of keeping inflation expectations anchored.’
The Governor also offered her own take on the minority argument for a hold:
‘Those in favour of a hold…weighted the downside risks more than the upside risks… I think those looking for a hold were thinking that housing has reacted, the unemployment rate is drifting up, there is no sign of wages growth accelerating. They felt that there were potential downside risks in these circumstances, particularly since we'd already done four interest rate rises, and maybe we should wait a bit longer to get some more data to test that.’
In terms of the policy outlook, the Governor stuck with her approach of avoiding any explicit forward guidance. Even so, she did indicate that after 125bp of tightening, now might be a good time to ‘take stock’. That message, plus the three dissenting MPB votes this week, suggests that a pause is more likely than another rate hike at the upcoming December 2026 MPB meeting, albeit with risks still tilted toward additional tightening:
‘[We have] five interest rate increases in the system now. The last couple haven't even started to flow through yet…it is probably a good point to just take stock for a minute and see what comes in, in terms of the data, to see if we're traveling more or less in line with the forecasts. What that means for interest rates in the future, I don't know…all I can say is that the Board will be watching very closely because there is still a bit of a skew on the upside to inflation risks, and we need to be alert to those materialising.’
The RBA reckons inflation will be higher for longer
This week’s MPB meeting also brought the release of the November 2026 SMP which includes new projections for the economic outlook. Importantly, prospects for inflation have been ‘revised materially higher.’ In part, that is due to a higher assumed path for energy prices because of the ongoing Middle East conflict. It also reflects the RBA’s judgement that domestic capacity pressures are greater than it previously assumed.
At the time of the August 2026 SMP, the RBA had expected that headline inflation would ease from 3.9% in the June quarter 2026 to 3.6% in the December quarter 2026 and then return to the top half of the target band (2.8%) by the June quarter of next year. Instead, headline inflation is now projected to rise to 4.5% by the December quarter, remain well above target at 3.7% in the June quarter of next year, and then fall to 2.7% by the December quarter of 2027. It will only return to the middle of the target band by mid-2028.
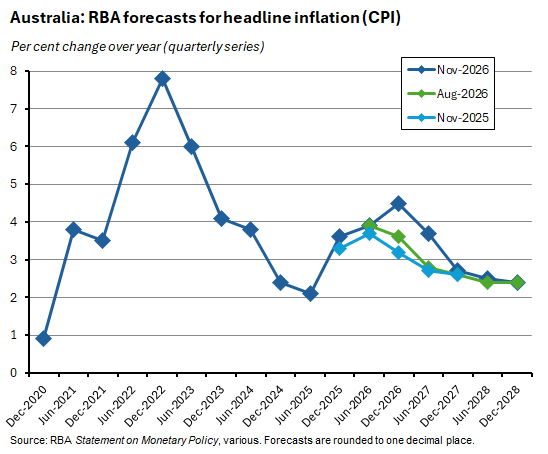
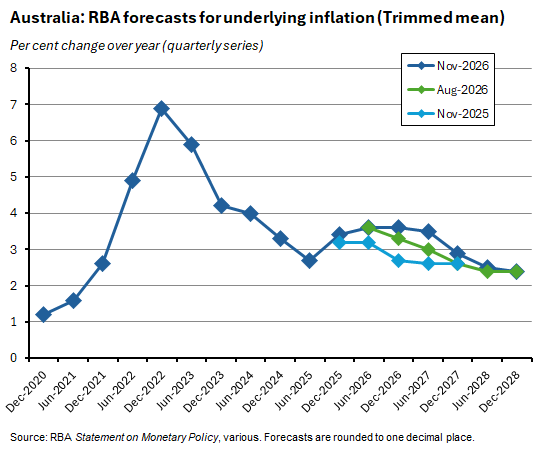
The projections for underlying inflation (the annual rate measured using the RBA’s preferred quarterly trimmed mean series) tell a similar if somewhat more muted story. The August SMP saw underlying inflation slowing from 3.6% in the June quarter of this year to 3.3% in the December quarter 2026, before easing to 3% in the June quarter 2027 and 2.6% in the December quarter 2027. The November 2026 SMP foresees a flatter trajectory, with underlying inflation unchanged at 3.6% in the final quarter of this year, the same as the preceding June quarter, and still little changed at 3.5% by the June quarter of next year. It is then projected to dip into the top half of the target band at 2.9% by the December quarter 2027. Again, a return to the middle of the target band has to wait until mid-2028.
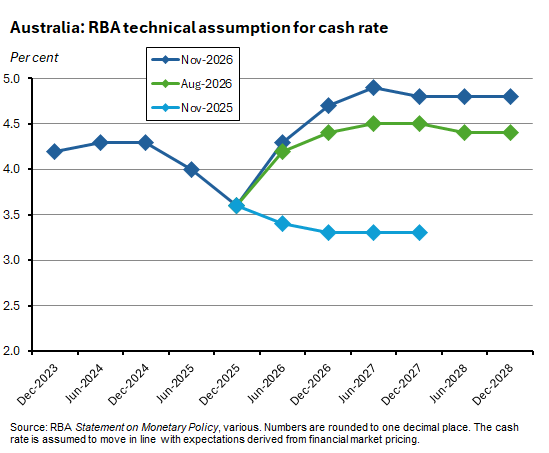
These new inflation numbers are predicated on new assumptions for the cash rate target that are derived from financial market pricing. The November SMP assumes a cash rate that reaches around 4.9% by mid-2027 before declining a little and stabilising at around 4.8% in 2028, implying a relatively flat trajectory. While the previous SMP had included a similarly flat trajectory, the November SMP path is up to 50bp higher than in the August SMP.
Tighter monetary policy plus the drag from higher global energy prices plus headwinds from a weakening housing market (see below) all contribute to higher forecasts for unemployment and lower forecasts for economic growth.
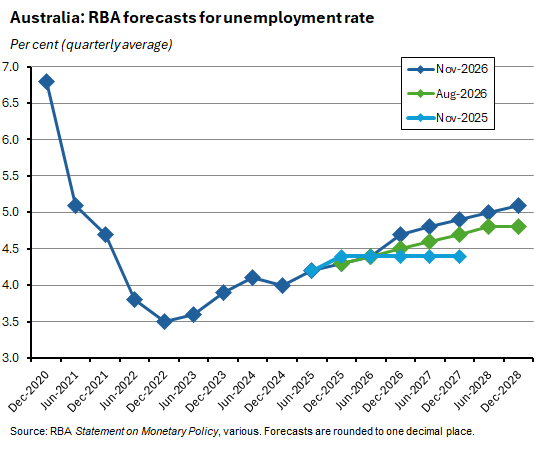
The unemployment rate is now projected to climb to 5.1% by the end of the forecast period in the December quarter 2028. In the August SMP, the jobless rate had been assumed to peak at 4.8%. Also worth noting here is that the RBA now judges that the trade-off between inflation and unemployment has worsened, with the new SMP reporting that the central bank’s estimate of the non-accelerating inflation rate of unemployment (NAIRU) has been revised up to around 4.75%.
Finally, on a calendar year average basis, the AI-powered data centre boom means that expected short-term real GDP growth in 2026 has been revised up from 1.9% in the August SMP to 2.1% in the November version. Growth in 2027 is still projected to fall to 1.5%, as in the previous SMP. In 2028, however, growth is now projected to slow further, dropping to just 1.4% rather than pick up slightly to 1.7% as projected in August.
That means the new SMP is projecting two years of growth running about half a percentage point below the RBA’s estimated speed limit for the Australian economy of around 2%.
Three key judgements, four key risks
As usual, the RBA sets out the key judgements underpinning its economic projections. As in the August SMP, there are three:
- Global oil and refined product prices are assumed to decline gradually but nevertheless remain above pre-conflict levels. The oil price in the final quarter of this year is now assumed to be 35% higher than in the August SMP and to still be 11% higher by the end of 2028.
- Current policy settings are judged to be restrictive, and restrictive financial conditions are assumed to produce some spare capacity in the economy and the labour market, helping reduce inflationary pressures.
- Some of the current drivers of inflation are expected to persist. Those pressures in part reflect higher energy and other commodity prices due to the war in the Middle East. But they also reflect the RBA’s judgement that domestic capacity constraints are more binding than previously assessed.
These judgements are balanced by four key risks (one more than in the August SMP).
- High inflation could prove even more persistent than expected if energy prices were to remain elevated, or if inflation expectations started to increase and/or have a greater impact on wage- and price-setting behaviour.
- The global AI demand boom could push up global growth and inflation even further.
- Domestic economic activity could turn out weaker than assumed. For example, current very low levels of consumer and business confidence may be warning of a deeper downturn in private sector activity than the RBA has projected.
- There is still considerable uncertainty about the extent of capacity pressures in the economy and the labour market. The SMP cautions that the RBA could either be underestimating capacity pressures or overestimating them.
That makes for two upside risks to inflation, one downside risk to activity, and one set of two-sided risks. In this context, the SMP includes brief discussions of two alternative scenarios. In the upside inflation risk scenario, oil remains at around US$100/b across the forecast period. Assuming an unchanged trajectory for the cash rate and the AUD, that would see underlying inflation about 0.25ppt higher by end-2028 than in the baseline projections. In the downside domestic activity scenario, the level of GDP would be around 1% lower and the unemployment rate 0.3ppt higher than in the baseline.
As rates rise again, the housing market correction continues
One potential source of downside risk to economic activity is the ongoing correction in the housing market. The Cotality National Home Value Index registered a seventh consecutive monthly decline in October 2026, falling 1.2% over the month to be down 2.8% over the year. The national index has now fallen 6.7% from its March 2026 peak.
The Combined Capitals index fell 1.4% over the month, led by declines in Brisbane (-2%), Perth (-1.7%), and Sydney (-1.6%). All capital cities except for Hobart and Darwin saw home values drop last month. The Combined Capitals is now down 4.8% over the year and is 8.1% below its March 2026 peak.
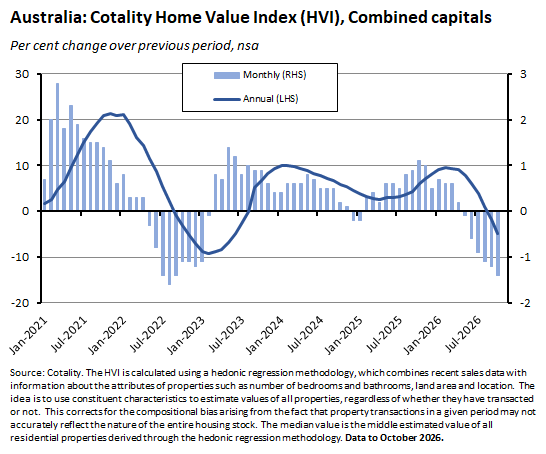
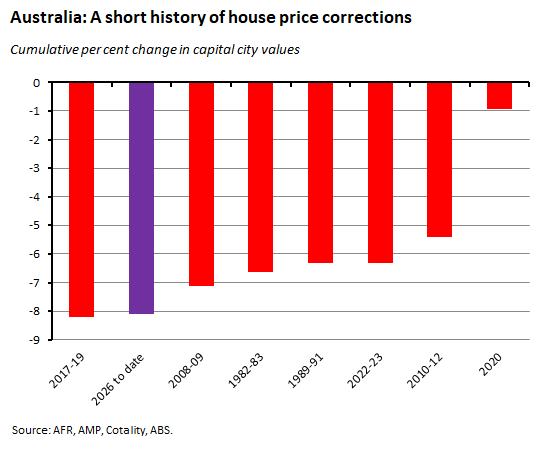
That 8.1% decline from peak to date means that the fall in home values already sits just behind the complete 8.2% peak-to-trough recorded in the 2017-19 downturn, which for now remains the largest decline on record for that measure. Moreover, the current decline is unfolding at a more rapid pace than the 2017-19 downturn as well as the relatively sharp 2022-23 downturn.
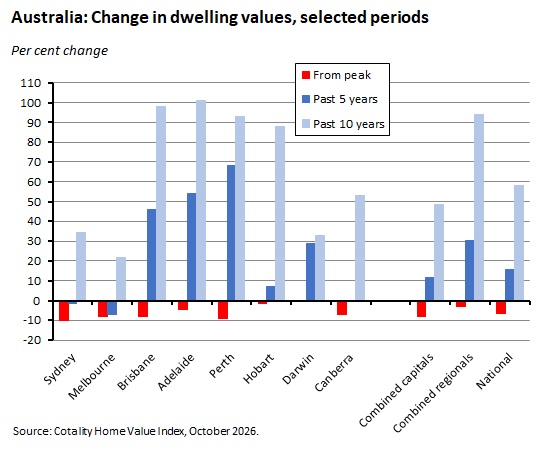
Home values in Sydney and Melbourne have now fallen to below where they were five years ago, while values in Canberra are flat over the same period. In contrast, and despite their recent declines, values in Perth, Adelaide and Brisbane remain well above the same five-year benchmark.
In other signs of housing market weakness, Cotality reports that: the number of home sales has dropped markedly (its modelled estimates suggest sales over the past three months are down 23% from the previous year); auction clearance rates across the Combined Capitals are consistently tracking below 50%; the median time on market (39 days) is now the highest since August 2020; vendor discounting (4.7%) is the largest since May 2019; and capital city listings have reached their highest level for this time of year since 2019.
Rental markets have also continued to ease, with the national vacancy rate rising to 2.3%. That October vacancy rate is the highest recorded since January 2022, although it remains a little below the decade average of 2.4%. Rental growth is also slowing, with Cotality noting that the 0.9% rise in national rents over the past three months was the lowest since January 2025.
With interest rates rising again this week, confidence weak, and economic activity expected to be lacklustre over the next two years, it seems extremely likely that the housing market downturn has further to run. That implies it is on track to become the largest downturn in the history of Cotality’s Combined Capitals measure.
Other Australian data points to note
In other housing related news, the ABS said that the total number of dwelling approvals rose 5.1% over the month (seasonally adjusted) in September 2026, to reach 17,948. That was down just 0.8% on the same month last year. Within that total, approvals for private sector houses (10,432) were down 5.3% over the month but up 9.6% over the year. In contrast, approvals for private sector dwellings excluding houses (6,579) were up 16.6% month-on-month but down 20.5% year-on-year. The Bureau noted that September’s drop in approvals for private sector houses was the largest fall since August 2025, but that despite this decline, September was still the ninth consecutive month to record more than 10,000 approvals.
According to the ABS, total job vacancies fell 0.9% (seasonally adjusted) in the quarter to August 2026 to be down 1.3% over the full year. Private sector vacancies fell 2% over the quarter and dropped 1.5% over the year, while public sector vacancies rose 7.8% over the quarter but remained flat in annual terms. Note that the Bureau now includes new data on the actual and expected impact of AI in the vacancies release, with about 82% of businesses reporting that AI did not impact the level of vacancies in August. Just 4% of businesses reported that AI had reduced the number of vacancies in the month, while less than 1% reported that AI had led to an increase in vacancies. The data also show the impact on job vacancies differed markedly across industries, with the Information media and telecommunications sector reporting the highest share (16%) of businesses attributing a decline in vacancies to AI. Businesses were also asked about the expected impact of AI on vacancies over the next 12 months. On this basis, about two-thirds told the Bureau they did not expect AI to have any impact, about 8% expected it to drive a decrease in vacancies, and 1% anticipated an increase. (Note that the ABS estimates apply to vacancies, not existing jobs, and they exclude businesses with fewer than five employees.)
The ABS Monthly Household Spending Indicator rose 0.6% month-on-month (seasonally adjusted, current prices) and 6.8% year-on-year in September 2026. With spending up on both discretionary and essential items, some of the gain reflected greater spending on fuel due to higher global oil prices and the end of fuel excise relief (on 3 August). Experimental ABS data suggests that the volume of spending on fuel fell 2.2% in September after having slipped by 0.6% in August. Total household spending in volume terms grew for a fourth consecutive quarter, rising by 0.7% over the September quarter to be up 3.2% over the year.
ABS Selected Living Cost Indexes (LCIs) recorded quarter-on-quarter increases of between 1.1% and 1.9% in the September quarter 2026, with the corresponding year-on-year rates ranging between 3.8% and 5.1%. The fastest rising was the Employee LCI, up 1.9% over the quarter and 5.1% over the year. That outsized rise in living costs was mainly driven by higher mortgage interest charges, which were up 5.7% over the quarter after having risen 8.2% in the previous quarter.
Australia’s seasonally adjusted balance on goods trade rose $2.6 billion to a surplus of $2.8 billion in September 2026. The ABS said that exports of goods were up 2.3% (about $1.1 billion) over the month while imports fell 3.3% (around $1.6 billion).
The ABS said there were 2,657,400 public sector employee jobs in Australia in June 2026, up 2.3% (60,300) from June 2025. That rate of increase was the slowest since 2019-20 and the onset of the COVID-19 pandemic. Commonwealth government employee jobs rose 1% (3,700) while state and territory jobs were up 2.8% (55,200) and local government jobs rose 0.6% (1,400). In 2025-26, total public sector cash wages and salaries rose 6.6% ($16.5 billion) to $266.1 billion, representing a moderation in growth from the previous year’s 7.8% jump. By component, the Commonwealth wage bill was up 7.2% ($2,944.7 million), the State bill up 6.6% ($12,612.1 million) and local government up 5.6% ($986.5 million).
Further reading and listening
- The November 2026 version of the RBA chart pack.
- The AFR reports MPB tensions over the RBA’s pre-meeting communication strategy although some elements of the story are contested.
- Also, from the AFR, is the government’s economic model broken?
- The November 2026 Deloitte Access Economics Investment Monitor cautions that Australia’s data centre boom is landing on top of an already record construction pipeline. The value of projects under construction is expected to approach $870 billion next year, more than double the peak of the mining boom.
- A look at the problems at NextDC and the challenges facing the data centre industry.
- On the history of superannuation.
- The e61 Institute considers, can competition keep AI cheap?
- The FT’s Martin Wolf asks, are we ready for an AI bust?
- Related, The boom before the bust: from the Roaring Twenties to the Great Depression. Lessons for the AI boom from the 1920s boom and its aftermath.
- The IMF casts an eye over the EU’s energy transition.
- In the WSJ, James Carville now reckons it’s not just the economy, stupid.
- Two new reports from the OECD: Pensions Outlook 2026 and Regions and Cities at a Glance 2026.
- The Economist magazine on the countries making a fortune from US-China rivalry.
- An FT Big Read on the trouble with small nuclear reactors.
- Dan Wang on Sichuan and the Sun Belt.
- RIP William Nordhaus.
- In the latest instalment of his compute series, Joe Walker talks to Bronte Capital’s John Hempton about AI as the most amazing technology but the worst business.
- The Bloomberg Australia podcast offers its take on what Australians need to know about the Anthropic IPO.
- The Econtalk podcast talks to Joseph Francis about revisiting the China shock.
Latest news
Already a member?
Login to view this content