
The good news is that – after an extended break due to a combination of personal travel and the AICD’s upgrades to our core technology systems – the Economic Weekly is finally returning to your email inbox this week. It’s been a while, but we’re glad to be back. You can now also find our newsletter on LinkedIn. Subscribe to catch the latest economic updates directly in your feed.
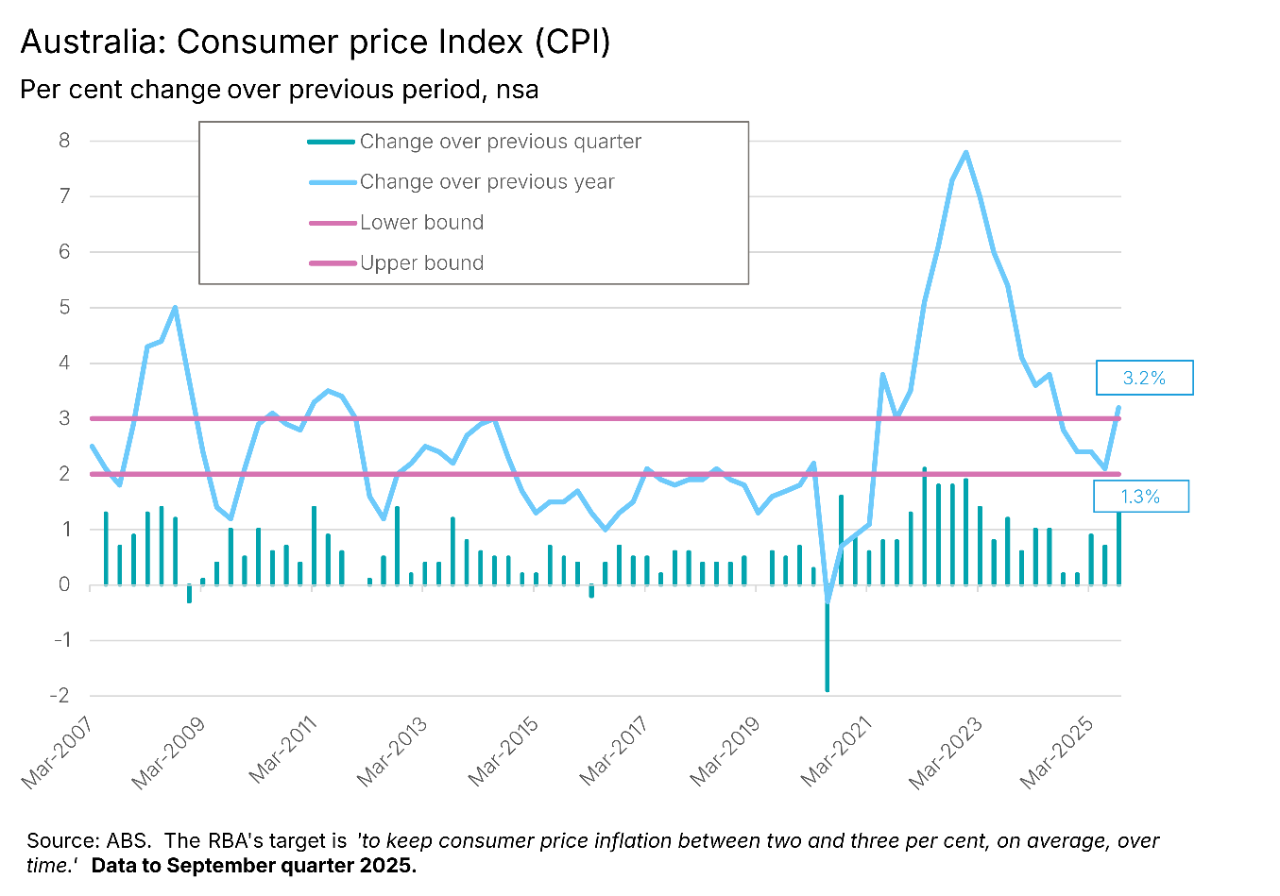
The not-so-good news is that we’re not the only thing to make a return. The September quarter 2025 Consumer Price Index (CPI) surprised to the upside this week, with the annual rate of headline inflation jumping from 2.1 per cent in the June quarter 2025 to 3.2 per cent last quarter. That marked the highest headline rate since the June quarter 2024. It was also uncomfortably above an already-elevated market consensus forecast for a three per cent print.
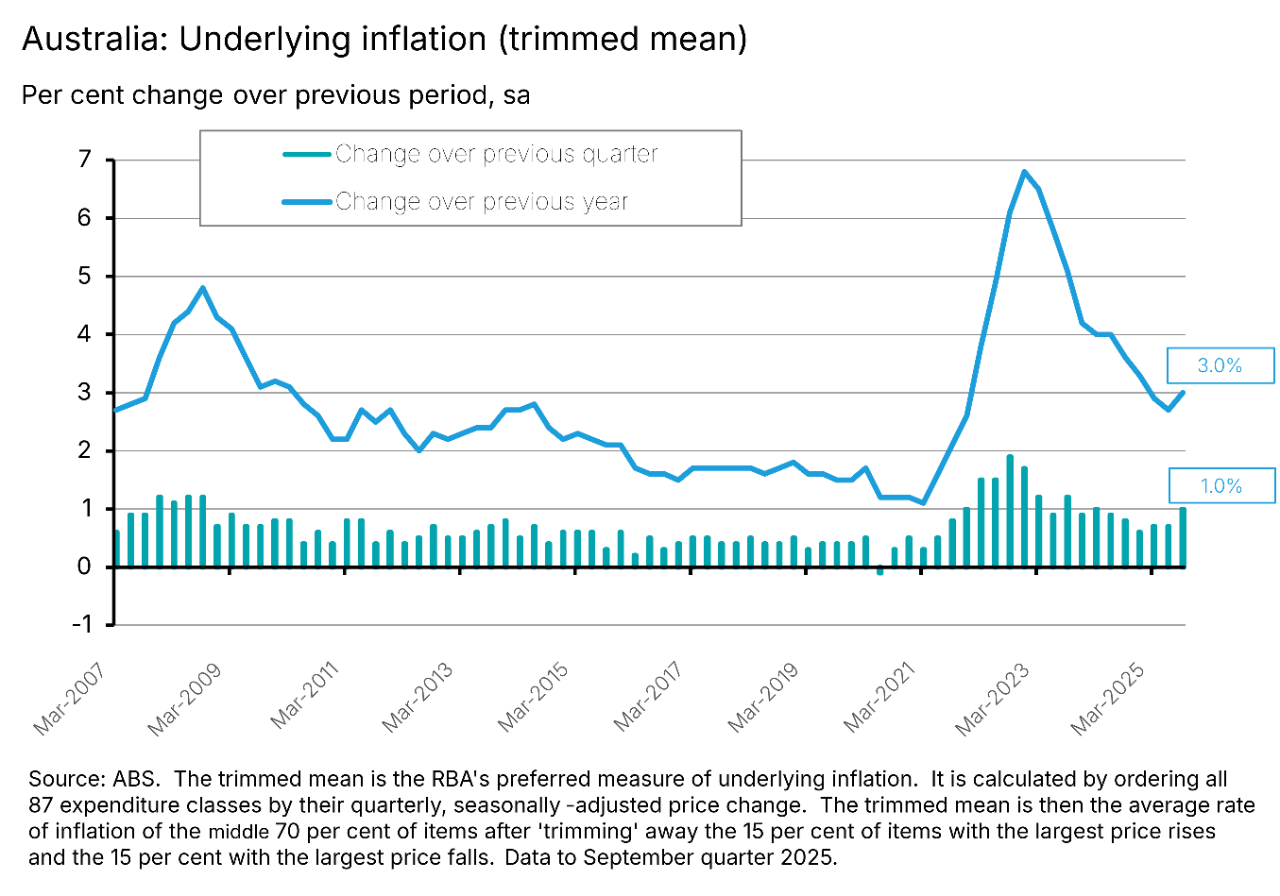
It was a similar story for underlying inflation as measured by the trimmed mean. Here the annual rate rose from 2.7 per cent in the previous quarter to three per cent in the September quarter. While the increase here was more moderate than in the headline rate, the result nevertheless outpaced the market’s median expectation of a 2.7 per cent outcome. It also represented the highest rate of underlying inflation since the December quarter of last year.
The return of inflation risk heralded by these stronger-than-expected Q3:2025 CPI results means that the RBA’s Monetary Policy Board (MPB) will not be voting to cut the cash rate target at its meeting next week. It likewise makes it difficult to foresee a rate cut at the final meeting of this year, scheduled on 8-9 December, while also raising the bar for any policy easing at the first MPB meeting of next year (due 2 -3 February 2026).
Inside the September quarter 2025 inflation result
Economists had always expected that the September quarter CPI results would be on the high side. For a start, the previous two monthly CPI Indicator readings had already been signalling a strong outcome: the monthly CPI Indicator had delivered a 2.8 per cent annual result in July and three per cent in August (followed this week by 3.5 per cent for September). True, the monthly Indicator readings have typically served as only an imperfect guide to the quarterly results, and from next month the ABS will discontinue them in favour of a full monthly CPI. But there was still enough information content here to flag the likelihood of an uncomfortably robust September quarter reading.
Again, economists had anticipated that the impact of shifts in electricity prices would serve to boost September quarter inflation. And that is indeed what happened, with the ABS reporting that electricity prices surged by nine per cent last quarter to be up 23.6 per cent over the year. In part this reflected the impact of annual electricity price reviews that came into effect from July this year and raised prices across all capital cities. But it was also driven by the way in which several State Government electricity rebates dropped out of the annual calculations. By last quarter, residents had used up rebates that had been in place since the September quarter 2024 (a $1,000 Queensland rebate, a $400 Western Australia rebate and a $250 Tasmania rebate). This had the effect of boosting the calculated annual increase. Further complicating the picture were differences in the timing of Commonwealth Energy Bill Relief Fund rebates. While Canberra had extended these for six months from July 2025 to December 2025, households in New South Wales and the ACT did not receive their payments in July, unlike households in other states. Instead, their rebate payments only began in August. This served to boost the quarterly price readings. Absent both these rebate effects the Bureau reckons that electricity prices would instead have risen by a (somewhat) more moderate 4.8 per cent over the quarter and 5.9 per cent over the year.
Another source of price pressure in the September quarter was a 6.3 per cent surge in property rates and charges as councils conducted their annual rates review. According to the Bureau, this was the largest quarterly rise for this series since the September quarter 2014.
While these stories explain some of the inflation pick up last quarter, however, there was also ample evidence of broader-based prices increases. Along with the rise in trimmed mean inflation already highlighted above, there were also increases for the weighted median measure of underlying inflation (up from an annual rate of 2.7 per cent in the June quarter to 2.8 per cent in the September quarter) and the CPI ex volatile items (up from 2.5 per cent to 3.4 per cent over the same period); for goods inflation (up from 1.1 per cent to three per cent); for services inflation (up from 3.3 per cent to 3.5 per cent); for tradables inflation (up from 0.2 per cent to 1.4 per cent); and for non-tradables inflation (up from 3.1 per cent to 4.1 per cent). The share of items in the CPI basket recording increases of three per cent or more was also up.
Taken overall, then, this was not a result that will please Martin Place. Instead, it will further reinforce the RBA’s cautious approach, at least through to the end of this year and maybe beyond.
Other Australian data points to note
Watch the labour market for further signs of loosening
Prior to this week’s inflation numbers, the case for an RBA rate cut next week had rested largely on the September 2025 labour force release, which had reported a surprising degree of loosening in the Australian labour market. According to the ABS, the seasonally adjusted unemployment rate rose from (an upwardly revised) 4.3 per cent in August to 4.5 per cent last month. That represented the highest unemployment rate since November 2021 and was significantly above the market consensus forecast, which had expected a 4.2 per cent outcome. The underemployment rate also increased, rising from 5.7 per cent to 5.9 per cent over the same period. As a result, the overall underutilisation rate rose from ten per cent to 10.4 per cent, reaching its highest level since August 2024.
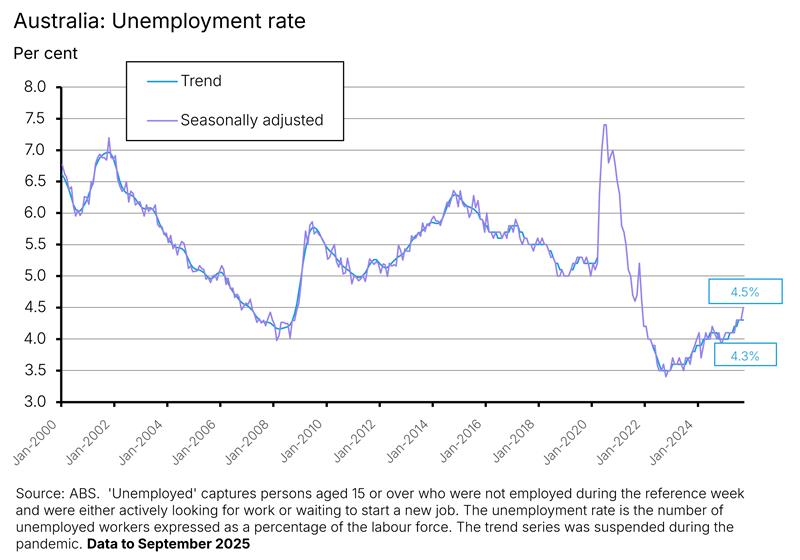
Employment did grow over the month, but only by a modest 14,900 compared to market expectations for a 20,000 gain. That increase was also less than the 34,000 rise in the number of unemployed.
In the aftermath of the September release, Martin Place had sounded largely unmoved by the signs of labour market loosening, with the RBA Governor telling an audience that in the central bank’s view the labour market remained tight, and cautioning her listeners about the volatility of the monthly numbers. This week’s inflation numbers have anyway likely rendered that debate moot, with markets now pricing in no rate change next week. But if the RBA were to resume easing either at the December meeting or (more likely) early next year, a key driver would likely be the emergence of further signs of labour market weakness.
Economic growth remains hard to come by
Last Friday, the ABS published the Australian System of National Accounts for the 2024-25 financial year. The numbers showed the Australian economy grew by a modest 1.4 per cent in real terms last year. That was unchanged from the 2023-24 result and means that (except for the 0.1 per cent contraction recorded in a pandemic-disrupted 2019-20), growth has now suffered its weakest back-to-back annual growth outcomes since 1991-92.
Growth in real GDP was not enough to keep up with population growth, either, as real GDP per capita fell 0.3 per cent over the year. After the previous year’s one per cent decline, Australia has now suffered consecutive falls in per capita output for the first time since the early 1990s.
Labour productivity as measured by GDP per hour worked also went backwards in 2024-25, falling by 0.7 per cent.
None of which makes for particularly pleasant reading.
Granted, we can attribute some of this weakness to the impact of the RBA’s monetary policy tightening cycle in response to the post-pandemic inflation outbreak. After all, between May 2022 and March 2024 Australia’s central bank hiked the cash rate target by a cumulative 425bp, taking it from 0.1 per cent to 4.35 per cent. And there will also have been headwinds from the elevated levels of economic uncertainty that have characterised the global economy in recent years. Plus, there are likely some longer-lasting adverse impacts from COVID-19 to consider. Yet it is also worth recalling that Australia’s pre-pandemic growth and productivity performance were also disappointing, reminding us that our growth challenge predates the pandemic. As we’ve been arguing for some time now, Australia’s growth model looks to be in need of repair. The current sequence of disappointing growth outcomes represents some of the most compelling evidence of the cracks appearing in the current model.
Australia’s budget is back in the red again
The government released the Final Budget Outcome for the 2024-25 financial year (pdf) back on 29 September this year. The Australian general government sector recorded an underlying cash deficit of almost $10 billion, or about 0.4 per cent of GDP. The headline cash balance – which adds in the impact of net cash flows from investments in financial assets for policy purposes – returned a deficit of $21.8 billion or close to one per cent of GDP (We’ve noted in our budget previews that the growing gap between the underlying and headline cash balances in recent years is due to Canberra’s increasing reliance on alternative financing mechanisms including equity investments, loans, and guarantees, and that this means it is now worth keeping an eye on the headline measure, too).
While the 2024-25 deficit was quite modest in the context of a lacklustre growth outcome and came in markedly smaller than Budget 2025 had projected, it nevertheless signals the end of a brief two-year period when receipts exceeded payments. Set aside those back-to-back surpluses on the underlying cash balance, and the last time prior to that a federal government was able to report a surplus was all the way back in 2007-08. Since then, successive Australian governments have found it difficult to balance the books. Furthermore, based on the projections presented in Budget 2025, this is set to remain the case through to the end of forward estimates in 2028-29 and on through the medium-term forecast to 2035-36.
Even with this recent shift back into the red, it remains the case that Australia is in a decent fiscal position compared to many of our advanced economy peers. Deficits are lower and the public debt burden is considerably more modest: gross debt ended 2024-25 at 33.5 per cent of GDP and net debt at 19.2 per cent, figures which are much lower than the corresponding advanced economy averages. Still, ideally, we should be using this fiscal breathing space to engage in fiscal upgrades and repairs to ensure Australia does not fall into the kind of budget challenges facing other rich country policymakers that now find themselves struggling with slow growth, ageing populations, and large debt burdens. Fail to do so and move further down that same path as our peers, and as the international evidence warns, the outcome is unlikely to be pretty.
Further reading and listening
- The October 2025 edition of the RBA Bulletin has been released. There is a piece on the global energy transition and critical minerals as well as work on small business economic and financial conditions and a new measure of job searchers for Australia.
- The ABS has published an information paper on Evolving Australia’s Consumer Price Index. From next month (Wednesday 26 November) the Bureau will start publishing a complete Monthly CPI for Australia.
- Robert Breunig says Australia’s tax system takes from the young to give to the old.
- The Australia in the World podcast looks back at the meeting between Prime Minister Albanese and President Trump.
- Related, on Australia’s place in the global race to secure critical minerals.
- Perhaps a little dated now, but the IMF’s October 2025 World Economic Outlook and Global Financial Stability Report are always worth a read for their detailed analysis of global economic and financial conditions. The Fund has also released its latest Asia and Pacific regional economic outlook.
- Dan Davies’ review of Abundance and Breakneck - two books that have received a lot of attention this year – is worth a read. I very much like Davies’ framing of his key question for society: ‘Have our decision-making systems become pathological yet?’ and find his work nicely thought-provoking in the context of current debates around regulation and productivity. See also his paper on The Problem Factory.
- The Odd Lots podcast talks to Daniel Yergin on what happened to the energy transition.
- The dawn of the post-literate society? Are we living in a golden age of stupidity?
- The UnHerd podcast team have launched a new economics podcast called The Econoclasts, pairing Yanis Varoufakis with Wolfgang Munchau. The declared aim is to ‘debunk…economic orthodoxies.’ The first episode asks, Should Europe seize Russian assets and is a crypto crisis looming? (Tbh, I’m usually quite cautious when it comes to ‘debunking economics’ content, as in the past I’ve found that the quality can vary dramatically, but am going to give this one a chance.)
Latest news
Already a member?
Login to view this content