A record 1.3 per cent quarterly increase in the Wage Price Index (WPI) took annual wage growth up to four per cent in the September quarter of this year, reflecting a rise in both the share of jobs seeing a change in wages and an increase in the average size of those adjustments. This marks the first time that wage growth has had a ‘four’ in front of it since the first quarter of 2009. That strong outcome was still broadly in line with market forecasts, which had been anticipating an impact from the Fair Work Commission’s 5.75 per cent increase to Awards and the 15 per cent raise for Aged Care Workers.
It also looks to be consistent with the latest set of RBA forecasts as presented in the November 2023 Statement on Monetary Policy (SMP). As a product of continued labour market tightness as well as of one-off adjustments, however, the result will also put a renewed focus on the future trajectory of Australia’s productivity growth since a recovery in the latter will be required to keep wage outcomes around this rate consistent with the RBA’s inflation target.
Meanwhile, the latest labour force release confirmed that conditions in Australia’s labour market did indeed remain tight last month. Granted, the unemployment rate edged higher to 3.7 per cent in October, keeping it in line with the RBA’s forecast for an average rate of 3.8 per cent over the final quarter of this year. But that rise in joblessness was accompanied by a strong 55,000 increase in employment as well as rises in the participation rate and the employment-to-population ratio.
Despite the record quarterly wage increase in Q3:2023, a four per cent annual rate of nominal wage growth means that wage growth is still running behind both headline CPI inflation (which was up 5.4 per cent over the year in the September quarter) and the rise in living costs for employee households (up nine per cent). The big squeeze on households continues, with the latest sentiment indicators reporting that the RBA’s November rate hike sent confidence tumbling last week.
Finally, those updated forecasts from the November 2023 SMP show that Australia’s central bank is now expecting inflation to stay higher for longer, despite incorporating a higher profile for the cash rate into the new projections. Last week we argued that the hurdle for another rate hike should have risen following the RBA’s November increase in the cash rate target, allowing the RBA to hold fire until next February. We still think that should be the case. But the new projections in the SMP show that Martin Place sees very little scope for any upside surprises on the inflation front. It follows that any meaningful price and/or cost shocks in the future data flow would risk triggering another policy response, much as the September quarter CPI result did. And this week’s wage and labour market results further reinforce the SMP’s message that the central bank’s room for manoeuvre remains limited.
Quarterly wage growth reaches record high in Q3:2023
The ABS said that Australia’s Wage Price Index (WPI) rose 1.3 per cent over the September quarter 2023 (seasonally adjusted) to stand four per cent higher over the year. According to the Bureau, the Q3:2023 print saw the highest quarterly growth in the entire 26-year history of the WPI series as well as the highest annual rate of wage growth since the March quarter 2009. The result was also very close to the consensus forecast, which had anticipated a 0.3 per cent quarter-on-quarter rise along with a 3.9 per cent year-on-year increase (the slightly higher-than-expected annual result reflected revisions to the June quarter numbers).
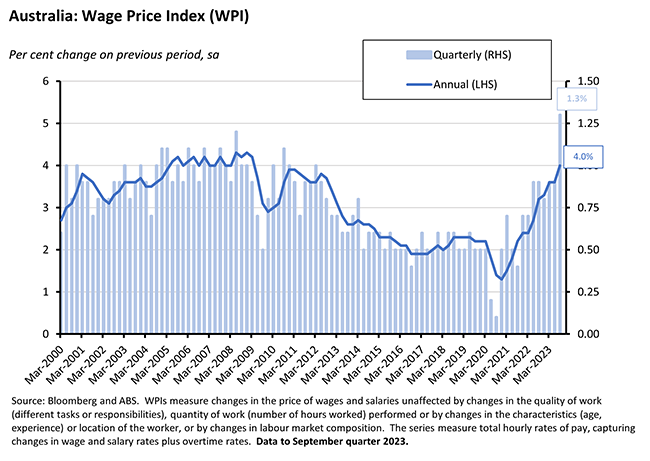
According to the Bureau, 46 per cent of all jobs recorded a wage movement over the quarter (up from 43 per cent in the same quarter last year) while the average wage change was 5.4 per cent (up from four per cent). Moreover, 59 per cent of all jobs that recorded a wage change in Q3:2023 received an annualised increase above three per cent.
By sector, wage growth in the private sector (4.2 per cent over the year) continued to outpace wage growth in the public sector (3.5 per cent over the year). This September quarter’s annual wage growth was the highest for the private sector since the December quarter 2009 and the highest for the public sector since the June quarter 2011.
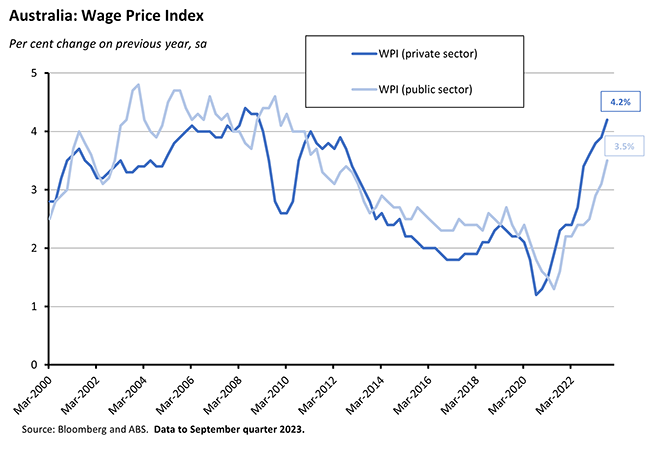
The ABS said that wage growth in the public sector was influenced by the ending of state government wage caps along with the resolution of wage negotiations. The latter saw initial or backdated increases paid for jobs that were covered by newly approved enterprise agreements at state and local governments.
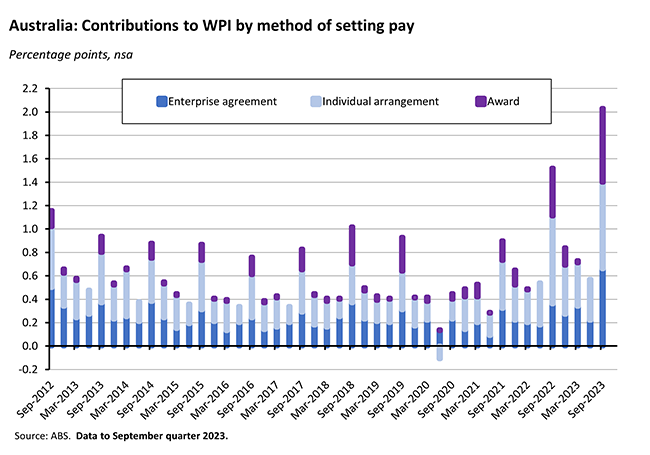
In the private sector, the Bureau reported that 49 per cent of all jobs saw a wage adjustment last quarter, with the average hourly wage increase rising to 5.8 per cent from 4.3 per cent in the same quarter last year. Those wage gains reflected the combined impact of annual salary reviews relating to individual arrangements, scheduled increases associated with enterprise agreements, and award-reliant jobs.
Key factors at work last quarter included the Fair Work Commission (FWC)’s 2022-23 Annual Wage Review and the Aged Care Work Value case. The FWC gave award jobs an increase of 5.75 per cent effective from 1 July this year while implementation of wage increases under the FWC’s Aged Care Work Value case provided an increase of 15 per cent for eligible nurses, personal and home care workers, recreational/lifestyle officers and senior food services employees in the third quarter. That then delivered overall wage increases of between 5.75 per cent and 21 per cent after taking into account the FWC award increases.
By method of setting pay, wage growth increased across all processes, with private sector individual agreements the most important driver of wage growth in the September quarter.
By industry, wage growth was strongest in the Accommodation and food services industry (where the share of jobs on award wages is high) and in the Health care and social assistance industry (where many jobs have pay set by award or enterprise agreements linked to the FWC Annual Wage Review and/or the Aged Care Work value case).
As already noted, the record Q3:2023 quarterly wage increase was in line with market expectations, which had anticipated a significant impact from the FWC Annual Award increase and the Aged Care Workers decision as well as the end of public sector wage freezes. But the ABS said that wage growth also reflected ongoing labour market tightness including the need to retain workers with skills in demand along with a response to inflation and cost of living pressures.
What will this mean for the data-dependent RBA? The September quarter’s results look to be broadly in line with the central bank’s expectations as set out last week in the November 2023 SMP, (see also below). The RBA’s new forecasts expect the rate of wage inflation as measured by the annual rate of increase in the WPI to stabilise at around four per cent through the end of this year and over the first half of 2024, before easing to 3.7 per cent by the December quarter 2024. The RBA reckons this trajectory is consistent with the message the central bank has been receiving from its liaison program, where a larger share of firms has been telling Martin Place that they expect wage growth in a year’s time to be below its current rate.
As a result, in the SMP the RBA’s concern is not with the current rate of wage growth as much as it is with this combined with Australia’s weak labour productivity performance. The hopeful assumption at Martin Place is that productivity growth rates will return to something approaching their long-run average, validating current wage rates. But if this doesn’t happen, labour costs will instead rise further, adding to inflationary pressures and undermining the compatibility of current rates of wage growth with the RBA’s inflation target.
Employment and unemployment rise in October 2023
The ABS said that Australia’s unemployment rate rose to 3.7 per cent in October this year on a seasonally adjusted basis, up from 3.6 per cent in September (the ABS reported this as a 0.2 percentage point increase due to rounding). The number of unemployed people rose by 27,900 to 547,800. The outcome was in line with market expectations, with the median forecast having predicted a 3.7 per cent print.
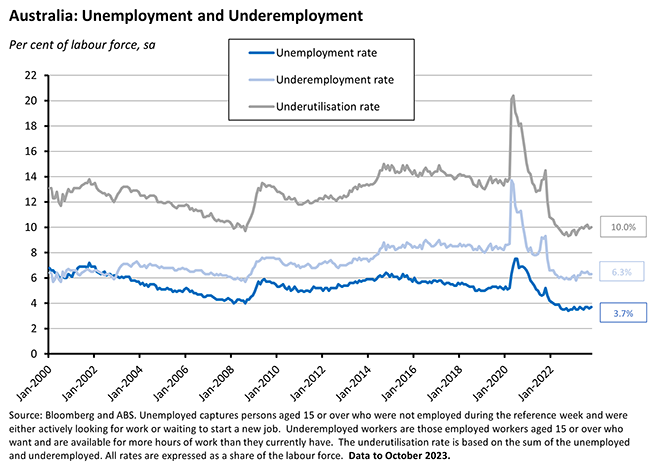
The underemployment rate in October was 6.3 per cent, unchanged from a downwardly revised September result. As a result, the overall underutilisation rate edged up to ten per cent last month from 9.9 per cent in September.
The increase in unemployment largely reflected a rise in the number of Australians looking for work, as the participation rate increased from 66.8 per cent to 67 per cent.
At the same time, employment rose by a strong 55,000 in October, significantly exceeding market expectations for a 24,000 increase. Employment growth was 0.4 per cent month-on-month and three per cent year-on-year. Full-time employment rose by 17,000 and part-time employment jumped by 37,900. As a result, the employment-to-population ratio edged back up to 64.5 per cent.
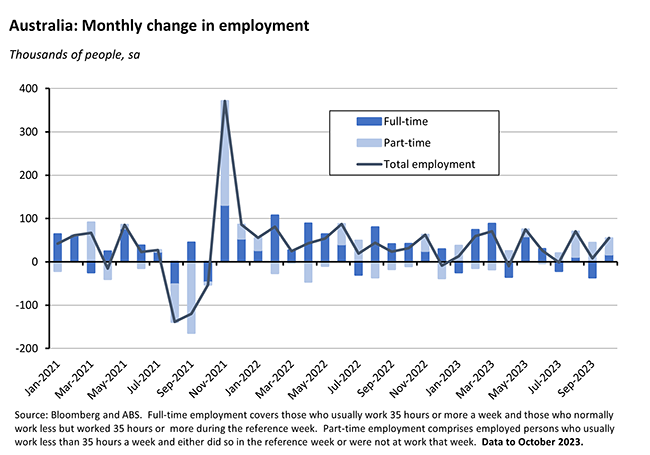
Monthly hours worked in all jobs rose by nine million last month, (up 0.5 per cent over the month and 1.7 per cent higher over the year.
One complicating factor in October was that the employment numbers were influenced by the logistics arounds the Voice referendum, with the ABS noting that it would ‘have contributed to some temporary growth in employment, hours and participation in October’ but also noting that ‘the temporary effect of referendums and elections on Labour Force employment measures cannot be specifically identified.’
The October labour market result managed to combine a small and expected increase in the unemployment rate with a large and unexpected rise in employment. Overall, that result is consistent with a labour market that remains very tight by historical standards. That said, as well the modest rise in the unemployment rate, the ABS did highlight a couple of other signs of slight loosening in labour market conditions: over the past two months, monthly employment growth has averaged around 31,000, which is lower than the average growth of 35,000 per month since October 2022; and annual growth in hours worked has slowed to below two per cent from around five per cent in the middle of the year, which the Bureau said ‘may suggest that the labour market is starting to slow, following a particularly strong period of growth.’
Confidence tumbles following last week’s rate hike
The November 2023 Westpac-Melbourne Institute Consumer Sentiment Index (pdf) fell 2.6 per cent to an index reading of 79.9, down from 82 in October. Westpac economists pointed to the impact of the RBA’s 7 November rate hike, noting that while survey responses prior to the rate rise were consistent with an index read of just over 83 – which would have delivered a modest improvement over October’s result – those taken after were consistent with a much weaker reading of just 78.2, indicating a six per cent fall in sentiment across the week of the survey. Further, amongst those surveyed after the RBA meeting, 73 per cent expected further increases in mortgage interest rates over the next 12 months, while only four per cent anticipated a rate cut over the same period.
That suggests Australian households will be looking to limit spending – a message reinforced by the ‘time to buy a major household item’ subindex sliding by 1.4 per cent to an index reading of 81.3, which is in the bottom two per cent of observations since the survey began. Westpac also highlighted that this subindex suffered the largest fall (14.9 per cent) of all the subindices between pre- and post-RBA responses.
Another notable feature of this month’s survey results was that Westpac pointed to ‘a widening gap between segments that are struggling with rate increases and the rising cost of living and those that are less exposed to these issues and benefitting from higher returns on deposits and appreciating house prices.’ It said that this was reflected in a divergence in sentiment between the mortgage belt on the one hand, and older age groups, high income earners and investment property owners on the other.
Delivering a similar message, the ANZ Roy Morgan Consumer Confidence Index fell 3.5 points to a reading of 74.3 in the week ending 12 November 2023. All the confidence subindices dropped last week, with the declines led by ‘time to buy a major household item’ (which plunged 7.6 points) and ‘future economic conditions’ (down 4.7 points). The weekly confidence index is now back down at its lowest level in four months while the ‘future economic conditions’ subindex has slumped to its lowest level since April 2020. Again, the driver was last week’s RBA rate hike. Weekly inflation expectations were unchanged at 5.5 per cent.
Latest RBA forecasts see inflation higher for longer
Last Friday, the RBA published the November 2023 Statement on Monetary Policy (SMP). The forecasts presented in the new SMP incorporated the higher-than-expected September quarter 2023 inflation print as well as other key activity, labour market and cost data releases since the August 2023 SOMP. They also helped to underpin last week’s RBA decision to end the central bank’s four month long monetary policy pause and deliver a first 25bp increase in the cash rate target since June 2023. Unsurprisingly, then, that decision is consistent with the November SMP’s key message – that relative to the RBA’s previous expectations, inflation in Australia will be higher in the near term and take longer to return to target.
The new RBA forecasts see headline CPI inflation ending this year at 4.5 per cent, up from the 4.25 per cent presented in the August 2023 SMP forecasts. And inflation only returns to the top of the target band (just barely below three per cent) by December quarter of 2025. This is a bit higher than the 2.75 per cent end-year projection made in the August numbers.
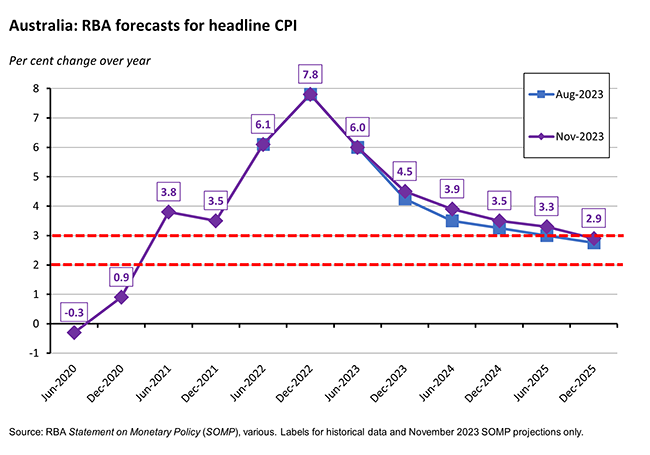
It’s a similar story with underlying (trimmed mean) inflation. The August SMP had underlying inflation falling to 3.9 per cent by the December quarter of this year and continuing to ease to 2.75 per cent by the December quarter 2025. The new SMP forecasts see underlying inflation running at the same rate as the new forecasts for headline inflation for both periods – that is, at 4.5 per cent in the final quarter of this year and 2.9 per cent in the final quarter of 2025.
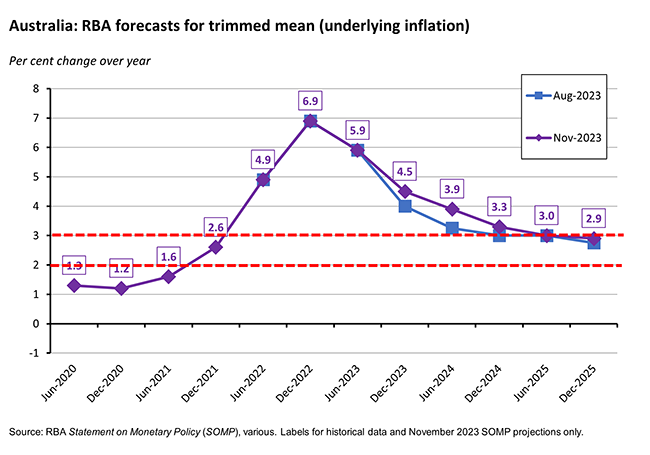
Note that the November SMP forecasts are based on the technical assumption that the cash rate will move in line with market pricing and peak at around 4.5 per cent (it is currently at 4.35 per cent) before falling to 3.5 per cent by end-2025. This is a slightly higher path for the cash rate than the one assumed in the August SMP, which had the RBA’s policy rate peaking at around 4.25 per cent by the end of this year before falling to 3.25 per cent by end-2025. The projections also assume that oil and fuel prices will remain at current levels (around five to eight per cent higher than in the August forecasts) and that population growth will have peaked in the September quarter of this year at around 2.5 per cent before falling back to its pre-pandemic average of around 1.5 per cent. The August SMP had put peak population growth at two per cent.
A key change here, then, is that despite a slightly higher profile for the cash rate, the disinflationary process will be more gradual than the one the RBA had previously been forecasting. That in turn raises the risk of an increase in inflationary expectations.
In terms of price dynamics, the new SMP highlights stronger-than-expected underlying inflation in the September 2023 quarter which it says was primarily driven by high services inflation. This in turn reflects a combination of ‘the still-strong level of demand for services as well as recent strong growth in domestic costs, including for labour (partly because of poor productivity outcomes) and non-labour business inputs such as energy, rent and insurance.’ The RBA still reckons that services inflation will fall over coming quarters as both labour and non-labour cost pressures ease and as demand moderates. But it also reckons that this moderation process will now be slower.
Another and related feature of the November 2023 SMP forecasts is that Martin Place judges that economic activity will be somewhat more resilient than it thought back in August. Real GDP growth is now forecast to average two per cent this year (up from 1.5 per cent in the August SMP), 1.75 per cent next year (up from a 1.25 per cent forecast) and 2.25 per cent in 2025 (up from two per cent). Part of the story here is the near-term upgrade to population forecasts, reflecting more rapid rates of net overseas migration. But it also reflects stronger-than-expected growth in private and public investment, with a large pipeline of construction and public infrastructure work.
Interestingly, that upgrade to growth comes despite a downgrade to prospects for household consumption, where the RBA expects higher interest rates, cost of living pressures and higher tax payable will all combine to continue to squeeze real disposable incomes.
A stronger outlook for economic growth plus the demonstrated resilience of the labour market to date mean that the RBA has also increased its projections for employment growth. As a result, the unemployment rate is forecast to rise more slowly than in the August SMP, reaching around 4.25 per cent by the end of late 2024 instead of the 4.5 per cent rate predicted in the previous set of forecasts.
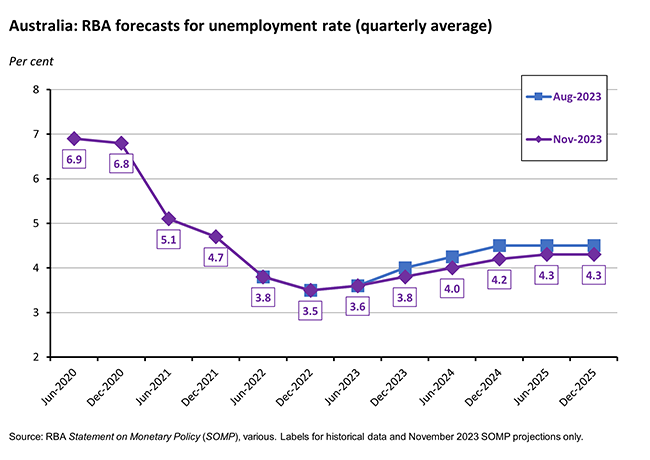
This path for the unemployment rate is paired with the RBA’s view that wage growth will peak at around four per cent in the second half of this year (for more detail here, see the WPI discussion above) and then fall gradually from the second half of next year as labour market conditions ease.
What of the risks to these projections? The RBA continues to highlight the uncertainties around household consumption. On the one hand, consumer spending could surprise to the upside if households draw down more on their savings, or if rising house prices produce positive wealth effects. That in turn would imply inflation could be higher for longer. On the other hand, the RBA also flags the risk that ‘households, especially those with low savings buffers and high debt relative to incomes, will adjust spending by more than expected’ leading to weaker consumer spending and less pressure on inflation.
Other upside risks to inflation include continued productivity underperformance, new supply shocks (for example, the SMP worries that the Hamas-Israel conflict could lead to higher oil prices, or the El Nino weather pattern / climate change could lead to higher food prices), higher rent inflation, or more persistent services inflation. Other downside risks include a weaker Chinese economy or a deeper slowdown than expected across the global economy more generally.
What else happened on the Australian data front this week?
The October 2023 NAB Monthly Business Survey reported that business conditions remained strong last month although business confidence weakened further, maintaining the substantial gap between the two measures that has been a feature of the data since the first half of 2022. The business conditions index rose one point to +13 index points in October, keeping it comfortably above the long-term average for the index. Two of the three index subcomponents rose over the month with trading conditions up two points and profitability up three points. But employment eased by one point. In contrast, business confidence fell three points to minus two index points last month. Other leading indicators also softened in October, with forward orders down by three points and the capacity utilisation rate edging down slightly from 84.1 per cent to (a still high) 84 per cent. In a positive development, price and cost growth showed some signs of moderating. Growth in labour costs slowed from 2.1 per cent to 1.8 per cent in quarterly equivalent terms while purchase cost growth eased from two per cent to 1.8 per cent. Final product price increases also eased from 1.1 per cent to one per cent – the slowest rate of price increase recorded since July 2020. Retail price growth was unchanged at 1.9 per cent.
The ABS said that short-term visitor arrivals in September 2023 were 584,620. That was 212,780 trips more than in the same month last year. Total arrivals were 1,602,720, an annual increase of 531,200.
The ABS has published estimates of industry level multifactor productivity (MFP) for the 2021-22 financial year.
The Melbourne Institute’s measure of inflation expectations (based on the trimmed mean measure) rose slightly to 4.9 per cent in November 2023 from 4.8 per cent in October.
Other things to note . . .
- A speech from RBA Acting Assistant Governor (Economic) Marion Kohler on the outlook for the Australian economy. As well as a review of changes to the RBA’s forecasts in the November Statement on Monetary Policy – covered above – Kohler also discussed the RBA’s full employment objective and the central bank’s approach to measuring labour market conditions. Two points in particular worth highlighting here: (1) In recent years, the RBA reckons that underemployment has grown in importance relative to unemployment as an indicator of labour market spare capacity. This reflects the rise in part-term employment, as part-time workers are much more likely to be underemployed than their full-time counterparts. (2) The RBA thinks that a greater share of the adjustment to swings in labour market demand now happens through changes in hours worked, rather than through changes in headcount.
- The AFR’s John Kehoe explores how age, wealth and geography are dividing Australia and making life complicated for the RBA.
- NAB’s Q3:2023 State Economic Update.
- The ATO’s Corporate Tax Transparency Report 2021-22.
- A new Grattan Institute report on the need to fix Australia’s local roads. And Grattan’s Tony Wood on Rebooting Australia’s energy policy.
- Updated numbers from the ABS on digital platform workers in Australia.
- Who benefits from Australia’s 50 per cent CGT discount?
- Also from the AFR, Nouriel Roubini on how the Gaza war could threaten the world economy.
- The WSJ says China is making too much stuff, leading to rising trade tensions.
- How high-speed rail helped drive China’s export growth.
- The IMF’s Regional Economic Outlook for Europe.
- Also from the IMF, a new working paper looks at the trade diversion effects from global tensions, using the examples of the impact on Mexican exports to the United States of US trade sanctions on Russia in 2014 and US-China trade tensions in 2018. The authors reckon that the 2018 experience in particular suggests that the size of trade diversion effects might be larger than previously thought, once a deeper look at supply linkages is considered.
- The Fund is also tracking the impact of climate change on port activity and global trade flows.
- European business cycles and economic growth in the (very) long run – from 1300 to 2000!
- In the FT, Martin Wolf selects his best economics books of H2:2023.
- An FT Big Read investigates whether Indonesia is set to become an economic superpower.
- The Economist asks, are politicians are brave enough to embrace ‘daredevil economics’?
- Brad DeLong explains why 1870 was the Hinge of Human History and salutes ‘the triple of the submarine telegraph, the iron-hulled ocean-going steamship, and the industrial research laboratory.’
- The These Times podcast considers some of the potential geopolitical implications for the world of the 2024 US presidential election.
- The Econtalk podcast in conversation with Jennifer Burns, the author of a new biography of Milton Friedman.
Latest news
Already a member?
Login to view this content


