The yield on Australian government debt and the value of the Australian dollar have both been under upward pressure as local spillovers from the global ‘reflation trade’ complicate life for the RBA. Despite a quarterly jump in the Wage Price Index in Q4:2020, the annual rate of increase remained at a record low. Private capex staged a recovery in the December quarter of last year but remains weak overall.
Average weekly earnings suffered their first six-month fall as pandemic-driven changes to employment composition continue to warp labour market statistics. Preliminary estimates from the ABS showed merchandise exports and imports both sliding in January and construction work done in Q4:2020 coming in weaker than expected. Despite dipping to a four-month low in February, the Composite PMI indicates that private sector activity in Australia has now been rising for six consecutive months. Bloomberg’s February roundup of economic forecasts has the median expectation for growth this year at 3.8 per cent. The weekly Consumer Confidence Index edged lower. More preliminary data from the ABS – this time for retail sales – showed turnover in January was more than ten per cent higher than a year ago.
This week’s readings include the future of government support measures including JobSeeker, an economic Reset for Australia, challenges for our wine exporters, the future of McKinsey, four basic truths of macroeconomics, the costs of populism and central banking’s brave new world.
And stay up to date on the economic front with our AICD Dismal Science podcast.
What I’ve been following in Australia:
What happened:
Yields on Australian government debt and the value of the Australian dollar have both been subject to upward pressure over recent weeks. Expectations around the so-called global ‘reflation trade’ – the assumption that a successful vaccine rollout plus the impact of large-scale fiscal and monetary stimulus will deliver strong growth and rising inflation pressures that will compel central banks like the RBA to tighten monetary policy earlier than officials have indicated is likely – have spilled into local markets, contributing to a marked increase in the yield on Australian ten-year government debt, taking it well above pre-pandemic levels.
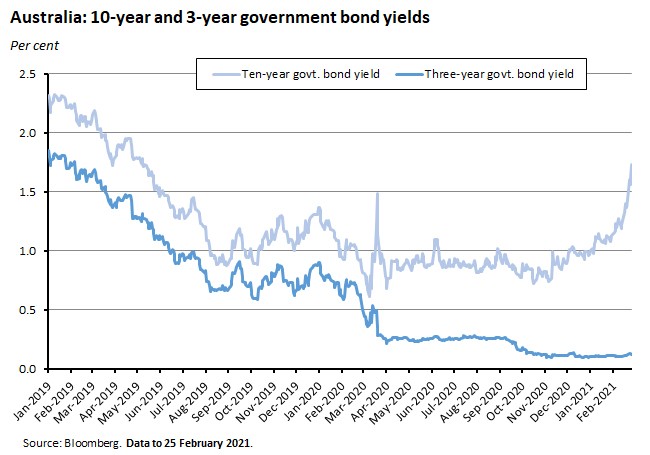
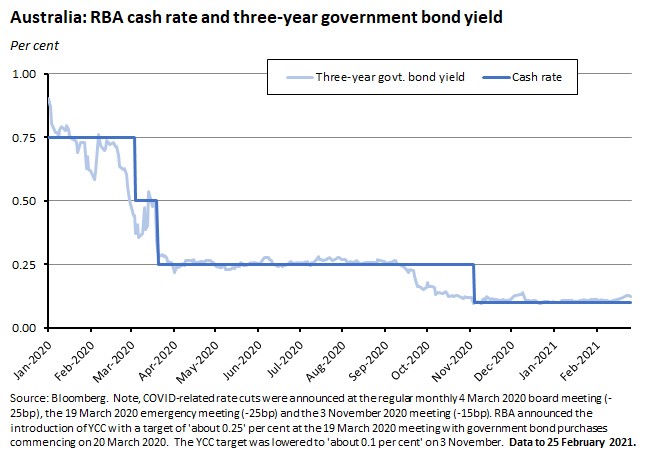
The yield on three-year government bonds – which the RBA has pledged to keep at ‘around’ 0.1 per cent as part of its yield curve control (YCC) program – has remained close to target, but here too there are signs of upward pressure. That pressure saw the RBA this week return to buying short-term bonds as part of YCC for the first time in two months, first with a $1 billion purchase at the start of the week, and then a couple of days later announce its largest purchase of government bonds since the program started in March last year, buying a further $3 billion of short-term bonds as part of YCC alongside an already-scheduled $2 billion purchase of long-term bonds as part of its asset purchase (QE) program.
Higher yields are also adding to pre-existing upward pressure on the Australian dollar, which has been appreciating towards the US$0.80 mark as the Trade Weighted Index (TWI) has moved above 65.
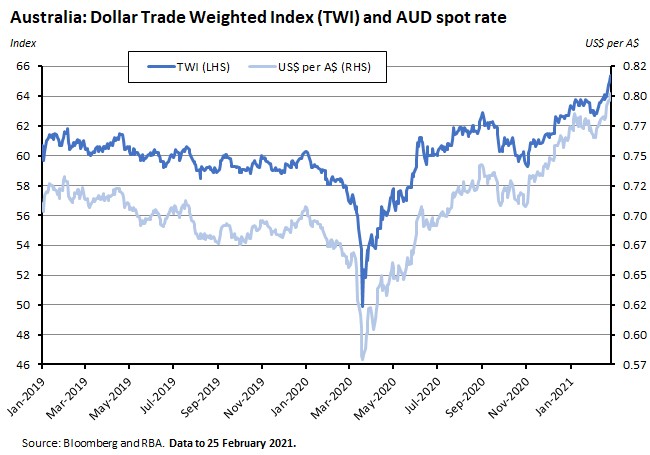
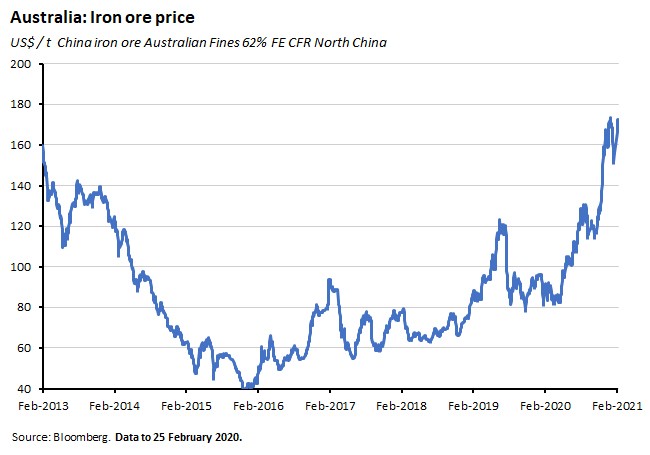
In the case of the exchange rate, higher yields are only part of the story. High commodity prices, led by iron ore, and even speculation about the potential onset of a new ‘commodity supercycle’ have also underpinned Australian dollar strength, along with generally positive domestic news on both the health and economic fronts.
Why it matters:
Neither higher borrowing costs nor an appreciating (real) exchange rate will be welcomed by the RBA, which has still been warning of a ‘bumpy and uneven’ recovery while also making the case that we should expect a period of low interest rates and stimulatory monetary policy for at least several more years. This week’s action suggests many financial market participants are now betting that the RBA is being too conservative on the outlook, and that it will be forced to adjust policy sooner than it has signalled.
All of which puts the RBA in an interesting position. As we’ve discussed in the past, the central bank’s bond purchase programs are not just about directly capping yields and borrowing costs but are intended to put a lid on the level of the dollar. That latter view was reiterated most recently in a speech by Christopher Kent last week, who pointed out that policy had been successful in limiting the degree of currency appreciation given the positive backdrop noted above. Kent told his audience that ‘there has been a general improvement in the outlook for global growth, which has been associated with an appreciation of a range of currencies against the US dollar and a marked increase in many commodity prices. Indeed, the price of iron ore has increased by around 40 per cent since early November. Even so, historical relationships with commodity prices would have implied a much larger appreciation of the Australian dollar than what's actually occurred. While history only provides a rough guide, this difference suggests that the Bank's policy measures have contributed to the Australian dollar being as much as 5 per cent lower than otherwise (in trade-weighted terms).’
This week’s actions in the form of two YCC-related bond purchases suggest that the RBA stands ready to back up its position, further adding to its growing holdings of federal (Australian Government Securities) and state (semis) government paper.
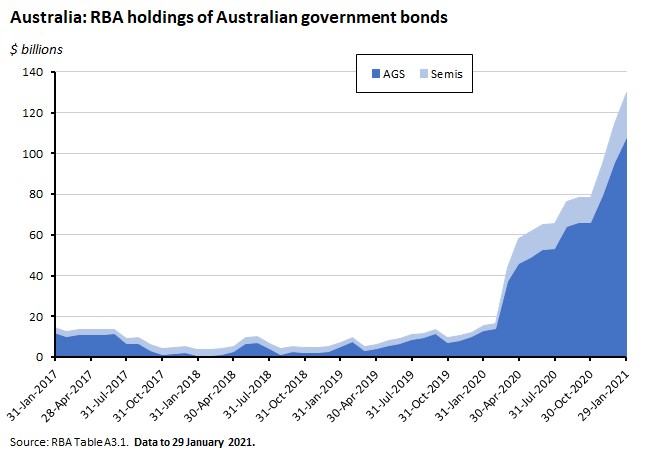
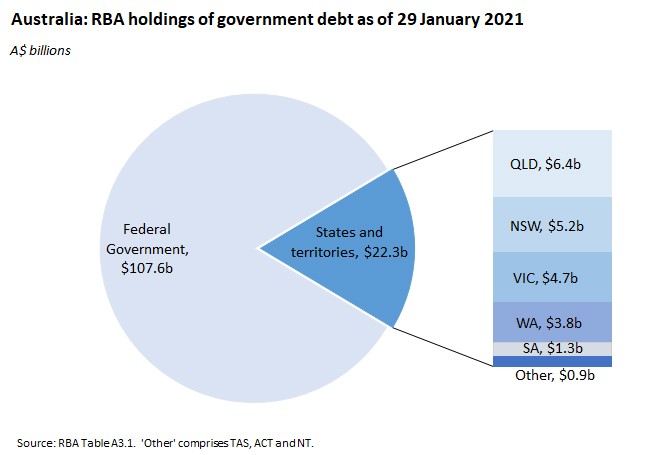
The RBA is not alone in facing the challenge of maintaining stimulative policy settings in the face of markets that are now betting on faster growth and more inflation. As already noted, the ‘reflation trade’ is a global phenomenon, and other central banks are facing similar challenges. For example, the yield on 10-year US Treasuries rose above 1.4 per cent earlier this week for the first time since the start of the Coronavirus Crisis (CVC) while yields on UK, French, German and Italian government debt have also been rising as a worldwide sell off has seen the global bond market suffer its worst start to a year since 2015.
What happened:
According to the ABS, the seasonally adjusted Wage Price Index (WPI) rose 0.6 per cent over the December quarter of last year to be up 1.4 per cent in annual terms.
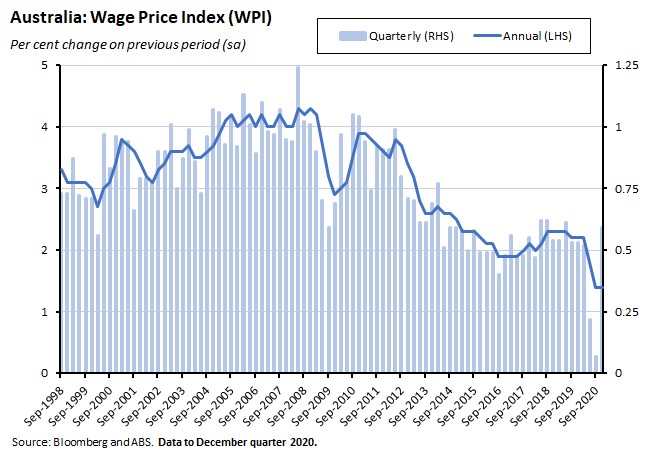
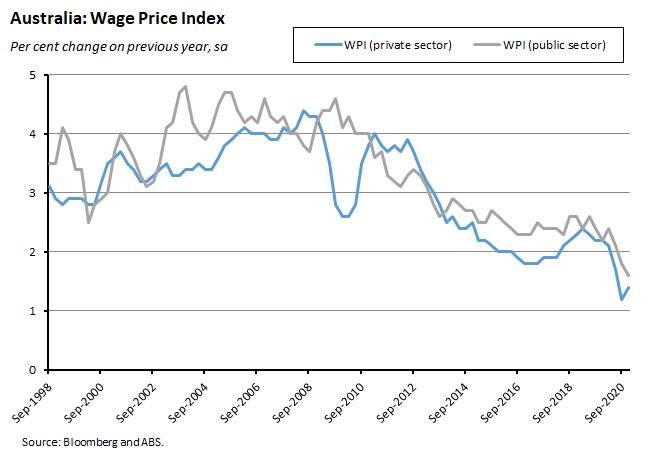
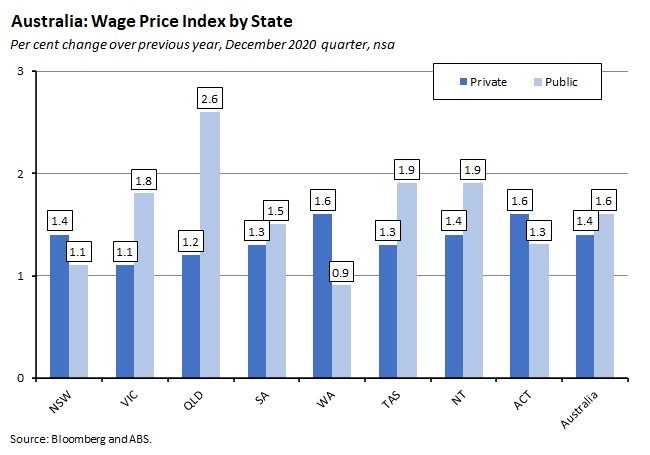
Wages in the private sector rose 0.7 per cent quarter-on-quarter and 1.4 per cent year-on-year, while wage growth in the public sector was 0.3 per cent in quarterly terms and 1.6 per cent in annual terms.
By state, Victoria and the NT recorded the fastest quarterly rise of 0.7 per cent, with the former’s growth reflecting the unwinding of wage reductions across a number of industries recorded in the June and September quarters of last year. In contrast, South Australia and the ACT saw the lowest quarterly WPI increases of 0.2 per cent, reflecting slower public sector wage growth. In annual terms, the rise in the WPI was strongest in Queensland and the NT (both up 1.6 per cent) and lowest in Victoria (up 1.3 per cent).
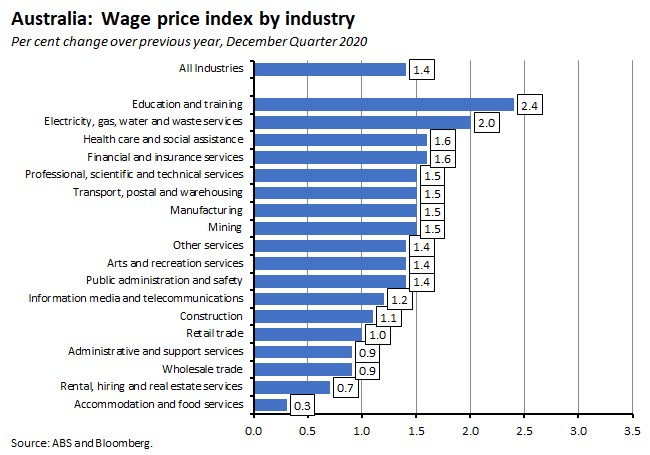
By industry, the strongest quarterly rise in the WPI came in professional, scientific and technical services (up 1.2 per cent) due to the unwinding of short-term wage reductions and subsequent return to previous wage levels. Quarterly growth was minimal (just 0.1 per cent) in accommodation and food services, financial and insurance services and health care and social assistance. In annual terms, the largest increase in the WPI (2.4 per cent) was for education and training while the lowest growth (just 0.3 per cent) was in accommodation and food services. The ABS notes that Award increases were the main driver of annual growth and the timing of these increases has changed due to the phased implementation schedule of last year’s Fair Work Commission (FWC) award increases.
Why it matters:
Market expectations had been for a 0.3 per cent quarterly increase in the WPI and a 1.1 per cent annual gain, so the actual print of 0.6 per cent quarter-on-quarter and 1.4 per cent year-on-year was significantly stronger than anticipated. Even so, the annual rate of WPI increase is still the (joint) lowest in the history of the series, while the 1.6 per cent rise in public sector wages – reflective of public sector wage freezes – was the also the lowest on record.
With the RBA adamant that the future trajectory of monetary policy is dependent on lower unemployment and a tighter labour market leading to faster wage growth and therefore a return of inflation to target, markets are paying close attention to any evidence of an acceleration in wage growth. But despite the stronger than expected result, December’s numbers are unlikely to be a sign of such a shift, with the ABS noting that a large share of private sector wage growth over the quarter was just the restoration of hourly wages back to pre-pandemic levels, following reductions in the June and/or September quarters last year. This, the Bureau said, was most apparent in the case of professional, scientific and technical services, where much of the December quarter’s 1.2 per cent gain was a recovery from a 0.5 per cent decline in wages in the June quarter.
The ABS notes that Q2:2020 saw a significant number of short-term wage reductions across senior executive and higher paid jobs, with the large majority of these reductions then returning to previous wage levels in the following quarters. These changes tend to obscure the underlying pattern of wage growth and to this end the ABS has produced an exclusion-based measure of the WPI that removes the effect of these jobs. For example, in the case of professional, scientific and technical services, the exclusion-based measure shows the quarterly movement in Q2:2020 was growth of 0.3 per cent compared to the fall of 0.5 per cent recorded in the original WPI. Likewise, in Q4:2020 (when most pay reductions were rolled back to pre-COVID wage levels) the exclusion-based quarterly growth for this sector was 0.4 per cent instead of the headline 1.2 per cent growth.
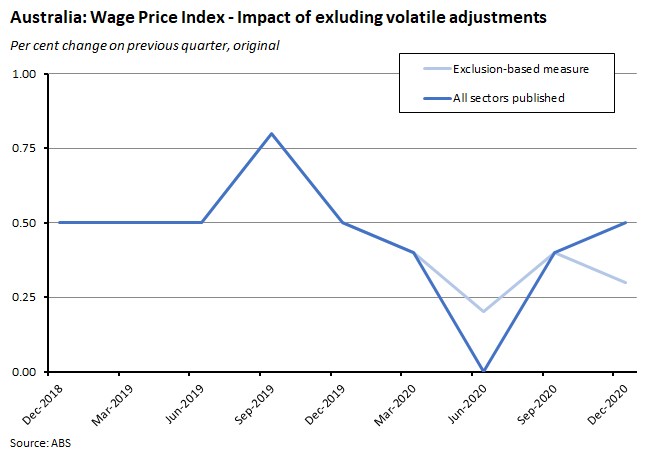
Applying this approach to the WPI overall produces a much smoother profile for wage growth with a smaller decline in Q2 last year followed by a more modest increase in Q4 (0.3 per cent instead of 0.5 per cent over the quarter, original basis).
It’s also worth recalling here that the WPI profile continues to be influenced by the staged implementation of the FWC increases to the minimum wage.
What happened:
Private new capital expenditure rose three per cent (seasonally adjusted) in the final quarter of last year, leaving it down 7.5 per cent relative to the December quarter in 2019.
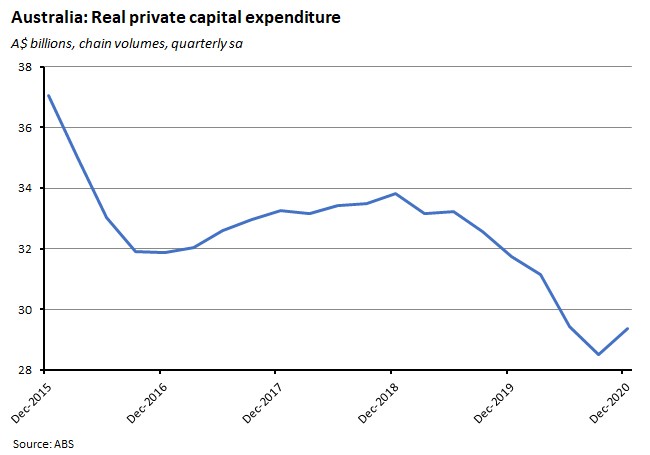
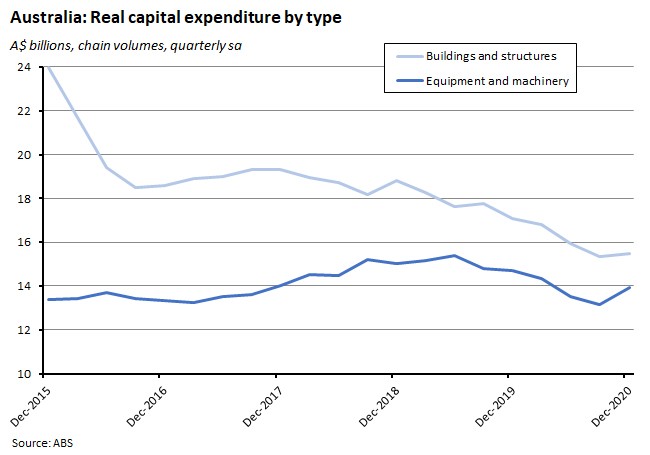
The ABS said that real spending on buildings and structures increased 0.7 per cent over the quarter but fell 9.4 per cent in annual terms, while spending on equipment, plant and machinery rose 5.7 per cent quarter-on-quarter but dropped 5.2 per cent year-on-year.
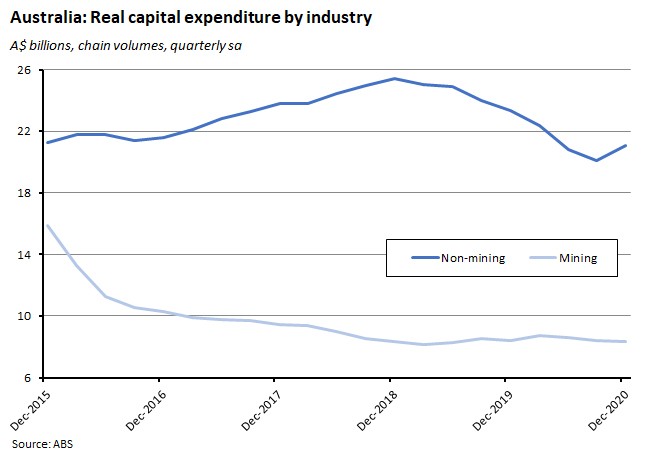
The volume of capital expenditure in mining fell 1.4 per cent in the December quarter relative to the September quarter and was 1.2 per cent lower than in Q4:2019. Meanwhile, capital expenditure in non-mining rose 4.9 per cent across the quarter but was still 9.7 per cent lower than in the corresponding quarter in 2019.
The ABS also reported that Estimate 5 for total (current price) capital expenditure in 2020-21 was $121.4 billion, which is 4.8 per cent up on Estimate 4 for 2020-21 and 4.9 per cent lower than Estimate 5 in 2019-20.
Estimate 1 for 2021-22 was $105.5 billion, which is 3.4 per cent lower than Estimate 1 for 2020-21 (note that first estimates will often vary substantially from final outcomes).
Why it matters:
The consensus forecast had been for a one per cent quarterly gain in Q4, so the three per cent print comfortably outpaced market expectations and will therefore be viewed as a decent result, indicating the start of a recovery in investment spending. The 5.7 per cent rise in investment on equipment, plant and machinery will also be seen as evidence that the government’s tax incentives for capex are getting some traction.
Even so, that still left investment spending down 7.5 per cent relative to what had already been a fairly weak Q4:2019 result. That’s not a surprise: the high level of uncertainty over the past year plus the sheer amount of economic dislocation, including the biggest quarterly GDP drop on record, was always going to serve as a major headwind for business investment. But it does serve as a reminder that investment levels are still low, and that a sustained economic recovery, including a return to a decent pace of productivity growth, remains conditional on a pickup in business investment.
Note that the December 2020 quarter release included several important changes, with the ABS now publishing volume estimates for the education and training and health care and social assistance industries for the first time. Instead of reporting these separately as ‘experimental estimates’ they are now included alongside other industries as part of the overall total. In addition, instead of reporting three broad industry groups (mining, manufacturing and other selected industries), the ABS now reports on two broad categories: mining and non-mining.
What happened:
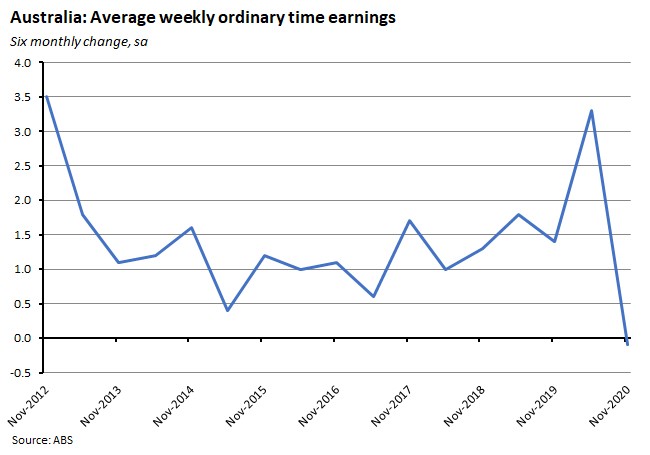
The ABS said that estimates for average weekly ordinary time earnings (for full-time adults, seasonally adjusted) rose 3.2 per cent to $1,711.60 from November 2019, but were down 0.1 per cent over the six months relative to May 2020. Full-time adult average weekly total earnings were up 2.7 per cent over the year to $1,767.20 and all employees average weekly total earnings were up 1.9 per cent to $1,280.30 over the same period.
Full-time adult average weekly ordinary time earnings in the private sector rose 3.2 per cent over the year to November 2020, to $1,669.70, while the corresponding figures for the public sector were a 2.6 per cent increase to $1,863.70.
Why it matters:
The ABS pointed out that November 2020 was the first time that there had been a fall in average weekly earnings over a six-month period: In the five years prior to the pandemic, six-monthly increases were all between 0.4 per cent and 1.8 per cent.
Movements in average weekly earnings have been skewed by changing employment composition effects during the pandemic. In May 2020, for example, the Bureau notes that there was a sharp increase in earnings relative to November 2019 of around 3.3 per cent. That jump was the consequence of a large share of job losses in lower paid jobs and industries, which produced an increase in the average wage. By November, the recovery in jobs towards the lower end of the wage distribution had returned the average to a lower level, and the 3.2 per cent annual growth relative to November 2019 was similar to the 3.3 per cent annual growth between November 2018 and November 2019.
What happened:
Preliminary estimates from the ABS for January 2021 suggest that goods exports fell nine per cent over the month while imports dropped by ten per cent. In annual terms, the value of merchandise exports was up 13 per cent on the January 2020 result while merchandise imports were down seven per cent compared to the same month last year.
Australia recorded a trade surplus of $8.8 billion (original terms, merchandise trade only) in January.
Why it matters:
The ABS pointed to a ten per cent decline ($1.5 billion fall) in exports of metalliferous ores as behind the drop in monthly goods exports in January, mainly reflecting a decline in iron ore exports to China (down $471 million) and Japan (down $496 million). Even so, exports of metalliferous ores in January were still the second highest on record, behind only December 2020’s result.
On the import side of the equation, the Bureau highlighted a 23 per cent ($845 million) fall in imports of road vehicles, noting that a drop in global car manufacturing was leading to supply shortages, with the imports of road vehicles from Japan and Thailand, Australia’s two largest road vehicle source countries, driving the decline in January imports.
What happened:
Another set of preliminary estimates from the ABS indicated that total construction work done in the December 2020 quarter was down 0.9 per cent relative to the September quarter and 1.4 per cent below work done in Q4:2020.
The fall in overall work done was driven by engineering construction, which fell 2.8 per cent in the December quarter, and was 0.3 per cent below Q4:2020. Building work done rose 0.6 per cent over the quarter but was still 2.2 per cent lower than at the same time last year.
Why it matters:
Construction work in the final quarter was weaker than expected: the consensus forecast had been for a one per cent gain over the quarter instead of an (almost) one per cent fall. That in turn suggests that some of the anticipated Federal and State government public investment spending has yet to roll out, consistent with reported declines in public sector work done over the quarter.
Finally, note that while overall building work done was up only 0.6 per cent over the quarter, residential construction was up 2.7 per cent versus a 2.4 per cent decline for non-residential construction, highlighting the different fortunes of the two sectors as last year drew to a close.
What happened:
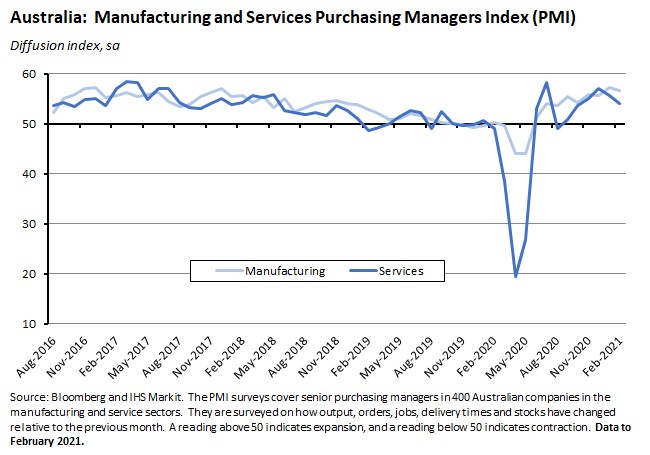
The ‘flash’ estimate for the IHS Markit Composite PMI slipped (pdf) to 54.4 in February from 55.9 in January but remained comfortably in positive territory.
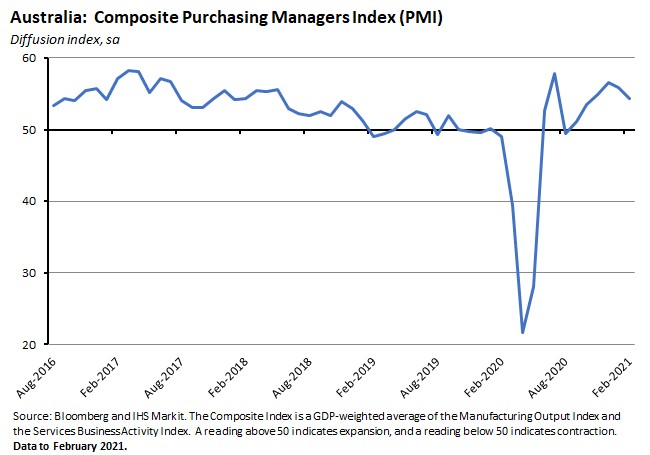
The flash Services Activity PMI for February eased to 54.1 from 55.6 in January, while the flash Manufacturing PMI dropped to 56.6 from 57.2.
Why it matters:
The Composite and Services PMIs both fell to a four-month low in February while the manufacturing PMI dropped to a two-month low. Even so, all three indices remained in positive territory and a such continued to signal an ongoing expansion in private sector activity, with the Composite and Services PMIs now having been above 50 for six consecutive months and the Manufacturing PMI above neutral for nine months.
Other points of note from the surveys included the strongest pace of recorded job creation since late-2018, along with some signs of price pressures with rising input costs in particular (according to IHS Markit, they rose at the fastest pace in about five years of data collection), and evidence of ongoing disruption to supply chains, at least partly reflecting global shipping problems, as captured by a marked lengthening in supplier lead times.
What happened:
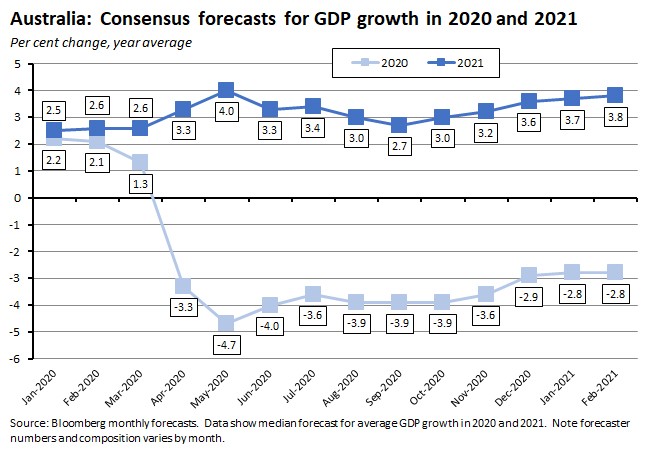
Bloomberg’s February 2021 survey of economists shows that the median forecast is for the Australian economy to have contracted 2.8 per cent last year, to grow by 3.8 per cent this year, and then to expand by 3.3 per cent in 2022.
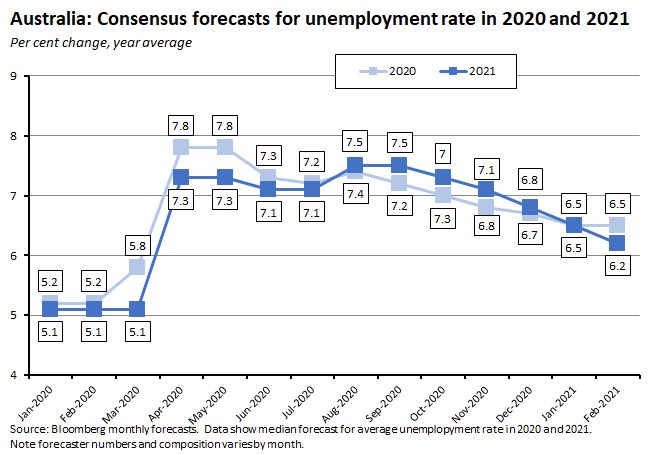
The median forecast for the unemployment rate is for a decline to 6.2 per cent by the final quarter of this year, followed by a further drop to 5.6 per cent by the end of the June quarter in 2022.
The rate of CPI inflation is expected to still be around 1.6 per cent by mid-2022, while the RBA cash rate is projected to be unchanged at 0.1 per cent out to at least Q2:2023.
Why it matters:
A look at the median forecasts for GDP growth in 2020 and 2021 shows a gradual upgrade to growth projections starting from around October as forecasters began to pencil in a shallower recession than had been feared during the earlier stages of the pandemic, as well as a slightly stronger bounce back in activity this year. Forecasts for unemployment follow a similar trajectory, although they appear to lag the actual pace of labour market recovery (see last week’s discussion on the job market).
Even according to that optimistic take on the outlook, however, the consensus assumes that inflation remains below the RBA’s target out to at least the middle of next year and no change to the cash rate is expected for at least the next two years. That’s less bullish than the implicit market view discussed earlier.
What happened:
The ANZ-Roy Morgan weekly Index of Consumer Confidence fell 0.6 per cent to an index level of 109.2 over the week to 20-21 February.
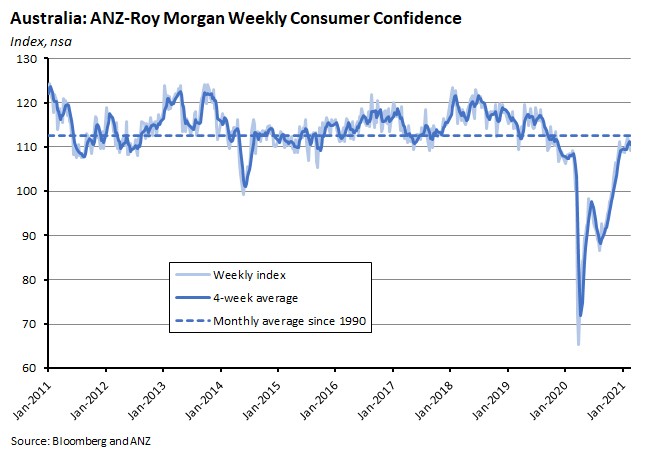
There was a mix of movements in the various subindices over the week, with ‘future economic conditions’ up, ‘current economic conditions’ unchanged, slight falls for both ‘current financial conditions’ and ‘future financial conditions’, and a larger drop in ‘time to buy a major household item’.
Why it matters:
This is the third consecutive weekly drop in Consumer Confidence, although in all three cases the declines have been quite small, and the overall impact has been to leave the index close to its long run average, suggestive of an element of consolidation in household sentiment following the sharp rebound seen in previous months.
What happened:
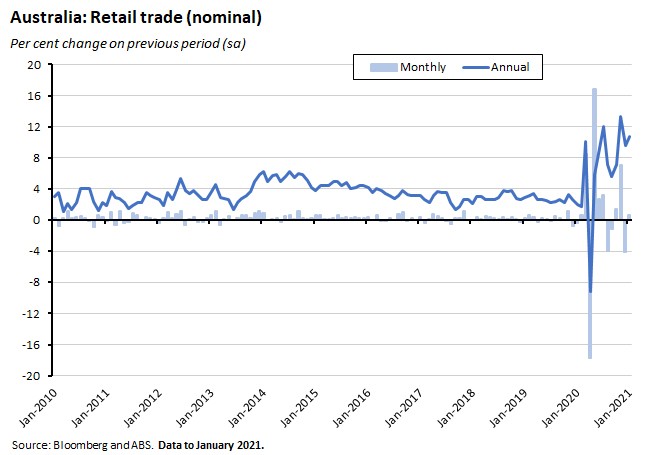
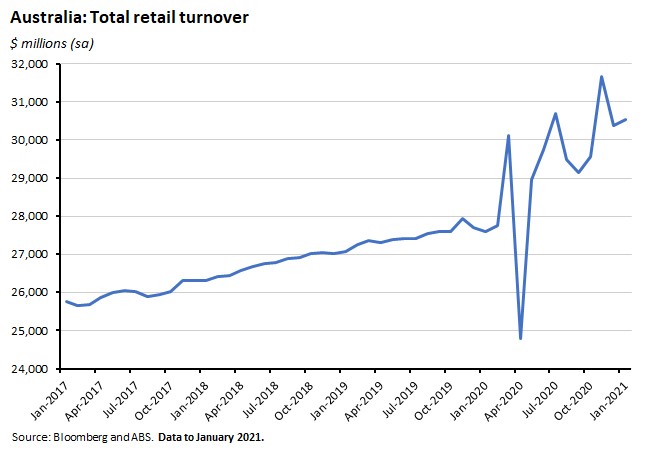
Last Friday, the ABS reported preliminary estimates for retail turnover in January 2021, based on businesses that make-up approximately 80 per cent of total retail (final numbers will be published on 4 March). Turnover was up 0.6 per cent over the month (seasonally adjusted) and was 10.7 per cent higher than in January 2020.
By state, turnover rose over the month everywhere except Queensland, which suffered a 1.5 per cent drop as COVID-19 restrictions in Brisbane led to falls in activity, especially across household goods retailing, clothing, footwear and personal accessory retailing, and department stores. Elsewhere, NSW enjoyed the largest monthly increase with a one per cent rise following the easing of public health restrictions across Greater Sydney.
By industry, food retailing was up 1.8 per cent, bouncing back from a 1.7 per cent decline in December 2020. The Bureau noted that Victoria and NSW led the rises in supermarkets, after restrictions had impacted Christmas celebrations in December 2020. There were falls in clothing, footwear and personal accessory retailing, household goods retailing, and department stores, which were all hit by the three-day lockdown in Brisbane referenced above.
Why it matters:
The pattern of lockdown and easing continues to shape activity across Australia. Last month, the relaxation of restrictions in the Sydney region prompted a rise in activity in NSW even as a short lockdown in Brisbane pulled down activity in Queensland. Overall, however, and despite the variation by state, total turnover is now running at more than ten per cent above the levels reached in the same period last year.
What I’ve been reading . . .
The ABS has released the results from two sets of its Household Impacts of COVID-19 surveys. The December 2020 survey looked at attitudes toward COVID-19 vaccines and testing, finding that 73 per cent of Australians either agreed or strongly agreed that they would get a vaccine if it became available and was recommended for them. The most commonly reported factors that would ‘very much’ or ‘completely’ affect the decision to get vaccinated were whether the vaccine had been in use for a long time with no serious side-effects (67 per cent) and whether it was recommended by their GP or other health professional (61 per cent) or the Department of Health (58 per cent). At the same time, 50 per cent of Australians said they would definitely get a COVID-19 test if they had mild respiratory infection symptoms, while 73 per cent of the remainder of people would get a test if they had severe respiratory infection symptoms. Released just a few days later, the January 2021 survey reported on attitudes to managing physical and mental health and views around precautions taken in response to COVID-19 and attitudes to social gatherings.
Deloitte on the future of government pandemic support and in particular the upcoming transition off JobKeeper, which will see a reduction of around $5 billion per month in government support flowing into the economy.
ANZ Bluenotes covers the latest results from the ANZ Stateometer: regional Australia has tended to hold up better than metro Australia.
The government said that it would permanently increase the rate of JobSeeker by $50 a fortnight as part of a package of measures targeting the social safety net. The new payment will replace the temporary Coronavirus Supplement, which started life on 27 April 2020 at $550 per fortnight before falling first to $250/fortnight and then to $150/fortnight. Whiteford and Bradbury reckon that’s not very generous by international standards. Grattan Institute researchers agree.
Related, this piece looks at how the original Coronavirus Supplement could be seen as a UBI-like experiment, and introduces some modelling of the potential cost of one approach to generating a basic income style payment based around the idea of ‘affluence testing.’
Ross Garnaut sets out some of the arguments in his new book, Reset.
Rod Sims ran through the ACCC’s compliance and enforcement priorities for this year.
Greg Earl on Australian wine exporters’ China challenge: three months ago, Chinese customers drank 50 per cent of Australian red wine exports. By last month, that was down to just one per cent, with tariffs of 100 per cent or more on Australian product.
More on the debate around the Biden fiscal package in the United States. This WSJ piece offers a useful dive into what’s in the ‘American Rescue Plan’ while Martin Wolf in the AFR thinks that the US$1.9 trillion package represents a ‘risky experiment’ and that this risk could be reduced if the spending target was ‘somewhat smaller’ in size.
An FT Big Read on McKinsey. Does ‘the firm’ have a culture problem?
An Economist magazine Briefing on decarbonising the United States. The obstacles appear formidable.
Tyler Cowen presents his ‘four basic truths of macroeconomics’: (1) a large adverse shock to demand usually leads to a loss of output and employment; (2) well-functioning central banks can offset these shocks to a large degree and even prevent them happening; (3) but if central banks ‘go crazy’ increasing the money supply, the result will be high inflation (exception: 2008 and 2009); and (4) non-monetary shocks including pandemics can also create recessions or depressions, and central banks can only partially stabilise such shocks.
This essay from the Peterson Institute argues that the world should prepare for living in a ‘pandemic era’: more investment in research in infectious diseases and vaccine development, genomic surveillance efforts, and public health infrastructure.
A review of the economic costs of populism based on data looking at 50 populist presidents and prime ministers over the period 1900–2018. The historical record suggests populism brings with it the risk of long-run decline in consumption and real GDP per head along with protectionist trade policies and unsustainable debt dynamics. In addition, populism is also found to be associated with political instability and institutional decay. Despite that dismal record, once countries have caught the populist bug, they find it difficult to recover: Having been ruled by a populist in the past is a strong predictor of populist rule in recent years.
Two from the IMF. First, the debate over inflation and the US fiscal package, as Fund Chief Economist Gita Gopinath judges that the ‘evidence from the last four decades makes it unlikely, even with the proposed fiscal package, that the U.S. will experience a surge in price pressures that persistently pushes inflation well above the Fed’s 2 percent target.’ Globalisation, automation and stable inflation expectations all argue against a surge in prices, she argues, although she also concedes that ‘because these are uncertain times with almost no parallel in history, extrapolating from the past is risky. Because of exceptional policy measures in 2020, including fiscal spending by G7 countries of 14 percent of GDP—well above the cumulative 4 percent of GDP spent during the financial crisis years of 2008–10—household savings rates in advanced economies are at multi-year highs and bankruptcies are 25 percent lower than before this pandemic. As vaccine protection becomes widespread, pent-up demand could trigger strong recoveries and defy inflation projections based on evidence from recent decades.’ Second, while Asian economies overall are performing well, the diversity of economic experience in the shadow of the coronavirus is striking.
Daron Acemoglu (co-author of Why Nations Fail and The Narrow Corridor) on the case for a higher US minimum wage. His view is that the balance of empirical economic evidence has shifted (a shift covered in previous readings) and that in addition, the socio-political case is compelling. On the other hand, Acemoglu does concede that ‘it is reasonable to question whether the same minimum wage should be applied to all parts of the country, considering the cost-of-living differences between New York and Mississippi, or Massachusetts and Louisiana.’
Ray Dalio asks, are we in a stock market bubble?
Jean Pisani-Ferry surveys the brave new world of central banking.
Latest news
Already a member?
Login to view this content


