
The monthly Westpac-Melbourne Institute Index of Consumer Sentiment rose to a ten-year high in December. Reinforcing the message that households are ending the year in a positive mood, the weekly ANZ-Roy Morgan Consumer Confidence Index has now risen for 13 of the past 14 weeks.
Businesses are feeling better about the outlook, too: NAB’s monthly index of Business Confidence rose for a fourth consecutive month in November, recorded its largest monthly increase since May and is now at its highest level since April 2018. ANZ Job Ads jumped 13.9 per cent over November but were still down in annual terms. Labour account data showed the total number of jobs in the economy increased by 303,400 in the September quarter. The ABS said that residential property prices across Australia’s capital cities rose 0.8 per cent in the September quarter of this year to be up 4.5 per cent over the year. Retail turnover rose 1.4 per cent (seasonally adjusted) over the month in October and was up 7.1 per cent from October 2019. The Global Composite PMI edged slightly lower in November on weaker service sector activity but has now been signalling an economic expansion in overall business activity for five consecutive months. Bloomberg’s Alternative High Frequency data show emerging markets continued to outperform developed economies over the closing weeks of 2020 while its set of activity indicators have softened across much of the G7 through late November and into early December.
This week’s readings include the negative yields on Australian T-notes for the first time, a new Bulletin from the RBA along with an explainer on unconventional monetary policy, ABS data on the serious economic damage inflicted on Australia’s tourism sector during the opening months of the pandemic, the possible shape of Australia’s post-COVID workforce, the influence of policy choices on the post-pandemic world more generally, a defence of the Washington Consensus and a discussion on the Big Questions of Economics.
This Wednesday, I gave a webinar on some economic lessons from 2020 and their implications for the outlook for 2021. Despite the travails that have marked much of this year, I found myself delivering a relatively upbeat assessment of where we seem to have ended up, at least here in Australia. That said, the events of 2020 serve as a reminder of the importance of humility when making any predictions about the year to come…
What I’ve been following in Australia . . .
What happened:
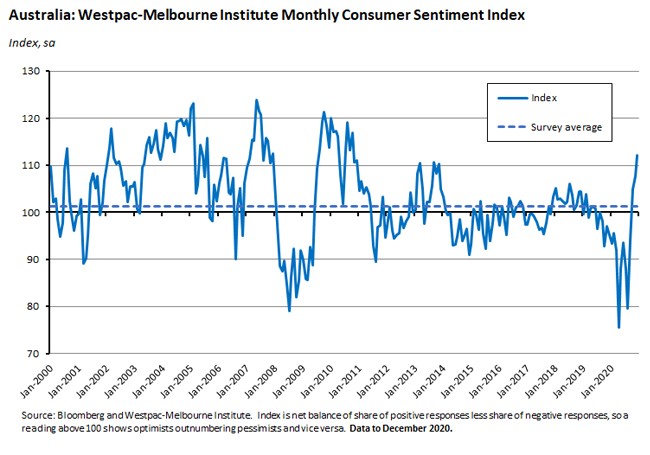
The Westpac-Melbourne Institute Index of Consumer Sentiment rose (pdf) 4.1 per cent in December to reach an index level of 112.
Four of the five component indices showed an increase this month:
- The ‘economy, next 12 months’ sub-index jumped 9.9 per cent to 111.9, hitting a ten-year high.
- The ‘economy, next five years’ sub-index rose 5.9 per cent to 121.1, recording its strongest reading since December 2009.
- The ‘finances vs a year ago’ sub-index increased 6.9 per cent but at 96.1 remained in negative territory.
- The ‘finances, next 12 months’ sub-index fell 1.8 per cent to 108.9.
- And the ‘time to buy a major household item’ sub-index edged up 0.7 per cent.
The Westpac–Melbourne Institute Unemployment Expectations Index dropped 16.2 per cent to 106.3 implying a major easing in job loss concerns (a lower reading indicates that a smaller number of consumers expect unemployment to rise in the year ahead). This was the best reading for the Unemployment Index for nearly ten years
Why it matters:
The monthly sentiment index is now at a 10-year high after recording its best result since October 2010. It has taken sentiment about eight months to recover from the COVID-19 shock and Westpac economists point out that this indicates a particularly rapid recovery in household confidence. For example, sentiment had only recovered by 8.4 per cent after a similar eight month period following the low it reached during the global financial crisis, and it took a full year before the index was clearly signalling that the crisis had passed. Similarly, in the case of the early 1990s recession it took nearly three years before consumer sentiment enjoyed a sustained upswing from its recession lows.
The survey details for December indicate that much of this month’s improvement in consumer confidence reflected better perceptions around the health of the economy (with both economic sub-indices hitting multi-year highs) and around the state of the labour market.
Positive news on vaccine development also appears to have played an important role, with Westpac highlighting a surge in sentiment both amongst those working in the health sector (including many frontline workers that would be at most risk of contracting COVID) and in the 55–64 year age group (an age segment that is more susceptible to serious virus–related health problems).
What happened:
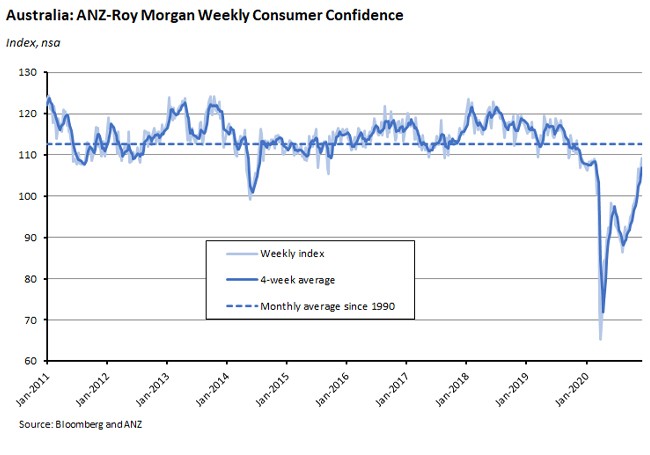
The ANZ-Roy Morgan Weekly Consumer Confidence index rose 1.7 per cent to an index reading of 109.3 on 5/6 December.
Four out of five subindices increased over the week with the biggest gain coming in ‘current economic conditions’ (up 2.9 per cent). The only exception was ‘current financial conditions’ which edged lower by 0.6 per cent.
Why it matters:
While not as dramatic as the surge to a ten-year high in the monthly indicator reported above, the weekly index is also telling a good story about households’ positive outlook on the world. The ANZ-Roy Morgan measure has now risen for a second week in a row and has improved for 13 of the past 14 weeks (only interrupted by news of the – short – South Australia lockdown). The index is now at its highest level in more than a year, since November 2019, and this is the first time in 18 months that consumer confidence has risen in year-on-year terms.
What happened:
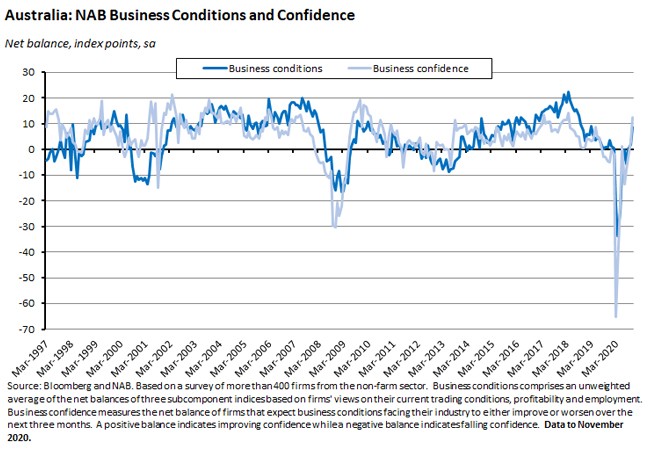
According to the NAB monthly business survey, business confidence rose nine points to plus 12 index points in November, while business conditions rose seven points to plus nine index points.
Business conditions rose in all industries with the exception of wholesale trade. Mining, construction and retail trade saw the largest monthly increases and all industries are now in positive territory, save for the two exceptions of construction and recreation and personal services.
Business confidence rose in all industries in November except for construction and mining, with the largest gains coming in retail and wholesale trade. Confidence is now positive across all industries.
Victoria enjoyed a large gain in business confidence in November, although business conditions fell.
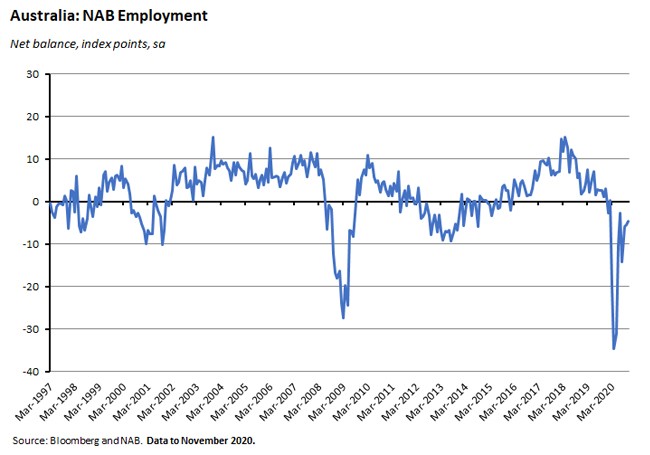
By sub-component, trading and profitability drove the overall gains in business conditions in November, with both up ten points over the month. However, the employment index remained in negative territory, little changed at just a bit above minus five index points.
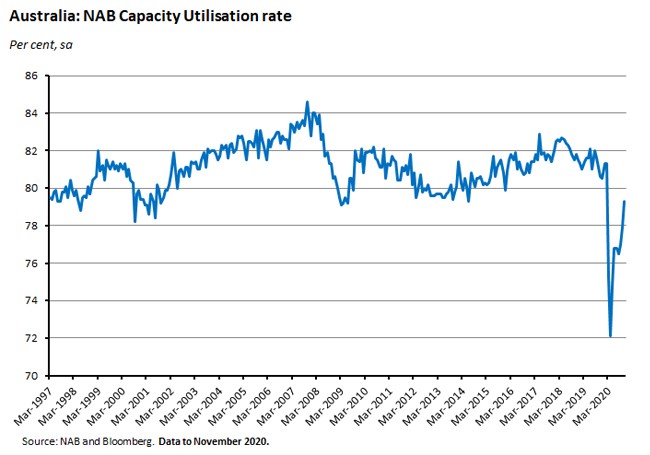
Capacity utilisation rose to 79.3 per cent in November from 77.9 per cent in October.
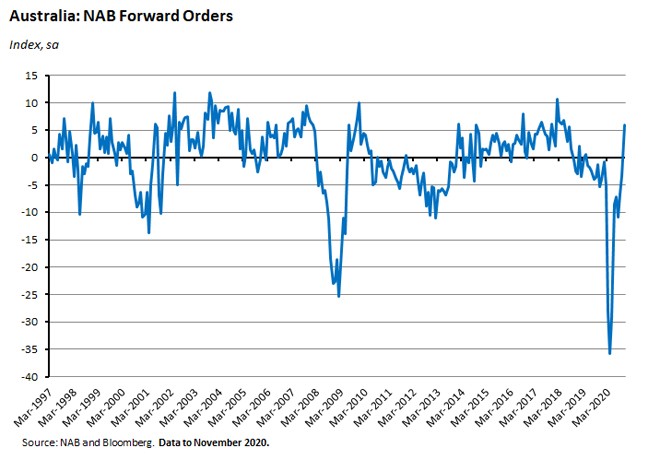
Forward orders index returned to positive territory in November, rising by nine points to plus six index points.
Why it matters:
This week brought good news on the state of business expectations to complement the positive signals from consumers. Business confidence rose for a fourth consecutive month in November and recorded its largest monthly increase since May this year, leaving the index at its highest level since April 2018. The improvement in confidence was led by a strong rise in Victoria and a significant gain in New South Wales.
Business conditions rose for a third consecutive month (although the index fell in Victoria) and are not at their strongest since March 2019. Readings on trading and profitability are improving, although continued weakness in the employment indicator is less positive for the labour market and contrasts somewhat with the improvement in household expectations around the labour market reported for December in the Westpac survey reported above.
Forward indicators suggest that the recovery in both confidence and conditions has room to continue, with the average rate of capacity utilisation rising this month (although it remains below its long run average of 81 per cent) and a strong increase in forward orders, which are now running above average.
What happened:
ANZ Job Ads rose 13.9 per cent over November but were still down 3.3 per cent over the year.
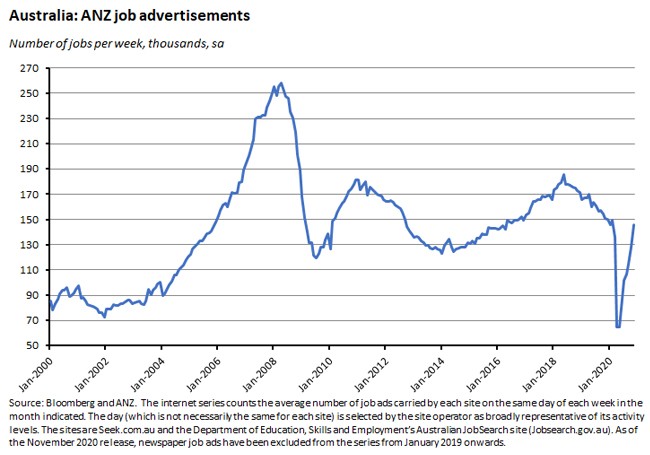
Note that there was a change in methodology this month, with the series now excluding newspaper job ads and only reporting internet-based ads.
Why it matters:
ANZ put November’s increase down to the re-opening of the Victorian economy, which has seen Job Ads climb by 27 per cent over the past two months. They are now 4.7 per cent lower than their pre-pandemic (February 2020) level and ‘on track to meet or even exceed pre-COVID levels by year-end’, which should be good news for employment growth. <p.What happened: </p.
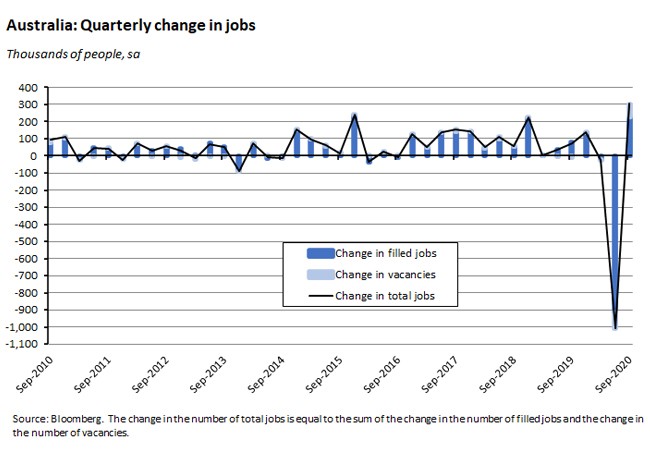
The ABS released the September quarter Labour Account numbers. The data show that in the September quarter of this year, the total number of jobs increased by 303,400 (or 2.2 per cent), comprising an increase of 74,800 job vacancies and an increase of 228,700 filled jobs.
Hours worked increased by 4.5 per cent in Q3 and the number of employed persons rose by 0.9 per cent to 12.9 million. There was a marked increase in the number of multiple job holders (up by 17.5 per cent) and in the number of secondary jobs (up by 135,700 or 16.9 per cent vs. a rise of 92,900 or 0.7 per cent for main jobs).
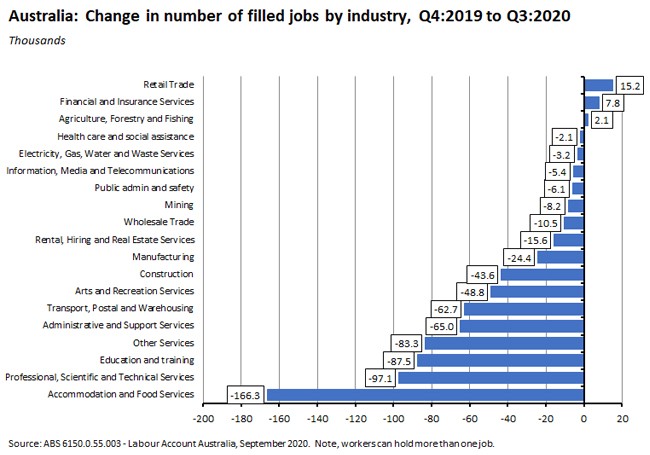
By industry, since the end of last year only three sectors (retail trade, financial and insurance services, and agriculture) have added filled jobs. In absolute terms, the biggest cumulative losses have been suffered by accommodation and food services, professional, scientific and technical services, and education and training.
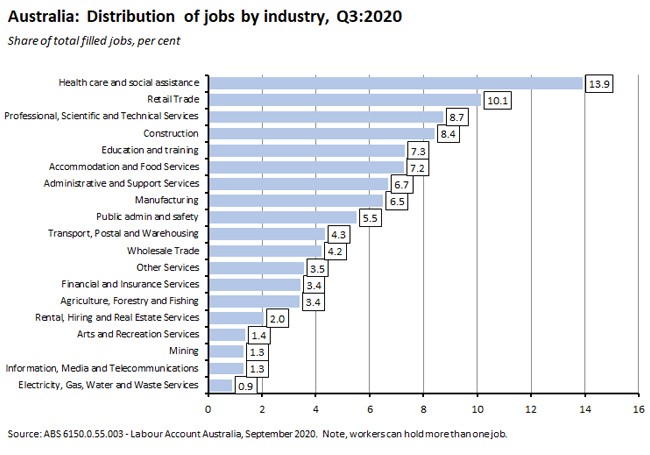
As of the September quarter, health care and social assistance accounted for the largest share of filled jobs in the economy (just shy of 14 per cent), followed by retail trade and then professional, scientific and technical services.
Why it matters:
The Labour Account data offer a complementary perspective to that provided by the Labour Force survey data that underpin the monthly unemployment and employment results. In particular, the ABS considers the Labour Account to be the best source of headline information on employment by industry, because the data reflect how businesses have been officially categorised, rather than how employed people describe the business they work in (for example, the ABS suggests that case of an employee of a business engaged in engineering construction who works on a coal mine site may incorrectly describe their industry of employment as coal mining and not construction).
The Q3 data reflect the recovery in the jobs and hours worked that have already been reported in the labour force survey results. They also show a recovery in the rate of multiple job holding, which increased to 5.7 per cent of all employed people in Q3 from a record low of 4.9 per cent in Q2. Many of these secondary jobs are in industries that had been hit by COVID-19 restrictions, such as administrative and support services, so the pickup in numbers is consistent with the re-opening of the Australian economy.
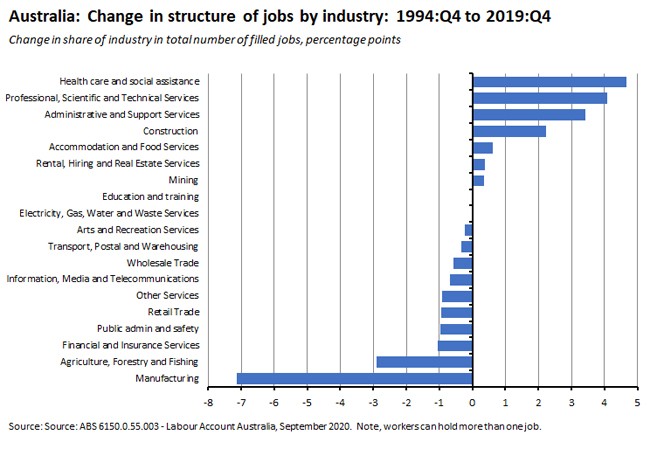
Finally, the data also paint an interesting picture of the shifting pattern of employment in the Australian economy. The chart below shows the change in the share of total filled jobs by industry between Q4:1994 and Q4:2019 (so pre-pandemic). The familiar story of structural change is visible in the numbers, with the biggest decline in the share of jobs taking place in manufacturing (down more than seven percentage points) and in agriculture, and the largest gains taking place in health care, professional services, and administrative and support services.
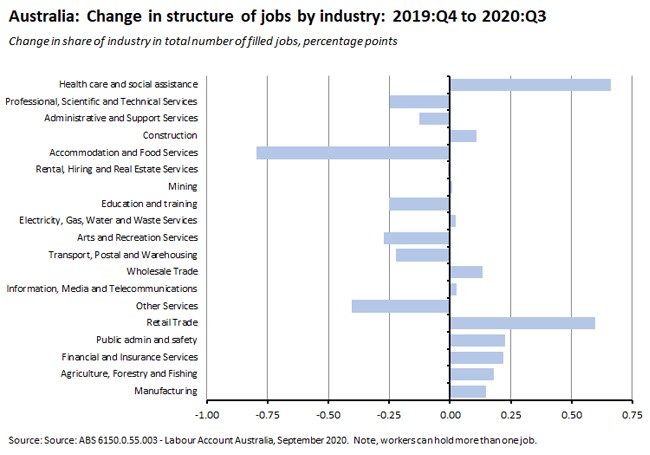
The next chart repeats the exercise but looks at the change in job share by industry over the past three quarters. It ranks industries in the same order as before, and shows that the impact of the pandemic has worked to reinforce long-running trends in some sectors (pushing up the share of jobs in health care and social assistance even further and also contributing to an additional rise in the share of construction) but in other cases has worked in the opposite direction (squeezing jobs in professional and administrative services while contributing to a relative rise in employment in retail trade).
What happened:
The ABS said that residential property prices (the weighted average for the eight capital cities) rose 0.8 per cent in the September quarter of this year to be up 4.5 per cent relative to Q3:2019.
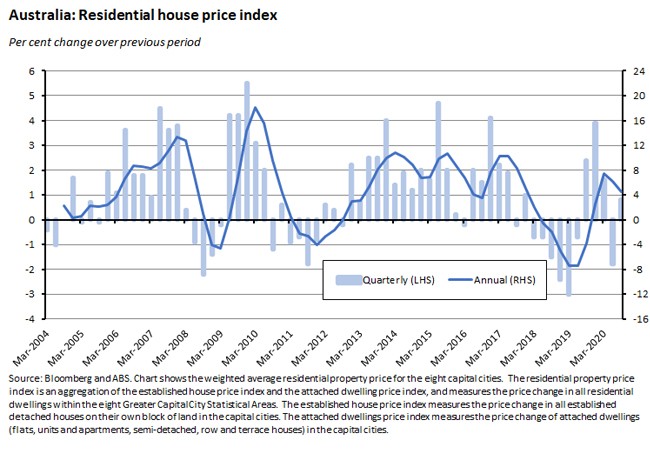
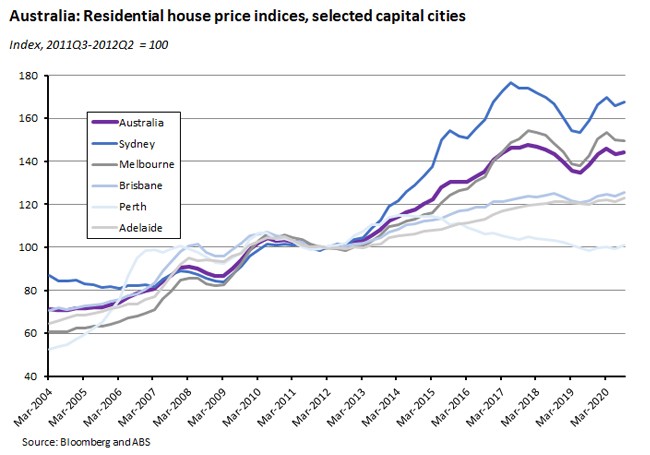
Capital city Residential Property Price Indexes rose in every city except Melbourne (down 0.3 per cent) over the September quarter. Prices were up one per cent in Sydney, 1.5 per cent in Brisbane, 1.4 per cent in Perth, 1.6 per cent in Adelaide, 0.9 per cent in Canberra, 1.2 per cent in Hobart, and 0.8 per cent in Darwin. Relative to the same quarter in 2019, prices were higher in every city except Darwin.
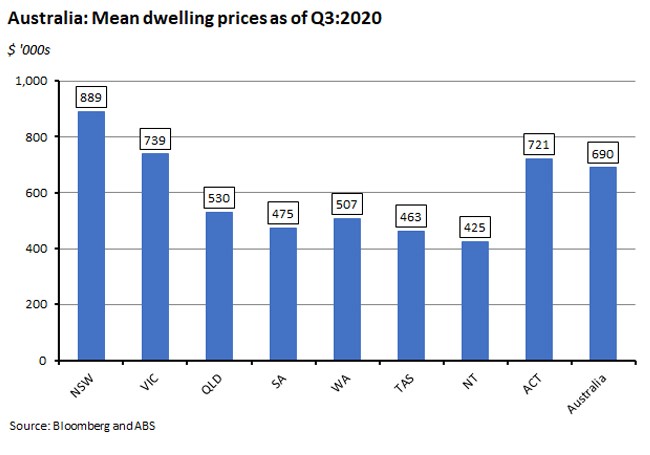
The total value of Australia’s 10.6 million residential dwellings rose to $7,283.3 billion in Q3:2020 and the mean price of residential dwellings in Australia is now almost $690,000. The mean price of dwellings varies from a little over $425,000 in NT to almost $889,000 in New South Wales.
Why it matters:
The ABS Q3 house price results are broadly in line with the story told by the monthly CoreLogic dwelling values series – Australia’s housing market has started to recover. The monthly data also show that recovery continuing into the final quarter of the year.
The data are also consistent with the idea that housing market performance differs by type of dwelling, with houses outperforming detached dwellings: the ABS House Price Index rose one per cent this quarter and five per cent over the year, while the ABS Attached Dwellings Price Index rose 0.3 per cent over the quarter and 3.1 per cent over the year.
What happened:
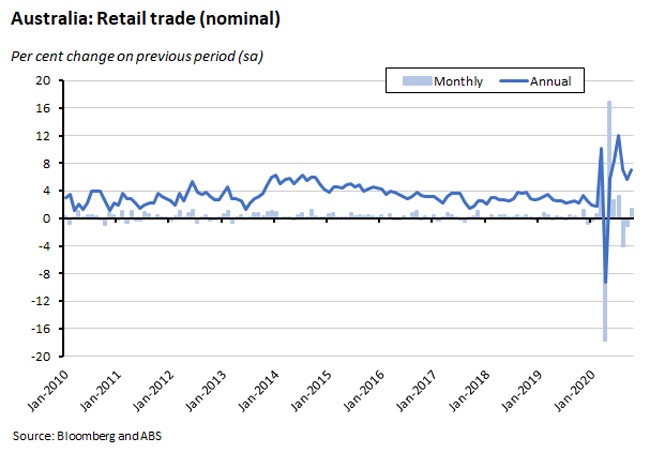
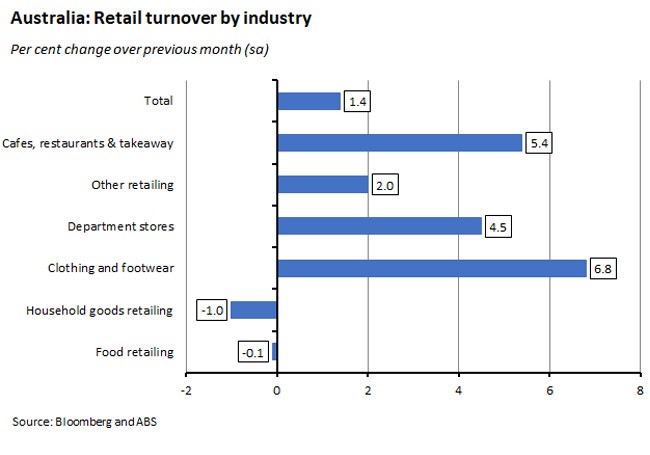
Last Friday, the ABS reported that retail turnover rose 1.4 per cent (seasonally adjusted) over the month in October and was up 7.1 per cent on October 2019.
By industry, growth in turnover across the month was strongest in clothing, footwear and personal accessories followed by cafes, restaurants and takeaway food services.
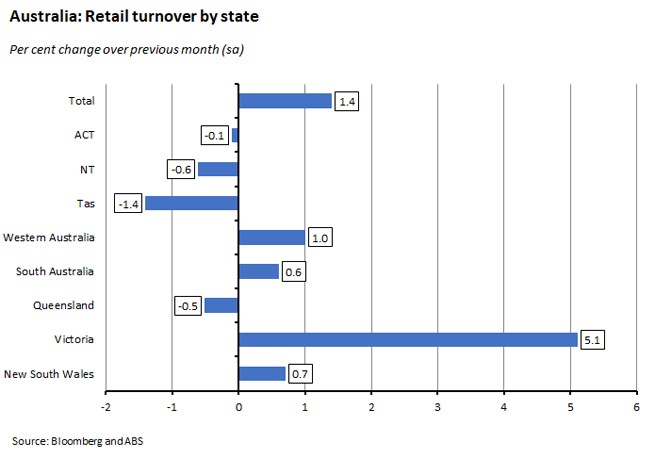
By state, turnover in October rose the most in Victoria, followed by Western Australia.
Online sales made up 10.4 per cent of total retail turnover in October 2020, down a little from 10.6 per cent in September but up from the 6.6 per cent share online sales held in October 2019.
Why it matters:
The final result for retail sales in October was a little bit softer than the preliminary estimates of a 1.6 per cent monthly gain but that still left the annual pace of growth running at more than seven per cent.
The main driver of turnover in October was the reopening of the Victorian economy, with the state enjoying a 5.1 per cent monthly jump that also contributed to large monthly gains in sales for clothing and footwear, for cafes, restaurants and takeaway services, and for department stores.
. . . and what I’ve been following in the global economy
.What happened:
The JP Morgan Global Composite PMI edged slightly lower (pdf) in November, falling to 53.1 from 53.3 in October.
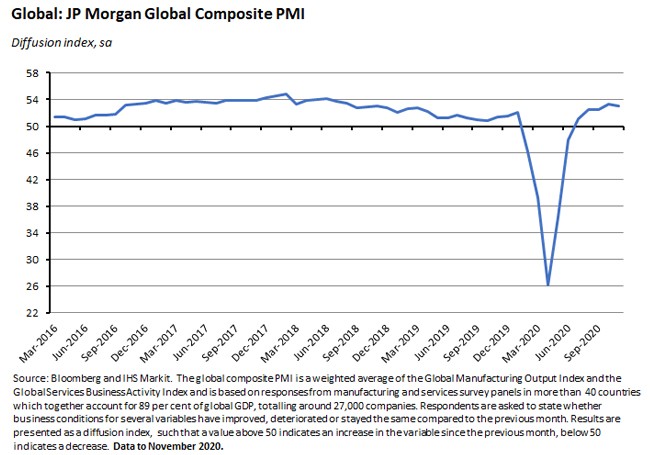
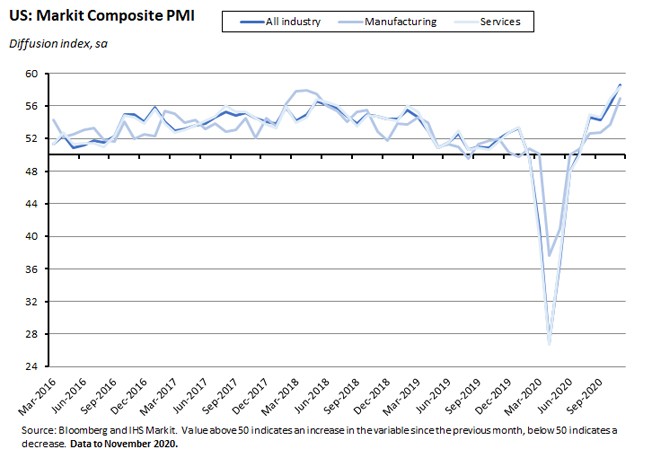
National composite PMI data showed economic activity rising in the US, China, Germany, India and Brazil as well as here in Australia while overall activity declined in Japan, France, the UK, Italy, Spain, Russia and Ireland.
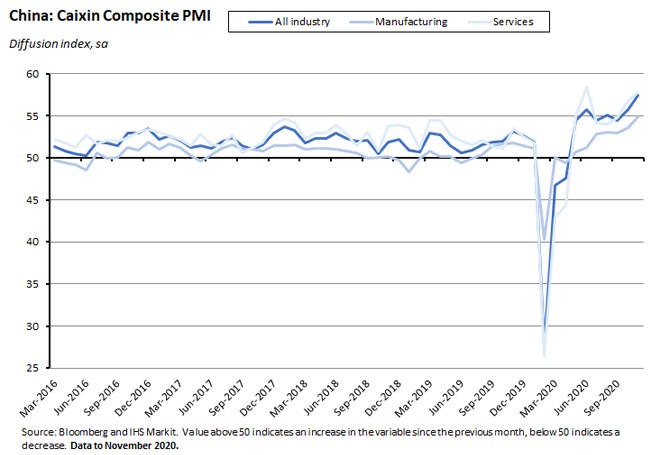
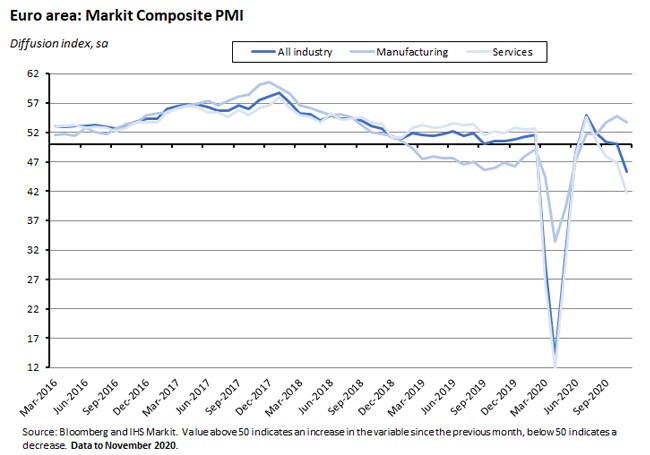
The Global Services Business Activity Index posted an index reading of 52.2 in November, down slightly from 52.9 in October. Activity growth was led by strong expansions in the US and China and activity was also up in India, Brazil and Australia, although services activity fell in the euro area, Japan, the UK and Russia.
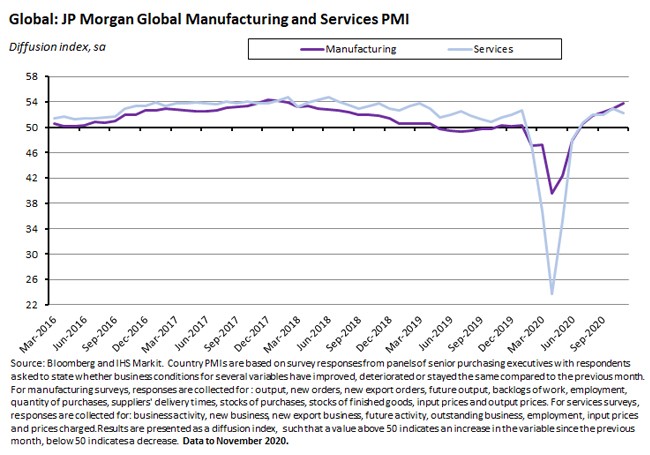
The Global Manufacturing PMI hit a 33-month high of 53.7 in November, up from 53 in October. Of the 30 economies for which data were available, 19 reported expansions and 11 reported contractions in activity. China and the US both reported strong output growth, while manufacturing activity in the Euro area slowed and Japan entered its twenty-third successive month of downturn.
Why it matters:
The headline PMI has now been signalling economic expansion for five consecutive months, although November’s results also picked up some emerging weakness across the services sector, particularly in Europe (see also next story). Global manufacturing output in November rose at its fastest pace since January 2018 and recorded one of the best growth rates seen over the past decade. And overall, output, new orders and employment all increased again last month, indicating that the global economic upturn continued in November.
That message was reinforced by the IHS Markit Global Sector PMI which showed (pdf) business activity higher in 18 out of 21 sectors in November, the largest total since September 2018. Similarly, 15 sectors registered higher employment last month, the most since November 2019.
Healthcare services registered by far the fastest rates of expansion, with the sectoral index hitting a record high. The global auto sector was the second strongest performer, followed by the machinery and equipment sector. Of the three sectors reporting a decline in activity in November (tourism and recreation, media, and transportation), tourism had the worst performance and has ranked bottom or second bottom since March.
What happened:
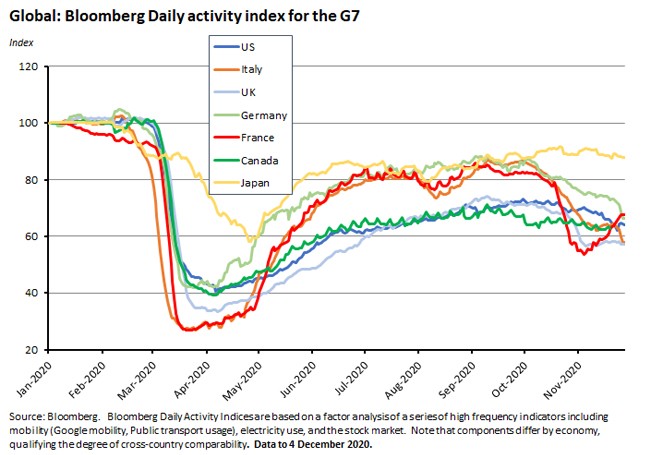
Bloomberg’s Alternative High Frequency data indicate that China in particular but emerging markets in general continued to outperform developed economies over the closing months of 2020. Activity in China at the start of December was about seven per cent above its pre-pandemic level, while activity in other emerging markets was about 17 per cent below the pre-pandemic level. For advanced economies, the shortfall is closer to 30 per cent (although Australia does better than many of its peers with a 20 per cent gap).
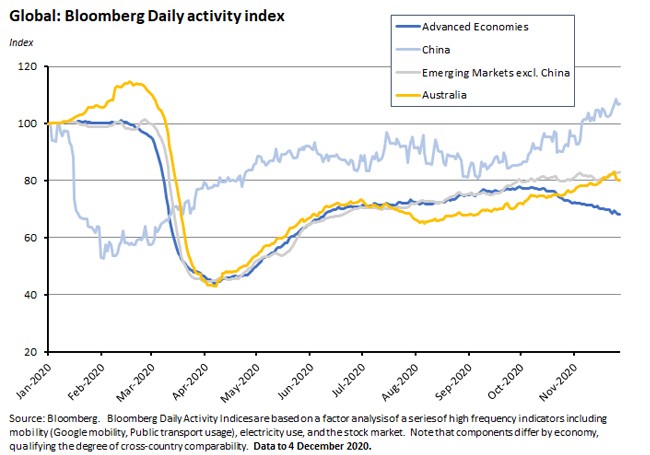
National indicators show that the level of economic activity slowed across much of the G7 in late November and early December. Activity has declined in Germany and Italy and remains weak in the United Kingdom. France continued its recovery from an earlier steep fall in activity, while the US indicator showed weakness into the first week in December. Only Japan continues to perform relatively well out of this group.
Why it matters:
While the PMI readings discussed above suggest that the global economic recovery was sustained into the final quarter of this year, Bloomberg’s set of alternative daily activity indicators (based around mobility indicators, electricity use and the stock market) implies that the surge in COVID-19 case numbers and the mix of official and individual reactions has begun to take a toll on economic growth in several of the world’s leading advanced economies, particularly in Europe. That in turn likely correlates with some of the weakness in services PMI noted above.
The activity data also show that activity – particularly mobility – has yet to return to pre-pandemic levels in many countries, with China a notable exception.
What I’ve been reading . . .
Australia sold Treasury notes at a negative yield this week for the first time ever.
The December 2020 RBA Bulletin includes articles on the Term Funding Facility (TFF), the impact of the pandemic on Australia’s tourism and education exports, long-term unemployment in Australia, and more. There is also an explainer on unconventional monetary policy.
Medium-term fiscal projections from the Parliamentary Budget Office out to 2030-31: the deficit on the underlying cash balance is expected to be 1.6 per cent of GDP by the end of the forecast period while net debt is projected to be almost 41 per cent of GDP in the same year.
The ABS has published the Tourism Satellite Account for 2019-20. The numbers show the initial – and devastating – impact of the pandemic as well as last summer’s bushfires, which hit tourism much harder than the economy overall. The ABS notes that all key tourism statistics fell in 2019-20 for the first time in the 16-year history of the series. Tourism real GDP slumped 18.9 per cent versus a fall of just 0.3 per cent in national GDP, with the former dropping to its lowest level since 2013-14. Tourism consumption plummeted 20.4 per cent in real terms, pulled down by a 19.7 per cent fall in domestic consumption and a 22.3 per cent fall in international consumption, which are now at their lowest levels since 2011-12 and 2013-14, respectively. In current price terms, tourism’s share of GVA fell to just 2.5 per cent, its lowest on record. The number of persons employed in tourism fell 6.6 per cent (a fall of 43,900 people) in 2019-20 compared to a fall of 0.1 per cent in employment across the Australian economy as a whole. Similarly, the fall in hours worked in tourism (10.9 per cent) was much steeper than the fall for the overall economy (0.8 per cent).
Also from the ABS, new statistics on Australian births and fertility rates. There were 305,832 registered births in Australia last year, down three per cent from 2018. The total fertility rate (births per woman) is estimated at 1.66 in 2019, down from 1.74 the year before and the lowest in the history of the series going back to 1935. Australia’s total fertility rate has been below the replacement rate of 2.1 since 1976.
The National Skills Commission has released a new paper on the shape of Australia’s post-COVID-19 workforce.
The IPA has published a new paper on The changing structure of the Australian economy with a focus on the decline in the share of national income accruing to family-run and small businesses.
ABARES’ December 2020 Agricultural Commodities report sees the gross value of agricultural production in 2020-21 rising by seven per cent to $65 billion, in an upward revision to its September forecast. The main driver has been a forecast upgrade to broadacre crop production due to the continuation of favourable growing conditions over the spring. Even so, the overall value of exports is still projected to fall by seven per cent over the year as recovery from drought is limiting both production and exports of livestock products and fibres, while prices for crops are falling back to world levels, which remain low following several years of record world production. ABARES notes that COVID-19 containment measures have only had a limited impact on agricultural markets due to consumers switching from restaurants to home consumption. The report does warn however that the introduction of anti-dumping measures by Beijing is expected to significantly reduce wine exports to China and while producers may be able to divert a limited amount of wine to existing markets such as the United Kingdom and the United States, less access to China will likely reduce production value and sales in 2020–21. In terms of other vulnerabilities, ABARES notes the share of agricultural exports to China in 2019–20 varied considerably across commodities, ranging from 10 per cent of wheat exports to 79 per cent of wool exports.
The Lowy Institute’s Richard McGregor calls for ‘less conflict and more statecraft’ in Australia-China relations.
Grattan has released a new report on climate change and health.
The Economist magazine has a briefing on the (uncertain) future of coal.
Related, Our World in Data looks at the falling cost of renewable energy.
And the IEA’s Energy Efficiency 2020 is also available.
One impact of the pandemic: a surge in Chinese exports to the United States as the latter stocks up on PPE gear, medical supplies, iPhones and computers. Despite President Trump’s efforts, China’s trade surplus with the United States has hit a record high in dollar terms this year.
The December 2020 issue of the IMF’s Finance & Development magazine is now online. Topics covered include the future of jobs and the impact of the pandemic on tourism-dependent economies. Martin Sandbu’s essay on the post-pandemic world is worth a look.
The BIS December quarterly review is here.
Martin Wolf recants his previous position and now disagrees with Milton Friedman’s views on the corporation (FT version, AFR version).
Three interesting columns from VoxEU this week. The first uses the variance in US policies across states and counties to examine differences in the effectiveness of various business and related restrictions on saving lives during the pandemic. While some appear to have been effective (stay-at-home orders, mandatory mask requirements) others (closures of low- and medium-risk businesses) do not seem to have been so. The second notes that foreign direct investment (FDI) inflows to the United States have suffered a sharp decline in the past two years despite 2017’s cut in the corporate tax rate from 35 per cent to 21 per cent and argues that foreign investor demand may have instead been driven more by the declining overall openness of the US economy as reflected in trade, migration and other policies. And the third provides a perspective on the relationship between different kinds of capitalist societies and different distributions of capital and labour incomes.
Might the oil-rich countries of the Middle East and North Africa offer a good testing ground for a Universal Basic Income (UBI)?
Douglas Irwin at the Peterson Institute offers a robust defence of the much-maligned Washington Consensus.
Also from Peterson, fiscal policy advice for Joe Biden and Congress. There are links to the Furman and Summers paper and slides at the bottom of the page.
Related, Noah Smith on the very different relationship between modern macro theory and policy during the pandemic relative to the global financial crisis.
From the Econtalk podcast: Branko Milanovic on the Big Questions of Economics. (Milanovic is the co-author of the third VoxEU column linked above).
Latest news
Already a member?
Login to view this content