
Overview
- The global fiscal position has worsened as the conflict in the Middle East places already-stretched government finances under additional strain.
- Fiscal risks are tilted firmly to the downside, with a range of structural challenges limiting the current room for fiscal manoeuvre. Although impacts will differ markedly on a country-by-country basis, with low income, net energy, and net food importers most exposed.
- Australia’s debt and deficit position is still in decent shape relative to that of many of our advanced economy peers. Even so, there is no room for complacency.
As the disruption to the Strait of Hormuz continues, analysts have found themselves tracking just how many tankers are prepared to run the gauntlet of the ‘dirty ceasefire.’ Meanwhile, warnings of an impending supply crunch continue to mount. In the absence of any major domestic data release this week, attention has turned to how this uncertain backdrop will influence the impending Commonwealth Budget.
The Treasurer will once again find himself juggling several balls. These include the political need to deliver cost-of-living relief to squeezed households while not unduly complicating the RBA’s fight against inflation; the requirement to respond to calls to strengthen Australia’s energy security and national economic resilience more broadly; and the desire to meet pre-war promises around tax reform, intergenerational equity, and improvements to the fiscal bottom line. With this in mind, this week we look at the latest IMF assessment of the global fiscal situation and try to put Australia’s position in an international context.
Finally, please note that there will be a new economics webinar on 14 May, hot on the heels of the May budget. As usual, it will be free for ACID members and I hope some readers are able to attend. For more details see: Budget 2026 and the New Economic (dis)Order
The global fiscal position has worsened
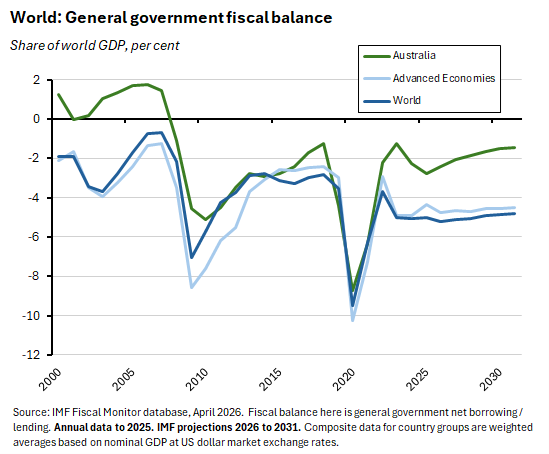
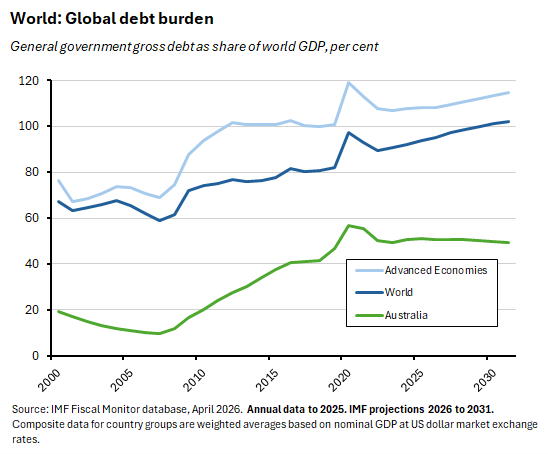
The IMF warned this month that the war in the Middle East is putting pressure on government budgets at a time when public finances are already under strain. The pandemic, the 2022 energy and food price shock, and rising trade disruptions had already generated higher government debt and deficits and weaker fiscal buffers. According to the April 2026 IMF Fiscal Monitor, for example, while the global economy overall proved resilient through the shocks of 2025, the fiscal position still deteriorated. Although the global fiscal deficit was largely unchanged at five per cent of GDP in 2025, global gross government debt rose to almost 94 per cent of GDP.
The Fund projects this global debt ratio to reach 100 per cent of GDP by 2029 – a level last seen in the aftermath of the Second World War. That increase is largely driven by the world’s two largest economies, with China and the United States expected to see rising debt burdens through until at least 2030. As a result of this trend, the deterioration in the average global debt ratio is worse than that suffered by the median economy.
The IMF is worried not only by the current elevated level of government debt as a share of GDP but also by the trajectory implied by fiscal and debt dynamics. For example, according to the Fiscal Monitor the IMF’s measure of the ‘global fiscal gap’ – the distance between the actual global primary (non-interest) fiscal balance and the balance that would be required to stabilise the global debt ratio – has worsened. A decade ago, the global fiscal gap was indicating a healthy margin in favour of sustainability. Now, it has shrunk to near-zero. Worryingly, the Fund says this is not a temporary cyclical shift but instead reflects structural changes in the form of permanently higher spending and lasting reductions in revenue.
Another IMF indicator flashing warning signals comes from the Fund’s ‘Debt-at-risk’ framework. This uses predictions of the percentile of the future public debt-to-GDP ratio to identify the potential level of public debt in a severe adverse scenario, where the latter is defined at the 95th percentile of the debt-to-GDP ratio at a three-year-ahead forecast horizon. According to this month’s Fiscal Monitor, global debt-at-risk now stands at 117.2 per cent of GDP for 2028. That is up from the Fund’s April 2025 estimate of 116.6 per cent.
And fiscal risks are tilted to the downside
The IMF also worries that fiscal risks are skewed to the downside. War in the Persian Gulf is an obvious driver here, with the Fund warning that a protracted conflict would ‘strain government finances through multiple reinforcing channels,’ including: higher government expenditure on measures to shelter households and firms such as fuel or food subsidies; weaker activity leading to lower tax takes in energy and food importing economies; tighter monetary policy feeding into higher borrowing costs, particularly in countries with higher debt burdens and/or significant short-term or floating rate debt; and higher risk spreads having a similar impact. The Monitor also points to a range of longer-running risks aside from the current conflict:
- Further geopolitical tensions could worsen fiscal positions both directly (via armed conflict) and indirectly (by encouraging increased spending on security, defence, and related industrial policies, thereby diverting public expenditure away from more productive uses). IMF research finds that a one-standard-deviation shock to the Geopolitical Fragmentation Index is associated with a medium-term increase of 1.5 percentage points in public debt ratios, for example.
- Increased trade protectionism and trade policy uncertainty can lead to lower growth and thereby worsen debt ratios.
- Elevated domestic political instability can also generate fiscal pressures. IMF economists have estimated that a one-standard-deviation increase in social unrest is associated with lower growth and a 0.2 percentage point increase in the primary deficit, for example.
- Threats to central bank independence – which can themselves arise in direct response to the pressures created by high debt burdens – could lift inflationary expectations and widen risk premia, pushing up financing costs.
- Shifts in the ownership of sovereign bonds are creating new fragilities in market structure. After 2010, the domestic official sector absorbed much of the increase in public debt as central banks purchased government bonds as part of their quantitative easing (QE) programs. But as monetary policy has normalised, and as QE has shifted to QT, new debt issuance must increasingly be placed with private investors. And here, an ongoing shift in ownership towards nonbank financial intermediaries such as hedge funds has increased the risk of market disruption.
- The increased scale of bond issuance, particularly by the United States, might be eroding the safety and liquidity premium associated with government bonds (their ‘convenience yield’). A lower convenience yield on US Treasuries implies an increase in the global risk-free cost of borrowing, pushing up financing costs.
- A shift by some economies towards greater short-term debt issuance (to take advantage of lower costs in an environment where yield curves are sloping upwards) requires more frequent refinancing, implying greater vulnerability to shifts in market conditions or investor sentiment (that is, higher rollover risk).
- Population ageing in advanced economies is creating risks associated with higher age-related spending, slower growth, and a shrinking revenue base. Moreover, there is some evidence that these pressures may now be intensifying faster than previously expected.
- In emerging economies, there are significant fiscal risks associated with the contingent liabilities of State-Owned Enterprises (SOEs), natural disasters, and banking sector vulnerabilities.
- For poor developing economies, a reduction in aid from advanced economies as they shift spending towards other priorities is another important source of budget pressure.
Finally, the unfolding AI story represents two-sided fiscal risks. On the one hand, a significant AI-driven boost to productivity and potential growth rates would improve debt-to-GDP ratios by lifting the denominator. On the other hand, should the current AI boom in financial markets end in a disorderly correction, the resultant fall in economic activity and tightening in global financial conditions would instead send those debt-to-GDP ratios higher. It is also possible that both scenarios eventuate, over different time horizons (a short-term correction followed by a longer-term productivity pay-off).
Australia in international perspective
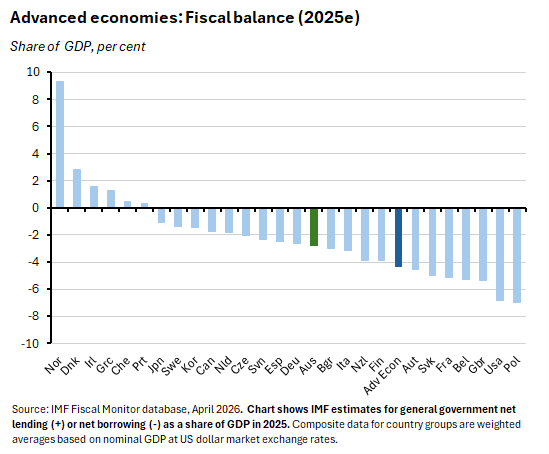
So, how does Australia’s fiscal position look on the IMF’s numbers? According to the Monitor, Australia’s general government (consolidated federal, state, and local government – see next story) deficit last year was around 2.8 per cent of GDP. That was well below the advanced economy average of 4.4 per cent, which was boosted by large budget shortfalls in the United Kingdom (5.4 per cent) and the United States (6.8 per cent).
And for all the talk of runaway spending, Australian general government expenditure as a share of GDP in 2025 (at 39.5 per cent of GDP) was also below the advanced economy average (40.7 per cent) in the same year.
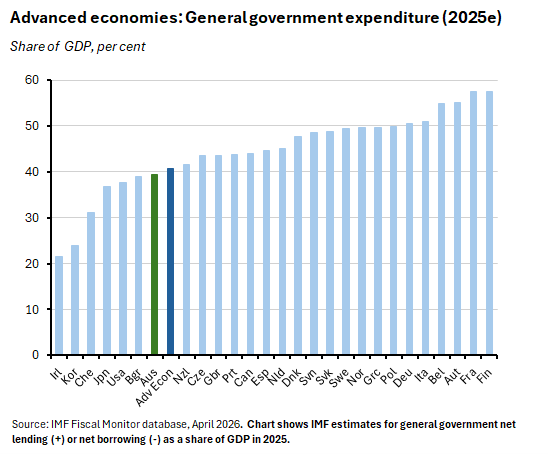
Where Australia did less well, however, was in the scale of fiscal consolidation since the pandemic. Australia did manage to wind back general government spending by almost five percentage points of GDP – from 44.3 per cent in 2020 to 39.5 per cent last year. But this lagged the advanced economy average fiscal consolidation by about half a percentage point of GDP.
On the other side of the fiscal accounts, Australian general government revenue in 2025 was 36.7 per cent of GDP. That was higher than the corresponding advanced economy average (36.3 per cent).
Turn to debt, and our relative position looks (even) better. Australia’s ratio of gross general government debt to GDP was 51 per cent last year. That was less than half the advanced economy average of 108 per cent.
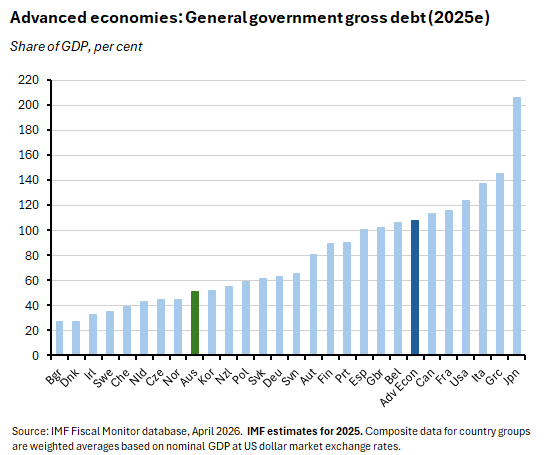
On the IMF’s projections, by 2031 Australia’s debt burden is expected to fall by about 1.9 percentage points of GDP, to 49.1 per cent. That compares to a 6.8 percentage points increase in the advanced economy average, to almost 115 per cent of GDP.
As Budget 2026 approaches, then, Australia’s fiscal position continues to be stronger than that of many of our peers. But with Australia vulnerable to many of the same fiscal risks and pressures identified by the IMF and summarised above, there is no room for complacency.
Other Australian data points to note
Related to the previous discussion, this week saw the ABS publish new Government Finance Statistics (GFS) for the 2024-25 financial year. As a quick reminder, the GFS data cover the general government sector, which comprises the Commonwealth government, all state and territory governments, and all local government authorities, plus non-profit institutions (NPIs) engaged in non-market production that are controlled by governments. It also includes a subsector called ‘Control not further defined’ which captures public universities. The total public sector then consists of this general government sector plus public non-financial corporations plus public financial corporations.
The general government and the public sector results presented here are both consolidated accounts, in that they adjust for transfers between the various layers of government to avoid the double counting that would otherwise arise – since a large share of state and territory expenditures are financed by grants from the Commonwealth government, for example.
According to the ABS numbers, the general government net operating balance in 2024-25 was a deficit of $8.2 billion. That represented a deterioration of $26.6 billion from a surplus of $18.4 billion in 2023-24.
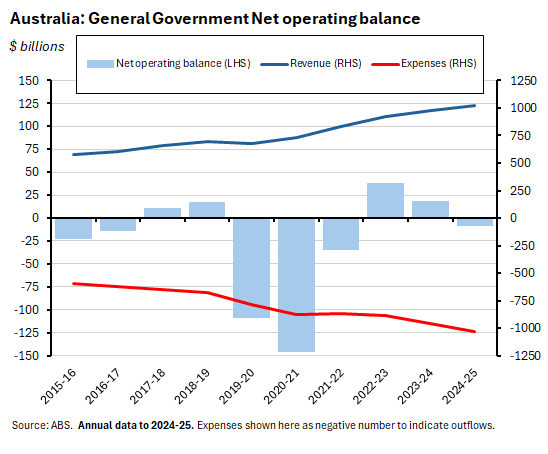
The net operating balance measures the difference between transactions in revenues and transactions in expenses. In 2024-25, total revenue rose 4.5 per cent ($44.2 billion) to $1,022 billion, mainly reflecting a 4.7 per cent ($37.4 billion) increase in taxation revenue to roughly $839 billion. That was outpaced by growth of 7.4 per cent ($70.8 billion) in general government expenses, which increased to $1,031 billion.
Note that 2024-25 marked the first time both general government revenue and expenses exceeded one trillion dollars.
Across the public sector, total revenue was up by five per cent to $1,143 billion while total expenses rose 7.1 per cent to $1,165 billion, producing a larger deficit on the net operating balance of $22 billion.
GFS net lending/borrowing measures the overall financing requirement of government and is equal to the net operating balance less the net acquisition of non-financial assets. The latter includes investment (gross fixed capital formation) less depreciation, changes in inventories, and other transactions in non-financial assets. In 2024-25, total net acquisition of non-financial assets by the general government was $61.2 billion, giving a general government net borrowing requirement of $69.3 billion. For the total public sector, the net borrowing requirement was considerably larger, at $112.2 billion, reflecting investment and related activity by public sector corporations.
Finally, general government net debt rose from $846.6 billion (31.6 per cent of GDP) in 2022-23 to $954.9 billion (34.4 per cent of GDP) in 2024-25.
For more details, see the ABS Insights into Government Finance Statistics 2024-25.
Also related, the ABS published Taxation Revenue for the 2024-25 financial year. Across all levels of government, total taxation revenue was $839 billion or 30.2 per cent of GDP.
National Ecosystem Accounts (experimental estimates) for 2022-23.
From last Friday, experimental estimates for the Australian Defence Industry Account. According to the ABS, in the 2024-25 financial year the defence industry employed 63,500 people and represented almost 0.5 per cent of total gross value added in the economy (about $12 billion).
Further reading and listening
- As Budget night approaches, the AFR reminds readers about the growing role played by off-budget structures in government financing, manifested in a growing gap between the underlying and headline budget balance. For more background, see this helpful explainer from the Parliamentary Budget Office on alternative financing of government policies.
- Grattan asks, should Australia strive for ‘energy sovereignty?’
- How the ACCC’s court cases against Woolworths and Coles could change shopping in Australia.
- A research paper from the Productivity Commission on improving health outcomes through hospital funding arrangements.
- This RBA Bulletin article considers cash use in Australia.
- The Economist magazine warns that global energy markets are on the verge of a disaster.
- A useful Paul Krugman column arguing that those IMF projections for the world economic outlook we reviewed last week could be too optimistic, given the implications of a ‘bottom up’ approach that starts the forecasting process with physical supply constraints and the requirements for demand destruction, rather than a top down one that assumes different oil prices. According to Krugman, the first approach can give much higher oil price estimates based on the need to generate the level demand destruction required to balance the oil market.
- Some interesting WSJ reporting on President Trump’s handling of the war with Iran: ‘A president who thrives on drama is bringing an even more intense version of his unorthodox, maximalist approach to a new situation—fighting a war. He is veering between belligerent and conciliatory approaches and grappling behind the scenes with just how badly things could go wrong.’
- Duncan Weldon explains how to wage economic warfare.
- Brad Seter sets out some petrodollar myths and realities.
- An FT Big Read offers six lessons from history’s greatest financial crises (and see also this week’s listening recommendations below).
- The OECD’s Taxing Wages 2026 reports that for a fourth consecutive year, effective tax rates on labour income (for a single worker, earning the average wage) rose across most OECD members last year. According to the country note for Australia, the average single worker faced a net average tax rate of 23.5 per cent in 2025 (14th lowest among OECD countries), compared with the OECD average of 25.1 per cent. In other words, in Australia the take-home pay of an average single worker, after tax and benefits, was 76.5 per cent of their gross wage, compared with the OECD average of 74.9 per cent. An average married worker with two children in Australia had a take-home pay, after tax and family benefits, of 83.6 per cent of their gross wage, compared to 85.3 per cent for the OECD average. The tax wedge for the average single worker in Australia fell to 27.9 per cent last year, which compares to an OECD average of 35.1 per cent. The tax wedge for an average married Australian worker with two children was 21.2 per cent in 2025, compared to the OECD average of 26.2 per cent. (The tax wedge shows total taxes on labour paid by employees and employers, minus cash benefits received by working families, as a share of labour costs. A higher tax wedge tends to reduce incentives to work and hire by reducing take‑home pay and increasing employers’ labour costs.)
- What thousand-year-old companies know about resilience.
- The relationship between the neutral rate of interest and the labour share.
- On gaming.
- The Odd Lots podcast talks to Daniel ‘The Prize’ Yergin about how the current war in the Middle East will lead to the emergence of a different energy world.
- The FT has a series of great economics and finance podcasts. We frequently link to episodes of Unhedged and the Economics Show, with this week’s Unhedged offering giving a take on the talk at the FT Commodities Global Summit. Now there is a third FT show to add to the list, with a new series on The Story of Money, which kicks off with an episode discussing How ancient Mesopotamians solved runaway debt.
Latest news
Already a member?
Login to view this content